
Top Tools for Financial Modelling: The Complete Stack by Role
Key Takeaways
It is a stack, not a tool. Excel sits at the centre; accelerators, data sources, planning platforms, and automation surround it. Pick the layers you actually need.
Match the stack to the role. A solo consultant, a banking analyst, a SaaS founder, and a corporate FP&A team need genuinely different tools - copying someone else's stack wastes money and effort.
Excel is still the core. No tool has displaced it for bespoke modelling. Invest in the discipline of building clean models before adding software.
Planning platforms earn their cost when Excel gets fragile. Many users, consolidation, and workflow control are the trigger - not model complexity alone.
AI assistants are copilots, not replacements. Use ChatGPT for technical formula and code work, Claude for review, structure, and writing - and always verify the numbers yourself.
The best modelling setup is not the most expensive one. It is the smallest stack that covers your data, your model, your validation, and your output - with AI accelerating each step and a human owning the result.
There is no single "best" tool for financial modelling - there is a stack. Excel remains the source of truth for almost every serious model, but around it sits a layer of accelerators, data sources, planning platforms, and automation tools that do the jobs Excel does badly. The right combination depends on what you model and who you model it for: a solo consultant, an investment banking analyst, a startup founder, and a corporate FP&A team all need different things. This guide lays out the modern modelling toolkit, recommends a concrete stack for each role, and shows where AI assistants like Claude and ChatGPT genuinely belong in the workflow.
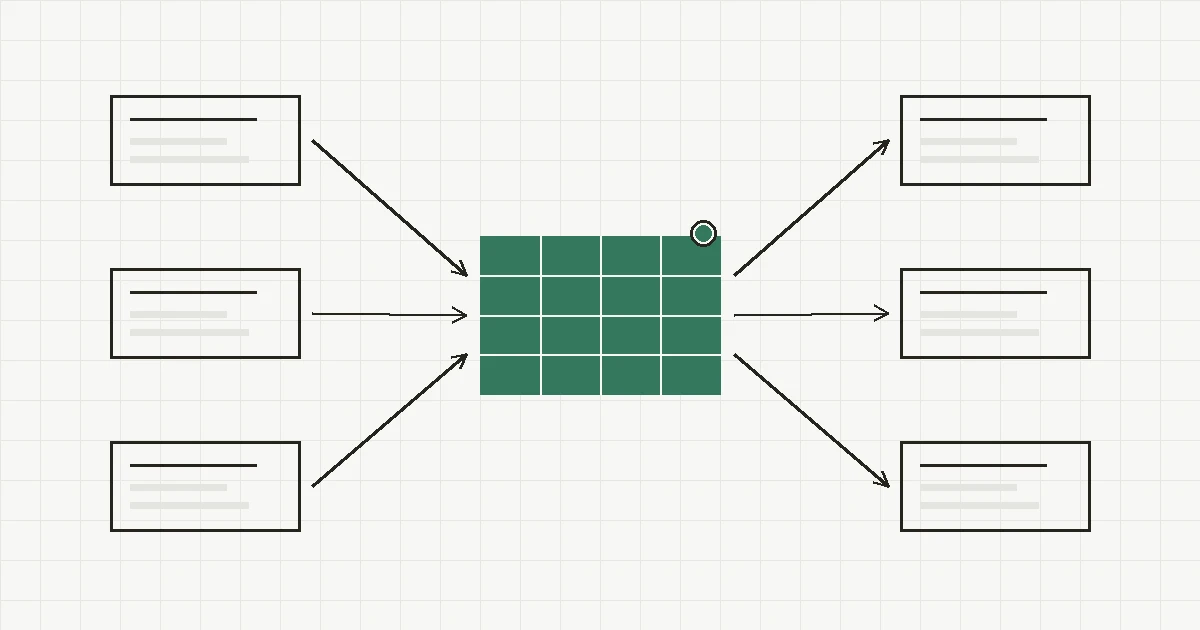
The modelling pipeline - and where AI assistants plug in alongside it
Introduction: a stack, not a single tool
Ask ten finance professionals what software they use and you will get ten different answers - but almost all of them start with Excel. The disagreement is about everything around it: how data gets in, how the model is audited, how outputs reach a board, and how repetitive work gets automated.
Treat financial modelling tools as a layered stack:
- Core modelling - where the logic lives.
- Accelerators - add-ins that speed up formatting, auditing, and data pulls.
- Data sources - market data, comps, filings, and estimates.
- Planning platforms - multi-user budgeting and forecasting when Excel gets fragile.
- Automation - code that makes models repeatable and auditable.
- Output - dashboards and presentation-grade decks.
- AI copilots - assistants that help build, debug, review, and explain.
The sections below walk through each layer, then assemble concrete stacks by role.
The core modelling layer: still Excel
For DCFs, three-statement models, LBOs, real estate models, project finance, and investor decks, Excel remains the industry standard. It is flexible, transparent, universally understood, and easy to hand to a counterparty. No planning platform has displaced it for bespoke deal work.
Google Sheets is a reasonable substitute for lightweight, collaborative models - early-stage startups often live there - but it slows down on large models and lacks some of Excel's modelling muscle.
If you are building in Excel, the discipline matters more than the tool. See our guide to Excel financial modelling best practices for the structure, colour, and formula conventions that separate professional models from fragile ones.
Excel accelerators
These add-ins do not replace Excel - they make it faster:
| Tool | What it does |
|---|---|
| Macabacus | Formatting, formula auditing, comps, and PowerPoint linking. The most popular productivity add-in in banking and consulting. |
| FactSet / Capital IQ Excel add-ins | Pull market data, financials, and estimates directly into the sheet. |
| Power Query | Built into Excel; cleans and transforms data before it hits the model. Underrated and essential. |
| AI add-ins | A growing category that drafts formulas, audits models, and answers questions inside the workbook. |
If you do one thing to speed up your modelling, learn Power Query - it is free, already installed, and removes the most tedious part of the job.
Data cleaning and transformation
Real-world data is messy: accounting exports, CSV dumps, e-commerce reports, database extracts. Cleaning it is its own discipline.
- Power Query - the default for Excel users; repeatable, no code.
- Python / pandas - for large datasets, complex joins, and anything you want scripted.
- Alteryx - a visual, enterprise-grade data-prep platform when teams need shared, governed workflows.
Visualization and dashboarding
When reporting is recurring - KPI packs, board dashboards, monthly reviews - a dedicated BI tool beats rebuilding charts in Excel:
- Power BI - the Microsoft-native choice; integrates tightly with Excel and the rest of the stack.
- Tableau - strong for exploratory, interactive analysis.
- Looker Studio - free, web-based, good for lightweight dashboards.
Investment research and market data
For comps, precedent transactions, consensus estimates, filings, and transcripts, the data terminal often matters more than the modelling software:
- Bloomberg, FactSet, S&P Capital IQ - the institutional standard. Powerful and expensive: Bloomberg Terminal runs around $24,000 per seat per year, and FactSet is typically quoted in the low five figures depending on the package.
- AlphaSense - research, transcripts, filings, and market intelligence with strong search.
- Koyfin, TIKR - much cheaper alternatives that cover most of what an independent analyst needs.
If you are not at an institution with a terminal budget, Koyfin or TIKR plus public filings will take you a long way.
FP&A and planning platforms
Excel becomes fragile when many people touch the same model: version conflicts, broken links, no approval workflow, no ERP integration. That is when a planning platform earns its cost:
| Platform | Best for |
|---|---|
| Anaplan | Complex enterprise planning across many dimensions. |
| Pigment | Flexible scenario modelling; increasingly popular. |
| Workday Adaptive Planning, Planful, OneStream, Vena | Corporate budgeting, consolidation, and rolling forecasts. |
| Cube, Datarails | Excel-friendly FP&A layers that sit on top of your existing sheets. |
| Mosaic, Runway, Pry | Startup and SaaS planning - burn, runway, ARR, headcount. |
The trade-off is always the same: platforms add control, multi-user workflows, and integrations, but cost more and are less flexible than a blank spreadsheet.
Automation and reproducible models
When a model has repetitive data pulls, many scenarios, simulations, or needs to run as an app, code beats a spreadsheet:
- Python + pandas - heavy computation, Monte Carlo analysis, optimization.
- SQL + dbt - pulling and transforming data from databases reliably.
- Jupyter - exploratory analysis and documentation.
- Streamlit - turning a model into a simple internal web app.
Excel is still better for communicating assumptions and handing a model to a non-technical reader. Python is better for brute-force computation and reproducibility. Mature teams use both.
Recommended stacks by role
Solo analyst or consultant
Excel + Power Query + Macabacus + PowerPoint + Koyfin or TIKR
The best value stack. Excel is the modelling environment, Power Query handles messy data, Macabacus speeds up formatting and auditing, and Koyfin or TIKR provides market data without a Bloomberg-sized bill.
Investment banking and valuation
Excel + Capital IQ / FactSet / Bloomberg + Macabacus + Think-Cell
For comps, precedent transactions, and consensus estimates, the data terminal matters more than the modelling software. Macabacus and Think-Cell turn model outputs into deal-quality decks.
Startup and SaaS planning
Excel or Google Sheets + Cube / Mosaic / Pigment / Runway
For SaaS, the model is only half the job - the other half is linking revenue, headcount, burn, runway, ARR, churn, and CAC into a living plan. Purpose-built planning tools handle that workflow far better than a static sheet. See our SaaS financial model guide and startup financial model guide for the modelling side.
Corporate FP&A team
Anaplan / Pigment / Workday Adaptive Planning / Planful / OneStream / Vena / Datarails
These earn their cost once Excel becomes too fragile: many departments, many budget owners, version-control problems, consolidation, approval workflows, ERP links, and rolling forecasts.
Advanced or automated modelling
Python + pandas + SQL + Streamlit + Excel output
Best when the model has repetitive data pulls, many scenarios, portfolio optimization, simulations, or APIs - or needs to run as a web app.
Where AI fits: Claude and ChatGPT as copilots
AI assistants belong in the modelling stack - but as copilots, not replacements for Excel. Think of them as a junior analyst, a model auditor, and a memo drafter sitting next to you.
| Workflow step | Where AI helps |
|---|---|
| Building model structure | Sketching architecture and sheet layout |
| Writing and debugging formulas | Drafting and fixing Excel formulas |
| Explaining model logic | Translating a model into plain language |
| Scenario design | Framing base, bull, and bear cases |
| Python modelling | Writing computation and optimization code |
| Drafting the assumptions memo | Turning inputs into a written rationale |
| Investor-facing narrative | Sharpening the "so what" of the numbers |
ChatGPT - the technical modelling helper
ChatGPT is strongest on the technical side: building model architecture, writing and debugging Excel formulas, creating Python models, scenario and Monte Carlo analysis, portfolio optimization, cleaning data, and generating presentation outputs. It works well with uploaded files, code execution, and longer project work.
A representative use case: "Here is my real estate DCF. Audit the formulas, check for circular references, stress-test the assumptions, and rewrite the model logic in Python."
Claude - the reviewer and writer
Claude is strongest on thinking, structuring, reviewing, and writing: reviewing model logic, explaining assumptions clearly, drafting investment memos and board commentary, turning outputs into a narrative, summarizing diligence materials, and sanity-checking whether a model conceptually makes sense.
A representative use case: "Review this model and tell me whether the investment thesis is actually supported by the numbers."
The right split
| Task | Lean on |
|---|---|
| Excel formula help | ChatGPT |
| Python model creation | ChatGPT |
| Debugging calculations | ChatGPT |
| Model audit checklist | ChatGPT and Claude |
| Investment memo | Claude |
| Investor deck narrative | Claude first, ChatGPT second |
| Market and research synthesis | ChatGPT with web search |
| Sensitivity and scenario logic | ChatGPT |
| Assumption wording | Claude |
A practical AI-enhanced workflow
- Claude - structure the investment logic and the assumptions.
- ChatGPT - convert that into Excel or Python model architecture.
- Excel - build and own the actual model.
- ChatGPT - audit formulas, stress-test, and automate scenarios.
- Claude - write the investment memo and sharpen the conclusion.
- ChatGPT / PowerPoint - turn outputs into charts, tables, and deck pages.
In short: AI proposes, Excel calculates, the analyst verifies.
The key caveat
Do not let AI be the final authority on a model. Assistants can miss subtle formula errors, unit mismatches, circular references, timing errors, and accounting-logic problems. They are excellent at drafting, explaining, and reviewing - but the analyst owns the model and signs off on the numbers.
For the kinds of errors to watch for, see our guide to common financial modelling mistakes, and use sensitivity analysis to test how fragile your conclusions really are.
A top 10 to anchor your stack
- Excel - still non-negotiable as the modelling core.
- Power Query - underrated; essential for cleaning messy exports.
- Macabacus - the best Excel and PowerPoint productivity add-in for finance.
- Think-Cell - the standard for professional charts in decks.
- Python / pandas - best for heavy analysis, simulations, and automation.
- Power BI - the Microsoft-native reporting and dashboard layer.
- FactSet / Capital IQ / Bloomberg - the institutional data sources.
- Koyfin / TIKR - the best affordable research alternatives.
- Pigment / Anaplan / Planful - serious FP&A platforms for teams.
- Claude and ChatGPT - copilots for building, debugging, reviewing, and writing.

Alex Tapio
Founder of Finamodel • Professional Financial Modeller • Ex-Deloitte







