 Thunkable Financial Model
Dev Tools Startup Financials (Free Excel Download)
No-code platform to build and publish native mobile apps for iOS and Android.



professionals from Deloitte
Used by professionals from






About this model
Thunkable is a no-code platform for building and publishing native iOS and Android apps. Its visual editor supports device features, live testing, collaboration, and integrations without requiring users to write code.
It sells per-seat SaaS subscriptions and also earns a share of AdMob revenue generated inside customer apps, with future Stripe transaction sharing planned. Thousands of weekly signups and a 41% sign-up conversion rate support its product-led funnel.
The model is seat-based ARR with revenue-share upside. Signups, PQLs, paid seats, price, expansion, and churn build SaaS revenue; app advertising and payments add variable income. Organic acquisition and enterprise sales drive scale.
A turnkey financial model
Live formulas, no hardcoded values
Outputs are driven by live formulas, so the workbook updates from its assumptions instead of relying on hardcoded results.
All assumptions in one tab
Inputs are clearly marked in the Assumptions tab and separated from calculations, making it clear what to change and what to leave intact.
Statements always balancing
For integrated-statement models, the balance sheet, cash flow, and supporting schedules tie through properly.
Distinct schedules for clarity
Debt, working capital, taxes, and cash flow can get messy quickly. We group calculations in clear schedules, not across disconnected tabs.
No hidden macros or external links
There are no unexplained external workbook links or macros to undermine auditability or portability.
Changes flow through the model
Update a key driver and see the impact carry through the forecast, financing, and return outputs. We never use hardcoded numbers in formulas.
About Thunkable
thunkable.com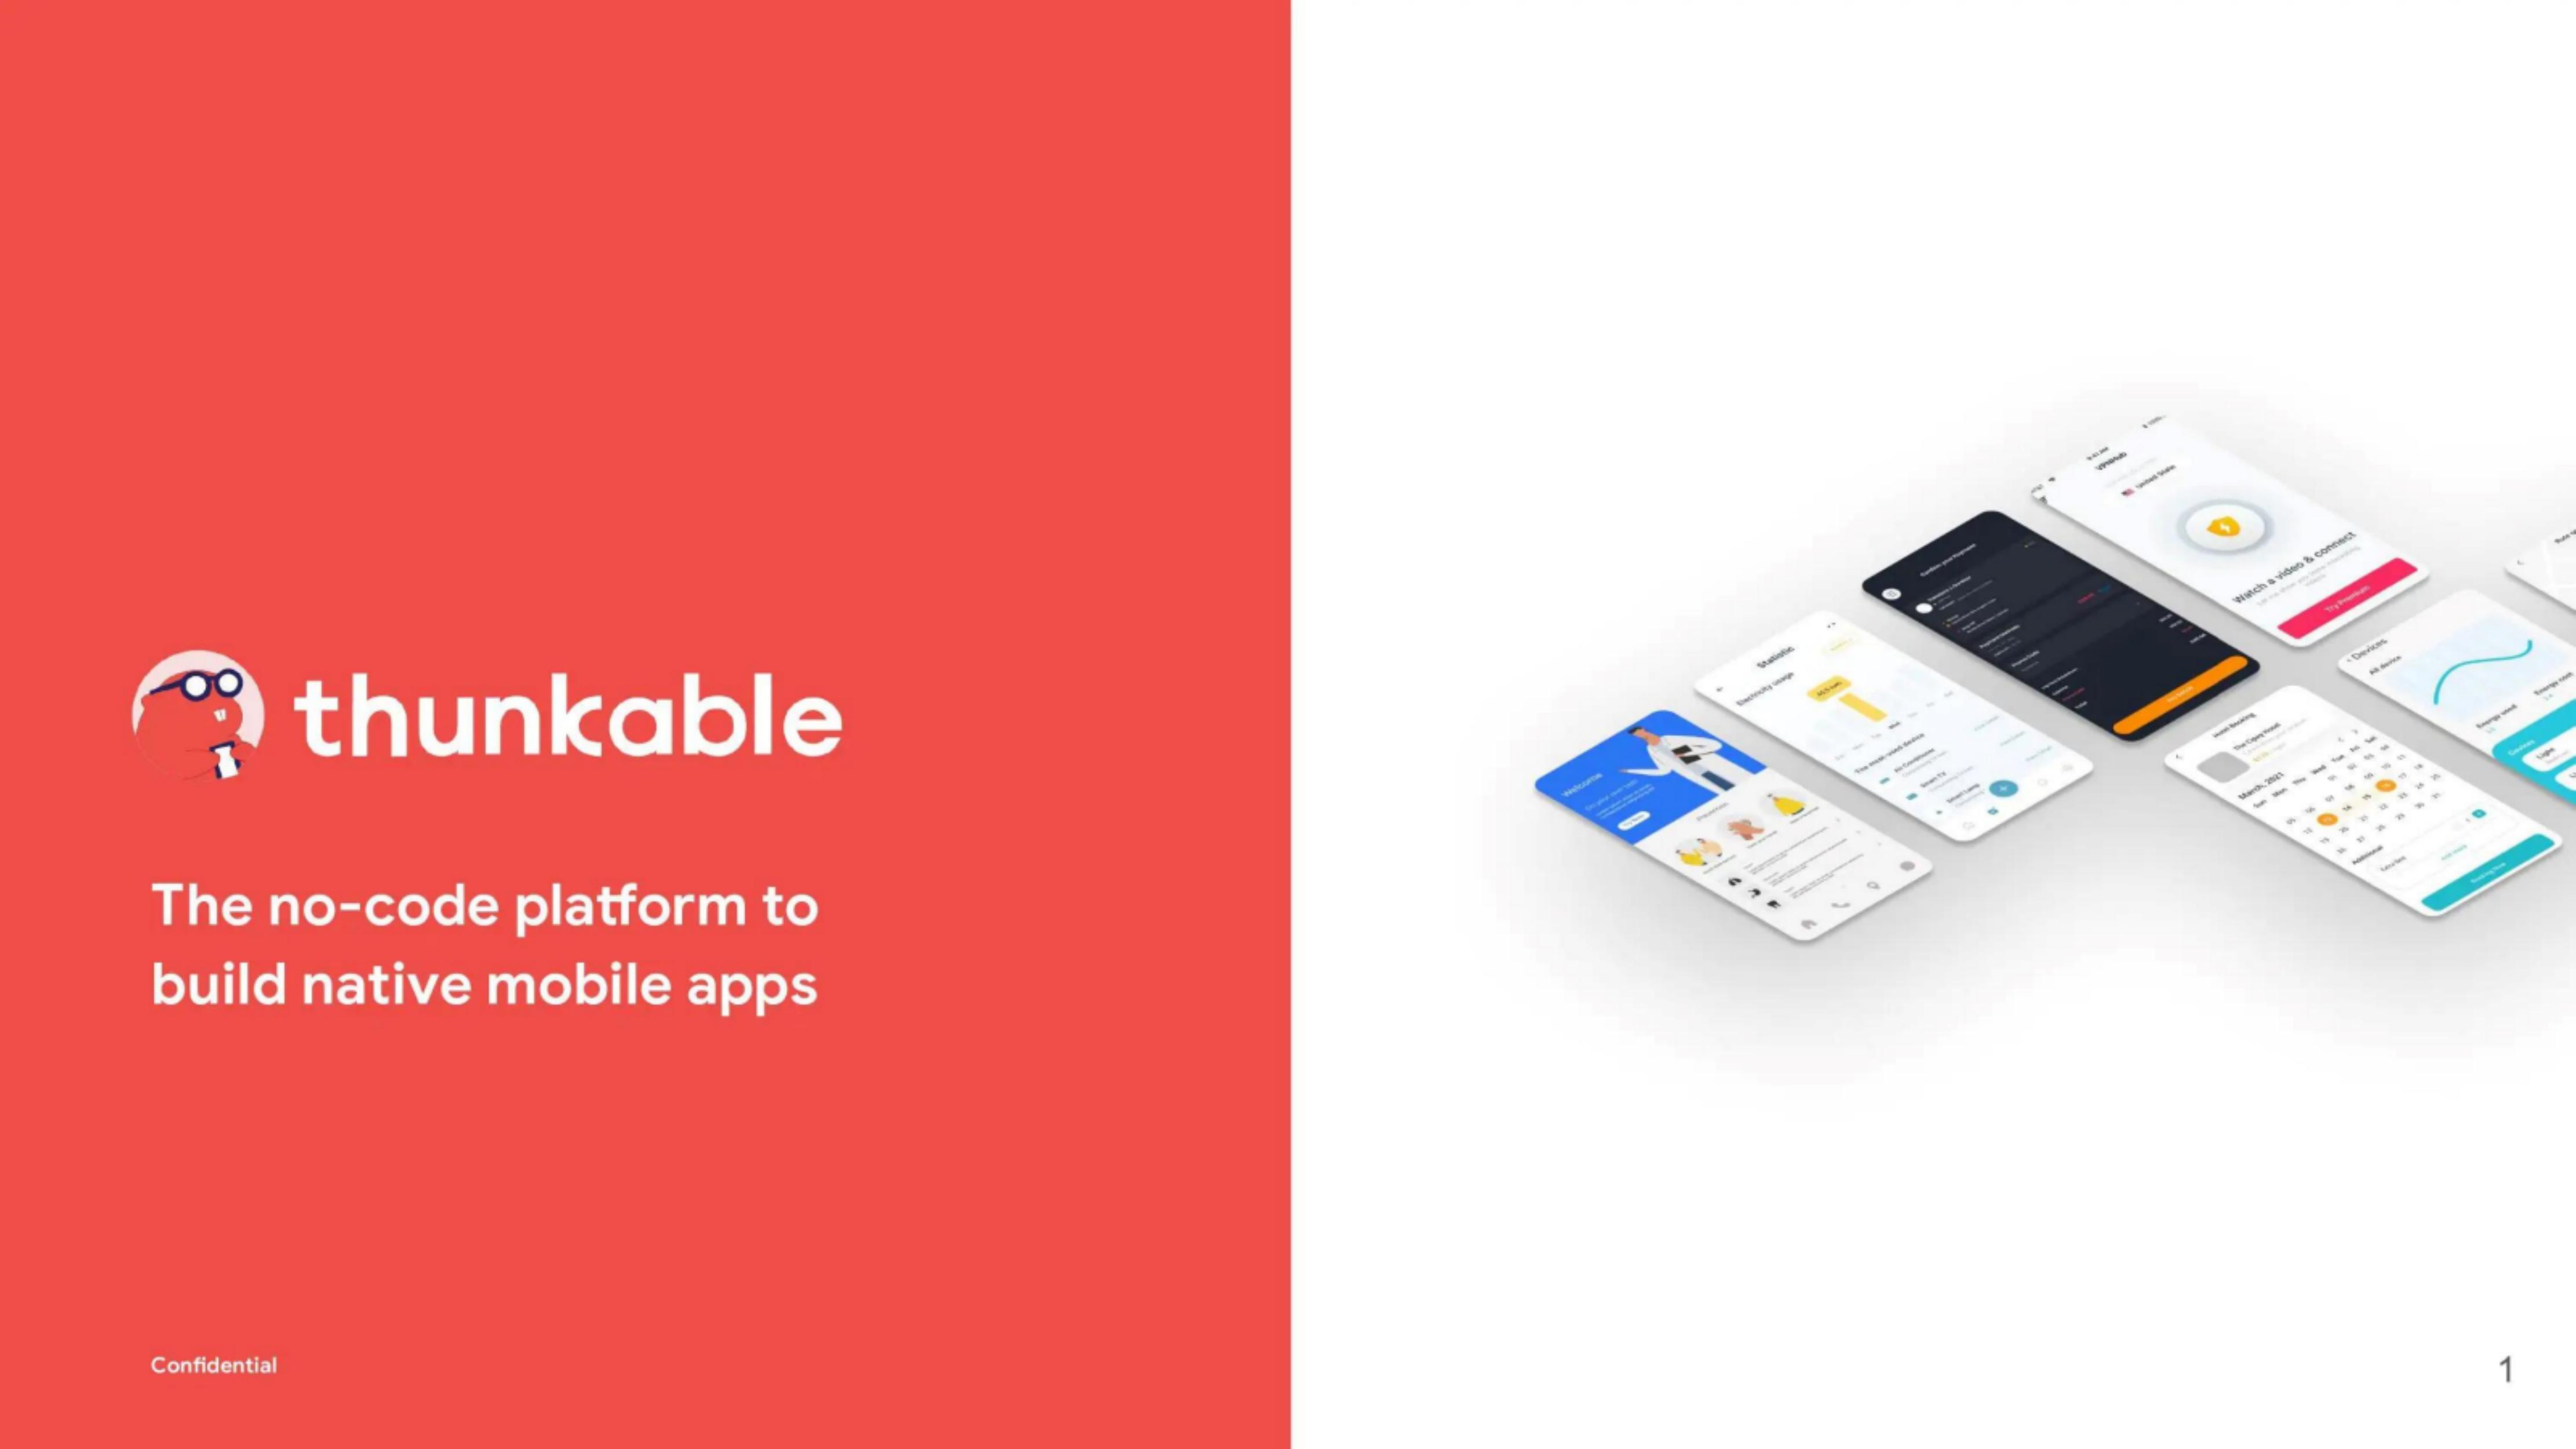
How to build a detailed financial model for Thunkable
A complete walkthrough of the business, drivers, and assumptions behind the downloadable Thunkable model - distilled from its pitch deck and publicly available information.
Product & value proposition
Visual drag-and-drop editor (WYSIWYG) that lets non-technical users build native iOS and Android apps without writing code. Key differentiators:
- No-code block logic; live browser + device testing; real-time collaboration.
- Native device capabilities (Bluetooth, push notifications, GPS, camera, accelerometer, microphone) - going beyond web wrappers.
- Broad integration ecosystem: Google Sheets, Airtable, Firebase, Figma, LottieFiles, Azure Cognitive Services, Webflow, Google AdMob.
- Revenue-share integrations planned: Stripe transactions, Google AdMob ad revenue.
- Seat-based pricing model, explicitly compared to Slack and Dropbox.
Market
No TAM/SAM/SOM dollar figures in deck. Market context provided as demand-side proxies:
- 4.2h/day time spent in smartphone apps (↑30% from 2019)
- 28M active software developers globally (↑38% from 2019)
- 11.9M new mobile apps in 2020 (↑57% from 2018)
- Simple/medium mobile app cost: $40–120K+
No explicit TAM/SAM/SOM sizing.
Revenue model
- Primary: Seat-based SaaS subscription - per-seat pricing, like Slack/Dropbox. Exact plan tiers and prices not disclosed.
- Secondary (current): Ad revenue share - Thunkable collects a portion of Google AdMob ad revenue generated inside apps built on the platform.
- Secondary (future): Transaction revenue share - collect a portion of Stripe transaction volume processed through apps.
- Future: Enterprise contracts - multi-seat enterprise service contracts via direct sales team.
- Channels: self-serve (SEO + SEM + community) + enterprise sales (inbound + outbound).
Traction & metrics
All from unless noted:
- Thousands of sign-ups per week (exact number not stated).
- 41% sign-up conversion rate.
- 100s of Product Qualified Leads (PQLs) per week.
- Traffic mix: 38% organic search, 42% direct, 15% referrals, 3% social, 2% paid search - almost entirely organic.
- No revenue figures, ARR, customer count, or churn in deck.
Competition / moat
Moat framing from:
- Switching costs: rebuilding a Thunkable app in code or on another platform requires replicating logic and reconnecting integrations - many of which may not exist elsewhere.
- Lower TCO: no need for costly mobile developers post-launch; any non-technical resource can maintain apps.
- Platform lock-in: Thunkable simplifies ongoing app store and device OS updates, reducing the need to re-engage developers.
Named competitors: not explicitly identified in classified slides. Implied competitors are traditional code-based mobile dev and other no-code/low-code platforms (Adalo, Glide, Bubble - not named in deck).
Team & funding ask / use of funds
- Raising to invest in non-organic growth: paid marketing (SEM) and an active sales team.
- Three investment pillars: (1) Self-Serve (SEO + SEM + community), (2) Enterprise Contracts (direct sales + multi-seat), (3) Revenue Share (engineering investment in monetization integrations).
- Team composition, founder names, headcount: not in classified slides.
Recommended financial model
- Archetype + why: SaaS ARR model with a seat-based cohort structure, supplemented by a revenue-share line item. Thunkable explicitly uses per-seat SaaS pricing (like Slack/Dropbox), has a funnel-to-PQL conversion metric, and is investing in enterprise sales - all classic B2B SaaS drivers. The ad/transaction revenue share adds a usage-based layer but is secondary.
- Forecast horizon & granularity: 5 years (Year 1–2 monthly, Year 3–5 annual). Monthly granularity is appropriate given they are tracking weekly sign-up and PQL volumes.
- Key drivers & assumptions:
- Weekly sign-up volume
- Sign-up → PQL conversion: 41%
- Traffic growth rate (organic):
- PQL → paid conversion rate:
- Average seats per paying customer:
- Average revenue per seat per month (ARPU):
- Logo churn (annual):
- Seat expansion (net revenue retention):
- Revenue share (AdMob):
- Headcount ramp (sales team):
- CAC (paid):
- Gross margin:
- Scenarios (Base / Bull / Bear - which variables flex):
- Base: organic traffic compounds at 25% YoY; self-serve PQL→paid at 8%; enterprise adds 5–10 logos/yr from Year 2; NRR 115%.
- Bull: paid SEM accelerates sign-up volume 2×; enterprise ramp faster (20 logos/yr by Year 2); NRR 125%; revenue share adds 5% of total revenue.
- Bear: organic traffic flattens (10% YoY); PQL→paid conversion drops to 5%; enterprise sales ramp delayed 12 months; NRR 105%.
- Required sheets / outputs:
- Assumptions - all drivers in one place with Base/Bull/Bear toggles.
- Funnel Model - weekly sign-ups → PQLs → paid customers (self-serve vs. enterprise split).
- ARR Bridge - new ARR, expansion ARR, churned ARR, net new ARR per period.
- Revenue Schedule - subscription MRR/ARR + revenue share line.
- P&L (Income Statement) - revenue, COGS (hosting/infra), gross profit, S&M, R&D, G&A, EBITDA.
- Headcount Plan - engineering, sales, marketing, G&A.
- Cash Flow & Runway - operating cash burn, raise proceeds, months of runway.
- KPI Dashboard - ARR, MRR, logo count, NRR, CAC, LTV, LTV/CAC, payback period.
Frequently asked
Is the Thunkable financial model free?+
Yes. The Thunkable model is a free Excel (.xlsx) download with live formulas. Sign up with your email and the workbook is yours to keep, review, and edit.
What's included in the model?+
A 5-year monthly forecast with P&L, cash flow and runway, valuation (exit multiple plus a DCF cross-check), MOIC/IRR returns, and unit economics, with live formulas throughout.
How was this model built?+
It was built from Thunkable's pitch deck and publicly available information, then structured to investment-banking standards as a fully editable Excel model.
Can I change the assumptions?+
Yes. You can change assumptions and the live formulas will recalculate in the downloadable Excel model.
Have more financial modelling questions? Contact us

Created by ex-finance professionals
Hey, I’m Alex and I created Finamodel.
Over my years in the finance industry I kept building the same models over and over again. Same structure, same assumptions, different logo. So I started building frameworks to turn them into clean, reusable templates.
Every model here is one I’d actually use for a client, and I personally vet each one before it goes up.
I’m not an expert in every industry, but I’ve built enough models to know what belongs in one. And when something is completely foreign to me, I reach out to my network for experts to work on our models with us.
Having a template library on hand cuts a first build from hours to minutes.
Need help finding your model? You’ll find me in the Finamodel app!
Other Dev Tools Startup Financial Models
Browse another startup in the same category.

8base
Low-code/no-code platform providing backend and frontend development tools for building digital products, internal apps, and SaaS.
Ably
Enterprise realtime messaging infrastructure (pub/sub) delivered as a cloud-native platform, enabling developers to build scalable live experiences without managing complex realtime infrastructure.

Amplitude
Mobile analytics SaaS platform giving app developers real-time behavioral analytics, funnel/retention analysis, and raw data warehouse access at scale.
Anima
Automated design-to-code platform - designers export production-ready code from their design tools with one click.

Apollo
Apollo builds and sells an enterprise "data graph" platform (powered by GraphQL) that sits as a unified API layer between frontend apps and backend microservices.
BrowserStack
Cloud-based cross-browser and mobile app testing platform used by 50,000+ customers across 135 countries.
CodeSandbox
Cloud-native collaborative web IDE that lets entire product teams (not just developers) code, review, and iterate together in the browser.
CommandBar
SaaS SDK that embeds a search-based command bar into web apps, improving UX, onboarding, and retention for B2B software companies.


