 Ascend Financial Model
Enterprise/Security Startup Financials (Free Excel Download)
Ascend.io is an enterprise big data automation platform ("Enterprise Intelligence Platform") that abstracts away the complexity of big data engineering so non-experts can build and run data pipelines.



professionals from Deloitte
Used by professionals from






About this model
Ascend.io provides a declarative data graph that lets teams build and run big-data pipelines without managing the underlying distributed infrastructure. Its automation engine handles orchestration, data changes, scheduling, recovery, and storage decisions on top of existing data systems.
The platform targets enterprises that want SQL and data-modelling users to own data workflows without requiring Scala or Java Spark expertise. Its proposed value is faster project delivery and a non-disruptive layer over an existing Hadoop, Spark, or cloud environment.
The model is an enterprise SaaS ARR build, starting with long sales cycles and contract values appropriate for Fortune 2000 buyers. It connects new-logo ramp, expansion, retention, and cloud delivery costs to revenue and gross profit, then tests hiring and cash requirements across base, upside, and downside cases.
A turnkey financial model
Live formulas, no hardcoded values
Outputs are driven by live formulas, so the workbook updates from its assumptions instead of relying on hardcoded results.
All assumptions in one tab
Inputs are clearly marked in the Assumptions tab and separated from calculations, making it clear what to change and what to leave intact.
Statements always balancing
For integrated-statement models, the balance sheet, cash flow, and supporting schedules tie through properly.
Distinct schedules for clarity
Debt, working capital, taxes, and cash flow can get messy quickly. We group calculations in clear schedules, not across disconnected tabs.
No hidden macros or external links
There are no unexplained external workbook links or macros to undermine auditability or portability.
Changes flow through the model
Update a key driver and see the impact carry through the forecast, financing, and return outputs. We never use hardcoded numbers in formulas.
About Ascend
ascend.io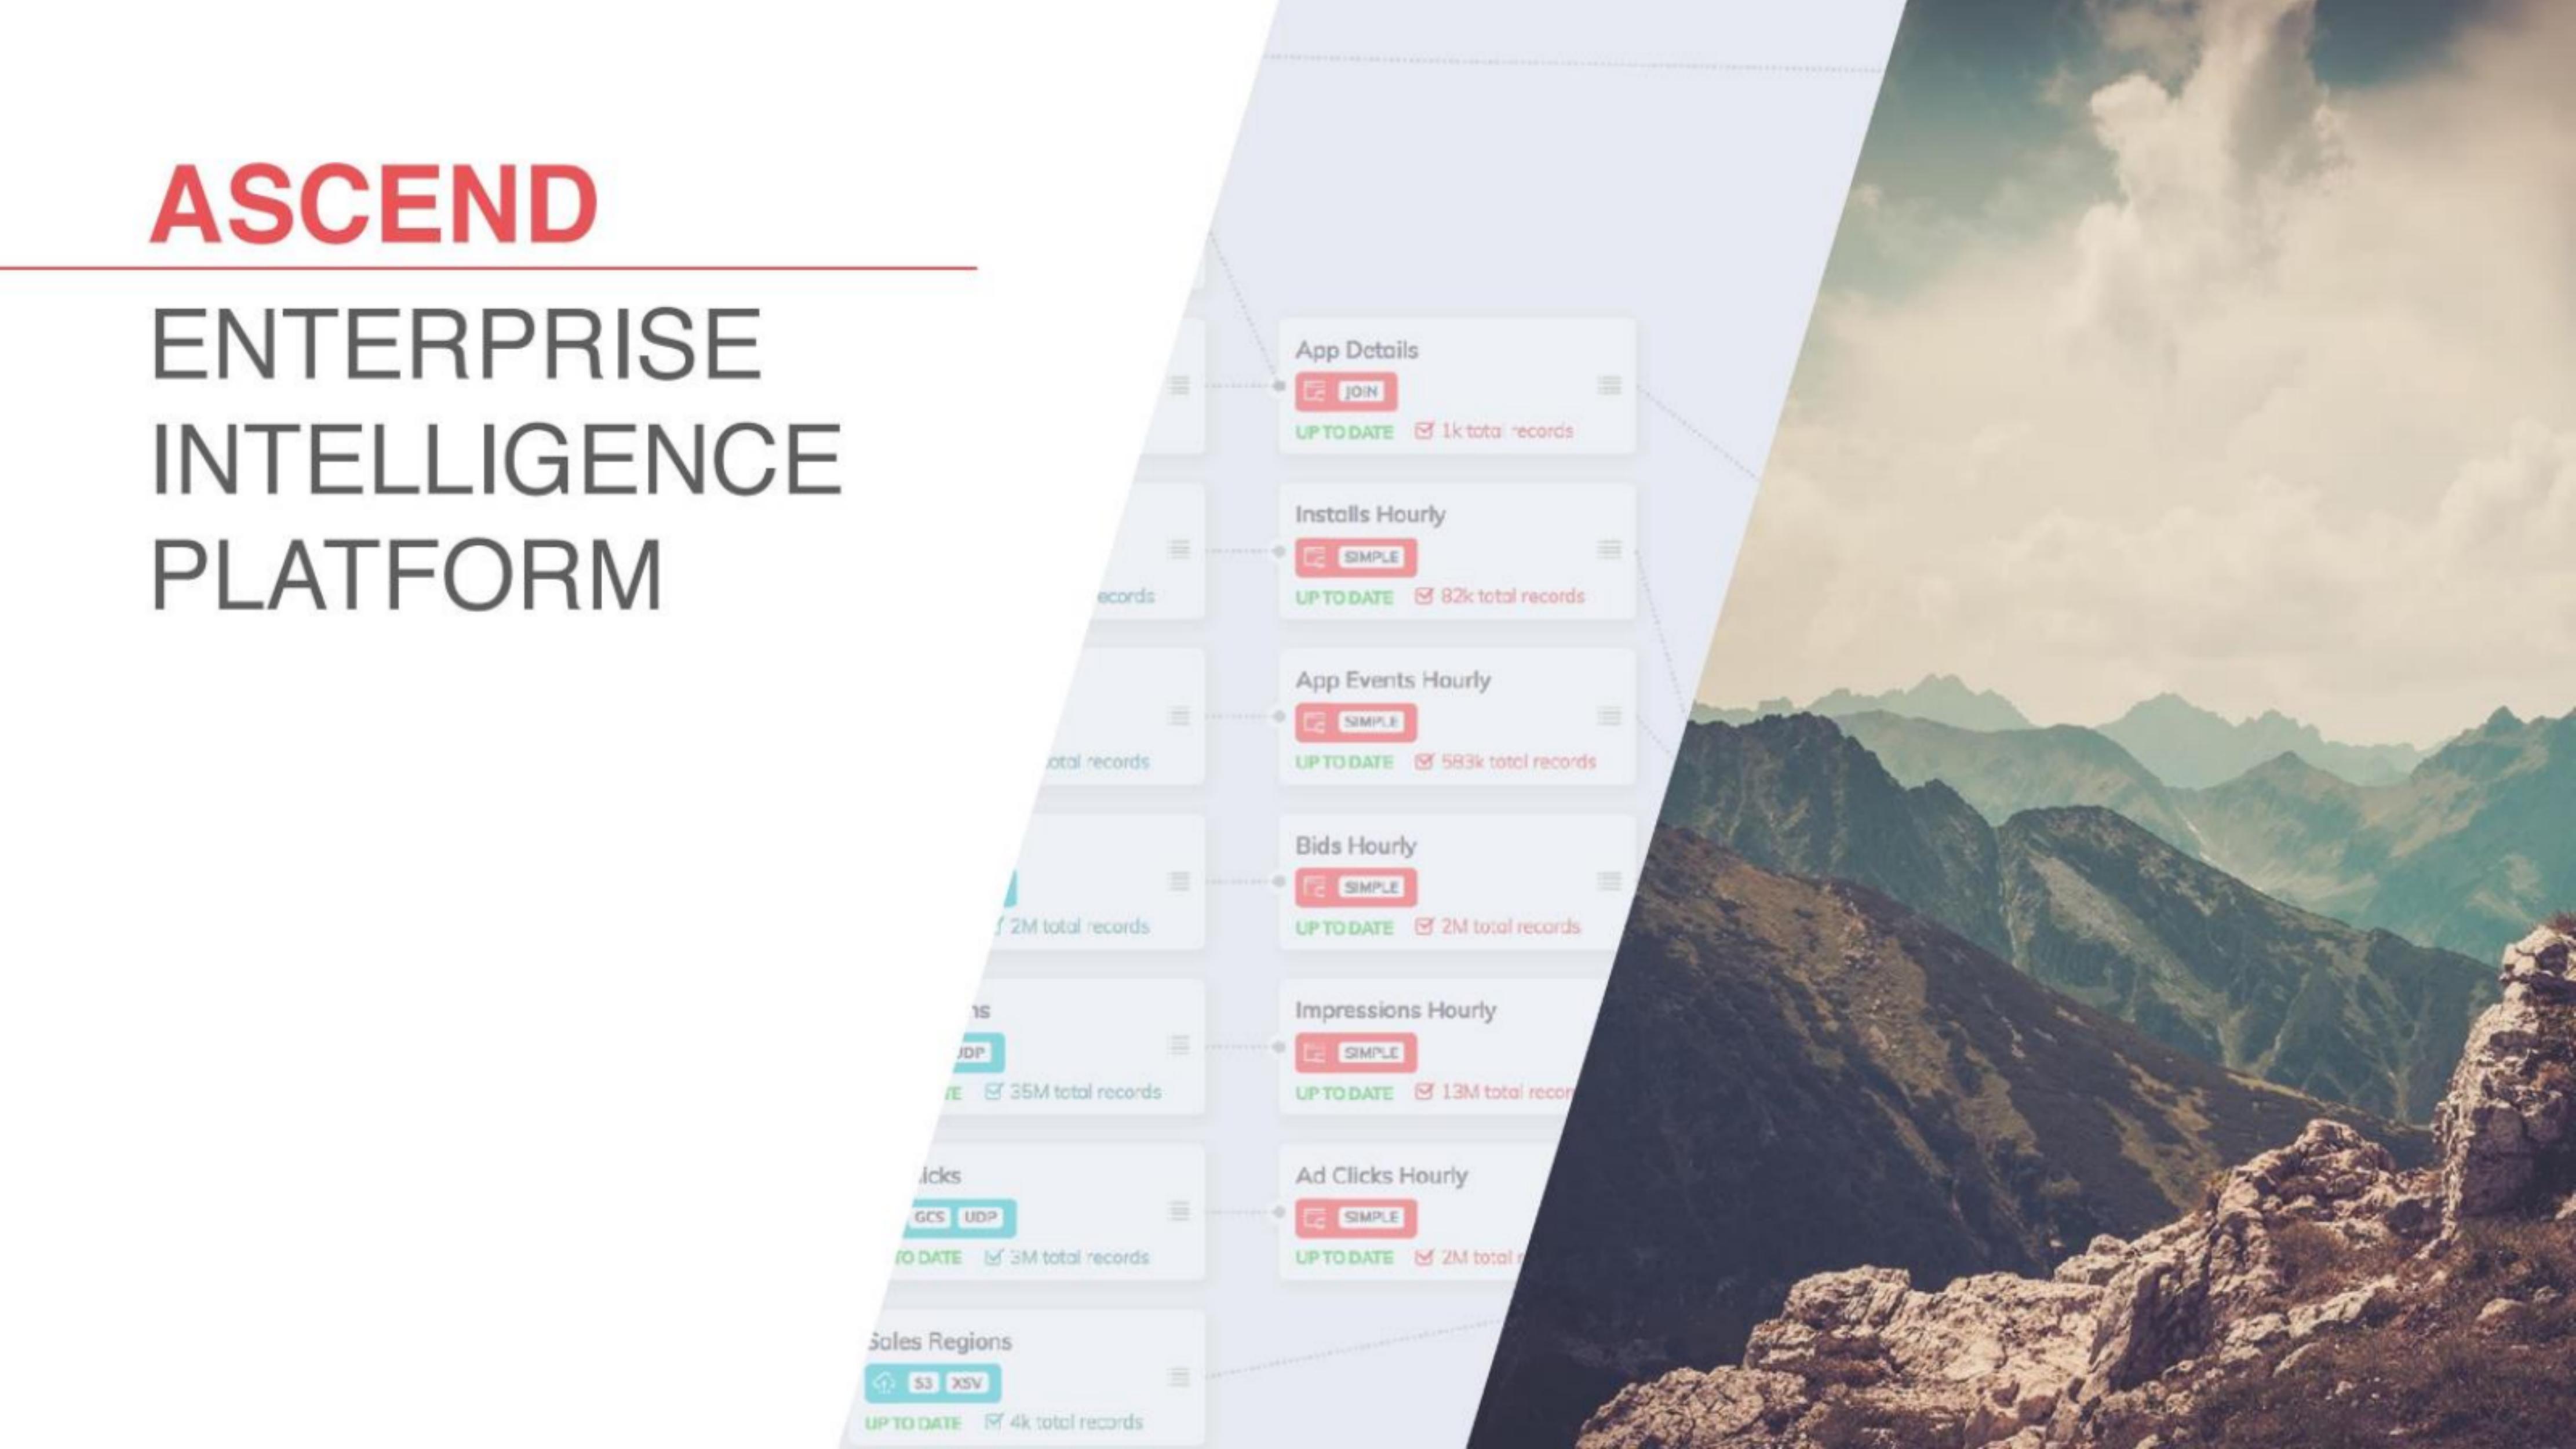
How to build a detailed financial model for Ascend
A complete walkthrough of the business, drivers, and assumptions behind the downloadable Ascend model - distilled from its pitch deck and publicly available information.
Product & value proposition
Ascend provides a Declarative Data Graph - a higher-level abstraction layer on top of existing big data infrastructure (Spark, Hadoop, cloud storage, etc.). Users define business logic ("what") via a data modeling interface; Ascend's Automation Engine translates that into underlying tasks, monitors for data changes, schedules and recovers jobs, manages storage formats, and orchestrates distributed workers - all without requiring users to write Scala/Java Spark code.
Key claims:
- "Reduce project times by up to 90%"
- "Design once, run forever" (automated big data operations)
- Non-disruptive - layers on top of existing big data systems
- Enables SQL/data-modeling-skill users (not Scala engineers) to own pipelines
Market
- No explicit TAM/SAM/SOM figures stated in deck.
- Market framing: "The Big Data Opportunity" illustrated by a grid of 28 big-data-adjacent companies that have collectively raised hundreds of millions (e.g., Lookout $275.5M, Hortonworks $150M, Cloudera $141M, SumoLogic $140M). No aggregate TAM dollar figure given.
- Gartner (Sep 2015) cited: "As more organizations invest in big data, the shortage of available skills and capabilities will become more acute."
- Positioning on technology-diffusion S-curve: "You Are Here" - currently in the Expert-adopter phase, heading toward mainstream.
- Target company profile: Fortune 2000, cloud-friendly, existing data investments; sectors: Media, Consumer, Retail, Finance, IoT.
Competition / moat
Competitive landscape framed in four categories:
- BI & Other Tools (Domo, Tableau): Partners, sit downstream from Ascend.
- Big Data Orchestration Tools (Cask, StreamSets): Competitors, but limited by imperative ("how") vs. declarative ("what") design - Ascend's differentiator.
- Open Source Big Data Ecosystem (Cloudera, Qubole, Databricks): Infrastructure partners/dependencies, not direct competitors.
- Cloud (Amazon, Microsoft, Google): Partner potential; risk of product expansion toward Ascend's space.
Moat claims: Declarative paradigm, automation engine capturing institutional knowledge ("canonical knowledge for entire org"), non-disruptive integration with existing investments.
Team & funding ask / use of funds
Team:
- Sean Knapp, CEO - Co-founder/CTO/CPO at Ooyala (2007–2015); led 200-person R&D org; $60M+ revenue growth; architected 4 generations of big data platforms; orchestrated Ooyala's $410M acquisition by Telstra; Google Web Search Frontend Lead (2004–2007); BS/MS CS Stanford.
- Steven Parkes, Head of Technology - Staff Engineer at Twitter; big data systems since 2001 at IBM Research; PhD EE UIUC; BS/MS EE UC Davis.
- Dan Gordon, Head of Product & Strategy - VP Product Management at Guidewire (2003–2015); led 37-person product org during $2M–$350M revenue growth; BA Political Science Yale; MBA Stanford.
Recommended financial model
- Archetype + why: Enterprise SaaS ARR model. Ascend sells a platform to Fortune 2000 enterprises on what will be annual contracts; revenue scales via logo additions and expansion within accounts. No transactional or usage-based pricing is disclosed, so ARR-based SaaS is the appropriate starting archetype.
- Forecast horizon & granularity: 5 years (Year 1–5), quarterly for Years 1–2, annual for Years 3–5. Pre-revenue stage deck warrants a Year 0 / build-out quarter.
- Key drivers & assumptions:
- New enterprise logos per quarter: 1–2 in Y1, ramping to 5–8/quarter by Y3; rationale: Fortune 2000 sales cycles are long (6–12 months), early-stage team.
- Average Contract Value (ACV): $150K–$300K/year for mid-market Fortune 2000; rationale: comparable enterprise data platforms (Trifacta, Alation) at similar stage.
- Net Revenue Retention (NRR): 115–125%; rationale: platform that embeds into data workflows has high stickiness and natural upsell as data volumes grow.
- Gross margin: 70–75%; rationale: SaaS platform with cloud infrastructure costs; big-data workloads have meaningful COGS (compute) but no per-seat COGS.
- Sales headcount and ramp: 2 AEs in Y1, doubling by Y2; 6-month ramp to full quota.
- Quota per AE: $600K–$800K ARR; rationale: enterprise software benchmark.
- S&M as % of revenue: 50–60% in early years, declining to 35–40% at scale.
- R&D as % of revenue: 35–45% early, declining to 20–25% at scale.
- G&A: 15% early, normalizing to 8–10%.
- Churn (gross logo churn): 5–8% annually; rationale: enterprise with embedded workflows.
- Scenarios (Base / Bull / Bear - which variables flex):
- Base: 2 logos/quarter Y1, ACV $200K, NRR 115%, gross margin 72%.
- Bull: 4 logos/quarter by Y2, ACV $300K, NRR 125%, faster sales hiring.
- Bear: 1 logo/quarter Y1 (slow Fortune 2000 penetration), ACV $150K, NRR 105%, higher churn.
- Primary flex variables: new logo pace (sales cycle length), ACV (contract size), NRR, gross margin (infrastructure cost as data volumes scale).
- Required sheets / outputs:
- Assumptions dashboard (all drivers, clearly tagged)
- ARR bridge (beginning ARR → new → expansion → churn → ending ARR)
- Revenue & gross profit (by quarter/year)
- Headcount & opex build (Sales, R&D, G&A separately)
- P&L summary (Revenue → EBIT → net income)
- Cash / runway (implied burn and months of runway)
- SaaS KPI summary (ARR, MRR, logo count, ACV, NRR, LTV/CAC once data available)
Frequently asked
Is the Ascend financial model free?+
Yes. The Ascend model is a free Excel (.xlsx) download with live formulas. Sign up with your email and the workbook is yours to keep, review, and edit.
What's included in the model?+
A 5-year monthly forecast with P&L, cash flow and runway, valuation (exit multiple plus a DCF cross-check), MOIC/IRR returns, and unit economics, with live formulas throughout.
How was this model built?+
It was built from Ascend's pitch deck and publicly available information, then structured to investment-banking standards as a fully editable Excel model.
Can I change the assumptions?+
Yes. You can change assumptions and the live formulas will recalculate in the downloadable Excel model.
Have more financial modelling questions? Contact us

Created by ex-finance professionals
Hey, I’m Alex and I created Finamodel.
Over my years in the finance industry I kept building the same models over and over again. Same structure, same assumptions, different logo. So I started building frameworks to turn them into clean, reusable templates.
Every model here is one I’d actually use for a client, and I personally vet each one before it goes up.
I’m not an expert in every industry, but I’ve built enough models to know what belongs in one. And when something is completely foreign to me, I reach out to my network for experts to work on our models with us.
Having a template library on hand cuts a first build from hours to minutes.
Need help finding your model? You’ll find me in the Finamodel app!
Other Enterprise/Security Startup Financial Models
Browse another startup in the same category.
AgBiome
AgBiome is a microbial-platform agtech company that discovers, develops, and commercialises biological crop protection products (and licences the platform across adjacent markets).

Alation
Enterprise data intelligence platform - data catalog, governance, and metadata management for large organisations.

Archer SPAC
Archera
Cloud resource automation platform that continuously optimizes AWS commitment purchases, de-risks overcommitment, and automates FinOps workflows.

Ardoq
Cloud-native Enterprise Architecture (EA) SaaS platform that helps large enterprises navigate digital transformation through automated data collection, graph-based architecture modelling, and change impact analysis.

Athennian
Cloud-based legal entity management system (EMS) uniting entity data with workflow and document automation.

Auditboard
Cloud-based integrated risk management platform connecting audit, risk, compliance, and ESG teams across the enterprise.

BoostUp
AI-powered contextual revenue intelligence platform that automatically extracts unstructured digital sales data to replace manual CRM entry and power forecasting


