BOBower Financial Model
Climate/Energy Startup Financials (Free Excel Download)
Mobile app that rewards consumers for scanning and recycling consumer packaging at existing bins, monetised by CPG brand subscriptions and consumer data.



professionals from Deloitte
Used by professionals from






About this model
Bower is a consumer app that rewards people for scanning packaging and verifying recycling at existing bins. Its geolocation technology, barcode data, and rewards connect consumers with CPG brands without requiring new physical collection infrastructure.
Brands subscribe for recycling data, consumer engagement, and co-branded packaging, while Bower can also monetise insights and rewards partnerships. The business reported a €1 million annualised run rate in 2021, more than one million scanned packs per month, and roughly 25 connected brands.
The model should build ARR from connected brands, annual revenue per brand, and data-product uplift. Consumer cohorts matter as a leading indicator: users, scans per user, verified recycling, reward cost, and organic acquisition determine the data value that supports brand retention and new-logo growth.
A turnkey financial model
Live formulas, no hardcoded values
Outputs are driven by live formulas, so the workbook updates from its assumptions instead of relying on hardcoded results.
All assumptions in one tab
Inputs are clearly marked in the Assumptions tab and separated from calculations, making it clear what to change and what to leave intact.
Statements always balancing
For integrated-statement models, the balance sheet, cash flow, and supporting schedules tie through properly.
Distinct schedules for clarity
Debt, working capital, taxes, and cash flow can get messy quickly. We group calculations in clear schedules, not across disconnected tabs.
No hidden macros or external links
There are no unexplained external workbook links or macros to undermine auditability or portability.
Changes flow through the model
Update a key driver and see the impact carry through the forecast, financing, and return outputs. We never use hardcoded numbers in formulas.
About Bower
getbower.com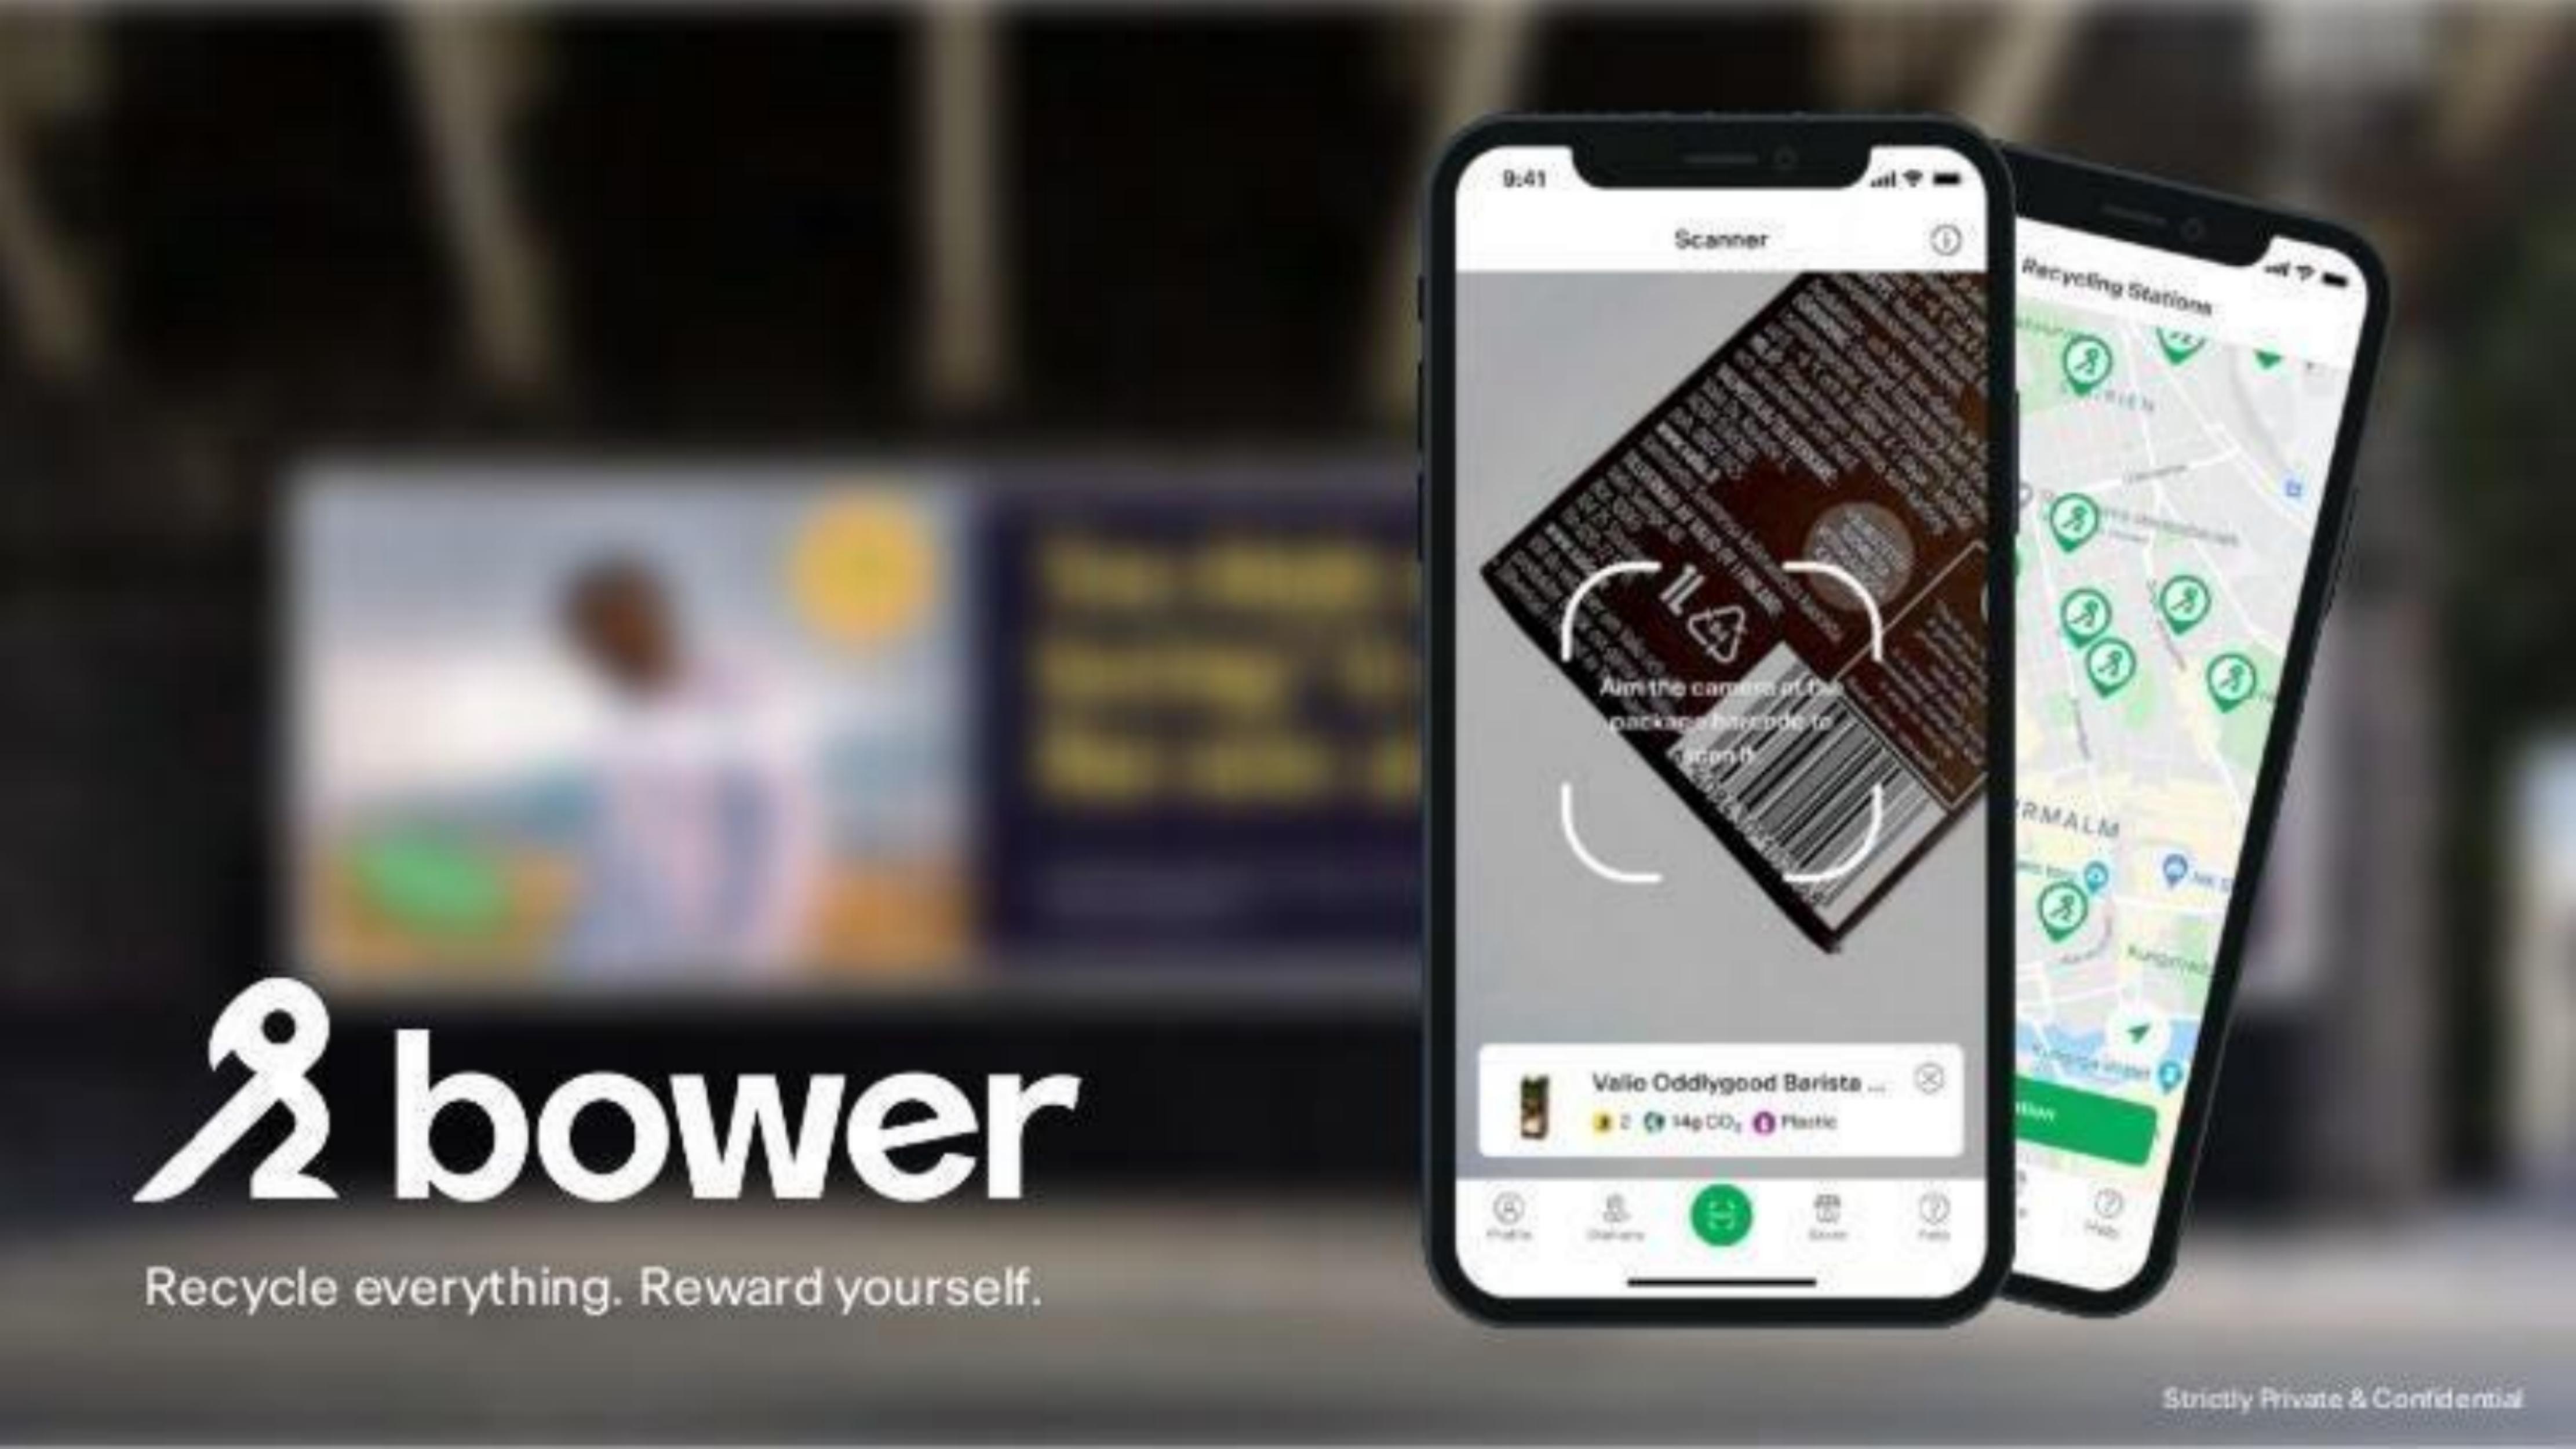
How to build a detailed financial model for Bower
A complete walkthrough of the business, drivers, and assumptions behind the downloadable Bower model - distilled from its pitch deck and publicly available information.
Product & value proposition
- Consumer-facing mobile app (iOS + Android): users scan any barcoded consumer packaging at home, then verify at a nearby GPS-validated recycling station to earn reward points.
- Points redeemable for discounts, cash, or charity donations.
- Patented geolocation technology ensures deposit value is only unlocked when user is physically near a recycling bin.
- For CPG brands: connected brands gain a recycling data layer on their products (scan volume, recycling rate, CO₂ saved), direct consumer engagement channel, and the ability to co-brand packaging with the Bower logo.
- Key differentiator vs. reverse vending machines: works at existing bins, covers all barcoded packaging (not just PET/cans), globally scalable with no physical infrastructure required.
- Certified B Corporation; member of Ellen MacArthur Foundation network.
Market
- TAM: €325bn globally. No SAM or SOM breakdown provided.
- Growth rate of market: "growing" stated but no CAGR figure given.
- Market composition not specified (deck does not decompose the €325bn by geography, sub-segment, or source).
Revenue model
- Primary - B2B brand subscriptions: CPG brands pay a per-product/per-brand annual subscription fee. Unit economics stated as "€9 per connected brand and year". Brands listed include Nestlé, Unilever, Coca-Cola, Mondelez, Orkla, P&G, Coop, Nespresso, Apoteket, and ~20 others.
- Secondary - Consumer data / insights: Scanned-package database sold as consumer insights to brand owners. Not separately priced in deck.
- Tertiary - Rewards marketplace: Implied by the rewards/points system (discounts, deals). Revenue mechanism (affiliate, take rate) not specified.
- Annualised run rate: €1m in 2021.
- No subscription tiers, tiered pricing, or per-scan fee structure disclosed beyond the "€9/brand/year" unit.
Traction & metrics
- €1m annualised revenue run rate in 2021
- 1m+ scanned & recycled packs per month, 30% MoM growth
- 10,000 new users/day (peak - during viral TikTok spread in February 2021)
- 200,000 scans/day (peak - same period)
- App Store rating: 4.5
- #1 most downloaded app on App Store in Sweden (during TikTok viral period)
- €0 paid user acquisition
- 16 million packs recycled cumulatively
- >20% plastic waste recycled (in participating areas/context)
- Connected brands: ~25+ global and local CPG brands shown
- Funding history: €100k self-financed (2015), €600k family (2017), €1m external (2020)
- Note: 10k users/day and 200k scans/day are explicitly footnoted as "for two days in February 2021 during the viral TikTok spread" - not steady-state.
Unit economics
- Unit economics per connected brand: €9 per brand per year
- CAC: €0 for consumers (organic/viral); brand CAC not stated
- "Profitable unit economics" claimed but no P&L, contribution margin, or EBITDA figures shown
Competition / moat
- Direct competitors not named in deck.
- Moat claims:
- Patented geolocation technology (specific patent not cited)
- Network effect: brands co-brand packaging → free consumer acquisition → more scan data → attracts more brands
- Certified B Corp + Ellen MacArthur Foundation association (credibility/trust moat)
- First-mover in "all-packaging" digital deposit systems (vs. reverse vending machines which only handle PET/cans)
- Acknowledged competitive dynamic: a key Swedish retailer replicated the PantaPåsen bag concept themselves, forcing the 2018 pivot - highlights IP replication risk.
Team & funding ask / use of funds
- Founder/CEO: Suwar Mert (suwar@getbower.com; +46 70-715 76 52)
- Founding story: Suwar quit employment in 2015 with conviction around plastic bag deposit system
- Funding ask: Amount not stated
- Prior funding: €100k (self) + €600k (family) + €1m (external) = ~€1.7m cumulative
Recommended financial model
- Archetype + why: B2B SaaS ARR model with a consumer volume overlay. Revenue is driven by CPG brand count × annual subscription fee per brand, supplemented by a data/insights monetisation layer. The consumer side (users, scans, packs recycled) drives the value proposition to brands and acts as the leading indicator for brand additions - so a two-sided flywheel model is appropriate. Not a 3-statement model at this stage; a driver-based ARR + consumer cohort model is more useful.
- Forecast horizon & granularity: 3 years monthly (Year 1–2) transitioning to annual (Year 3). Monthly granularity needed to capture the MoM scan growth and brand onboarding cadence.
- Key drivers & assumptions:
*Brand/Revenue side:*
- Starting brand count: ~25
- Brand count growth rate: 4–6 net new brands/month in base case, reflecting early-stage sales with a lean team; sensitivity to be applied
- Revenue per brand per year: €9
- Data/insights revenue: modelled as a % uplift on subscription ARR (10–20%), given no separate pricing disclosed
- Rewards marketplace revenue: excluded from base model until pricing is disclosed; flagged as upside
*Consumer/Volume side (leading indicators for brand value):*
- Monthly active users (MAU): starting base of ~50k–100k (steady-state post-viral spike; actual MAU not in deck - major gap); growing at 10–15% MoM base case (well below the peak 10k/day but sustainable organic)
- Scans per user per month: ~8–12 (implied by 1m+ packs/month ÷ estimated MAU)
- Monthly scan volume: 1m+, 30% MoM growth - use as anchor for near-term forecast
- Recycling rate (scans → verified recycling events): 60–70%, reflecting geolocation friction
*Cost side:*
- COGS: primarily cloud infrastructure and third-party barcode/geolocation APIs; estimated at 15–25% of revenue
- S&M: low on consumer side (organic); brand sales team cost to be driven by headcount additions
- R&D: ~30–40% of revenue given early-stage product team; no headcount breakdown in deck
- G&A: ~10–15% of revenue
- Scenarios (Base / Bull / Bear - which variables flex):
- Base: 4–6 new brands/month, 15% MoM MAU growth, €9 ASP unchanged, data revenue at 10% uplift
- Bull: Paid marketing added post-fundraise (slide 13 hints at this), accelerating MAU growth to 30%+ MoM; brand count growth doubles; ASP moves to €12–15 as data value proven
- Bear: Viral growth normalises to near-zero organic, brand churn increases, no paid marketing; flat brand additions (1–2/month); scan growth stalls
- Required sheets / outputs:
- Assumptions - all drivers with / tags
- Consumer Funnel - MAU, DAU, scans/day, scans/month, recycling events
- Brand ARR - brand count waterfall (new, churned, net), ARR by stream (subscription + data)
- P&L - Revenue, COGS, gross profit, OpEx (S&M, R&D, G&A), EBITDA
- Cash & Runway - given early stage and implied fundraise, a simplified cash burn / runway model
- Scenario toggle - Base / Bull / Bear selector driving assumptions sheet
- KPI Summary - MRR, ARR, brands connected, scans/month, MAU, gross margin %, burn rate
Frequently asked
Is the Bower financial model free?+
Yes. The Bower model is a free Excel (.xlsx) download with live formulas. Sign up with your email and the workbook is yours to keep, review, and edit.
What's included in the model?+
A 5-year monthly forecast with P&L, cash flow and runway, valuation (exit multiple plus a DCF cross-check), MOIC/IRR returns, and unit economics, with live formulas throughout.
How was this model built?+
It was built from Bower's pitch deck and publicly available information, then structured to investment-banking standards as a fully editable Excel model.
Can I change the assumptions?+
Yes. You can change assumptions and the live formulas will recalculate in the downloadable Excel model.
Have more financial modelling questions? Contact us

Created by ex-finance professionals
Hey, I’m Alex and I created Finamodel.
Over my years in the finance industry I kept building the same models over and over again. Same structure, same assumptions, different logo. So I started building frameworks to turn them into clean, reusable templates.
Every model here is one I’d actually use for a client, and I personally vet each one before it goes up.
I’m not an expert in every industry, but I’ve built enough models to know what belongs in one. And when something is completely foreign to me, I reach out to my network for experts to work on our models with us.
Having a template library on hand cuts a first build from hours to minutes.
Need help finding your model? You’ll find me in the Finamodel app!
Other Climate/Energy Startup Financial Models
Browse another startup in the same category.

Abatable
Robo-advisor platform for sourcing and managing high-quality carbon removal offsets, targeting asset managers.
Bramble Energy
UK deep-tech company commercialising a PCB-based hydrogen fuel cell stack (PCBFC™) for portable power and mobility applications.

Cervest
AI-powered Climate Intelligence platform that quantifies physical climate risk at the asset level, delivered as a freemium SaaS product.

Clockworks Analytics
B2B SaaS platform providing automated fault-detection and diagnostics (FDD) analytics for commercial and institutional building portfolios.

Dandelion Energy
Dandelion Energy installs residential geothermal heat pump systems (ground-source HVAC) with in-house financing, targeting US homeowners on fossil-fuel heating.

Emitwise
B2B SaaS platform automating corporate carbon footprint tracking, reporting, and reduction using machine learning.
Fisker
Fisker is an asset-light, design-led EV company merging with Spartan Energy Acquisition Corp. in a SPAC transaction to fund the launch of the Fisker Ocean SUV.
Good Loop
Purpose-driven adtech platform that donates a share of ad spend to charities in exchange for user attention, while offering brands impact reporting and carbon-offset tools.


