FIFisker Financial Model
Climate/Energy Startup Financials (Free Excel Download)
Fisker is an asset-light, design-led EV company merging with Spartan Energy Acquisition Corp. in a SPAC transaction to fund the launch of the Fisker Ocean SUV.



professionals from Deloitte
Used by professionals from






About this model
Fisker planned the Ocean, a premium but comparatively affordable electric SUV, sold directly through its Flexee app, experience centres, and a flexible lease. The product range ran from the Base at $37,499 to the Extreme at $69,900, with contract manufacturing intended to keep the OEM asset-light.
At the 2020 SPAC presentation, Fisker was pre-production but had more than 25,000 soft reservations and 5,500 deposited orders. Its market case rests on EV adoption and SUV demand, while future monetisation could include leasing, upgrades, insurance, and other vehicle services.
The model should begin with SPAC sources and uses and pre-production development burn, then forecast vehicles and blended ASP by trim. Build BOM, assembly, logistics, warranty, and gross margin per trim, plus lease cash flows and working capital; production ramp, mix, and launch timing drive the path to EBITDA and free cash flow.
A turnkey financial model
Live formulas, no hardcoded values
Outputs are driven by live formulas, so the workbook updates from its assumptions instead of relying on hardcoded results.
All assumptions in one tab
Inputs are clearly marked in the Assumptions tab and separated from calculations, making it clear what to change and what to leave intact.
Statements always balancing
For integrated-statement models, the balance sheet, cash flow, and supporting schedules tie through properly.
Distinct schedules for clarity
Debt, working capital, taxes, and cash flow can get messy quickly. We group calculations in clear schedules, not across disconnected tabs.
No hidden macros or external links
There are no unexplained external workbook links or macros to undermine auditability or portability.
Changes flow through the model
Update a key driver and see the impact carry through the forecast, financing, and return outputs. We never use hardcoded numbers in formulas.
About Fisker
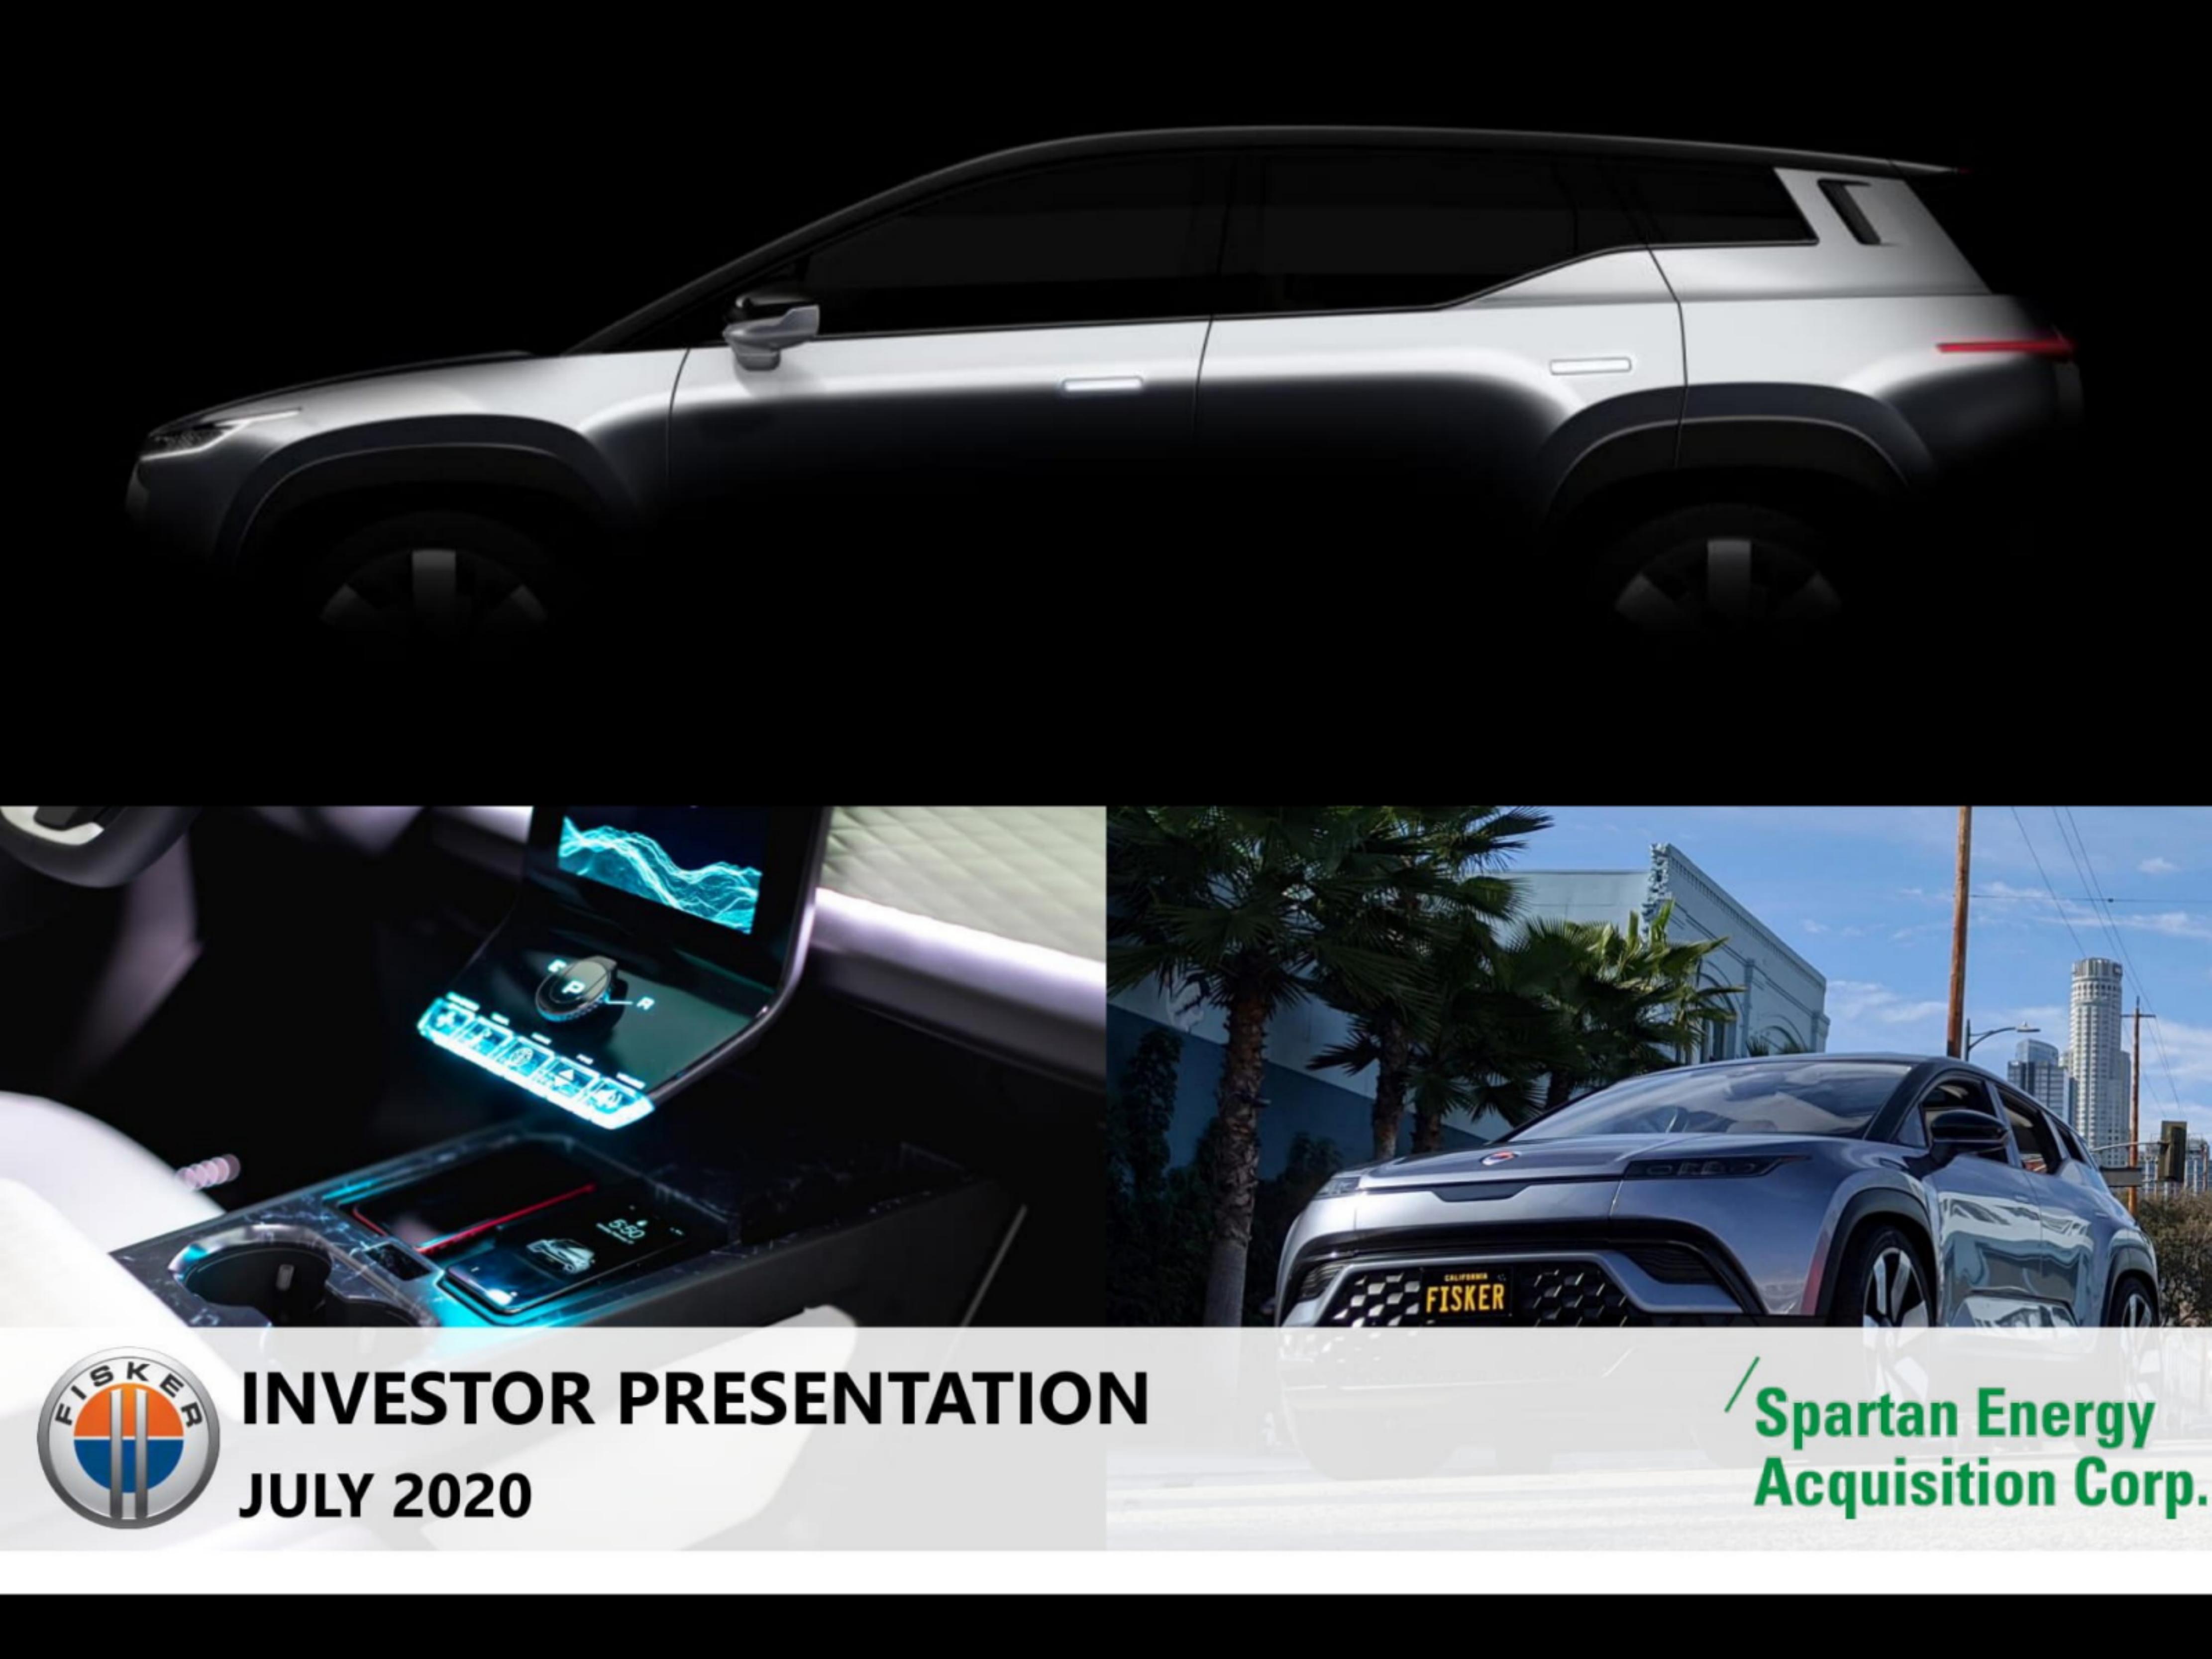
How to build a detailed financial model for Fisker
A complete walkthrough of the business, drivers, and assumptions behind the downloadable Fisker model - distilled from its pitch deck and publicly available information.
Product & value proposition
- Hero product: Fisker Ocean - premium affordable all-electric SUV. Starting at $37,499 / $379/mo flexible lease. Anticipated Q4 2022 SOP.
- Four trim packages: Base ($37,499), Sport ($47,999), Power Sport ($59,000), Extreme ($69,900).
- Flexible "Flexee" lease: $379/mo, $2,999 drive-off, no fixed term, cancel anytime, 30,000 miles/year, includes maintenance.
- Vehicle built on VW MEB platform (negotiations ongoing as of July 2020). Prototype built by VW's Italdesign.
- Direct-to-consumer via Flexee app and 10 planned US brand experience centers.
- Future pipeline: Platform 2 (TBD), Platform 3 (TBD), Luxury Sedan (EMotion) - 9-year product plan, 8 vehicles across 3 platforms.
Market
- Global EV fleet projected to grow at ~30% CAGR 2020–2030 (Bloomberg NEF, Electric Vehicle Outlook 2020).
- Chart shows projected global EV fleet rising from ~10M units (2020) to ~130M units (2030).
- US SUV sales mix rising vs. car sales mix declining - SUVs approaching ~50% of US auto sales by 2019.
- Fisker Ocean price range: $37k–$69k vs. comps Tesla Y ($40k–$75k), Volvo XC40 Electric (starting $50k), BMW i6 ($60k–$100k), Mercedes EQ ($70k–$90k), Jaguar I-PACE ($70k–$90k), Rivian R1S ($72k+).
Revenue model
- Vehicle sales: Direct-to-consumer, digital-first. ASP ranges by trim from ~$39k (Base) to ~$70k (Extreme) at 2023E.
- Flexible lease (Flexee): $379/mo subscription, $2,999 initiation, no fixed term. Revenue recognition method: Not in deck.
- Future revenue streams implied (not quantified): car sharing, ride hailing, insurance, fintech, OTA feature upgrades, trade-ins, e-commerce.
- Channels: Flexee app (primary), 10 US brand experience centers, pop-up stores.
- Manufacturing: contract (anticipated VW/Italdesign facility, European, up to 100k annual capacity).
Traction & metrics
- As of June 24, 2020:
- 25,000+ soft reservations from 118 countries (~$1.3B indicative revenue).
- 5,500+ hard orders with deposits from 32 countries (90% North America, ~$275M indicative revenue; $250 deposit, 10% refund fee = $25).
- Revenue as of presentation: $0 (pre-production, SOP anticipated Q4 2022).
- Cowen "Outperform" and Credit Suisse ratings cited on slides.
- CES 2020: Most Awarded New Automobile.
Unit economics
Base Package 2023E unit economics:
- Approximate Sales Price: $39,000
- Approximate Bill of Materials: ($29,000)
- Assembly, Shipping, Logistics, Warranty & Tariffs: ($8,000)
- Gross Profit: $2,000
2023E gross projected margins by trim:
- Base: 5.0%–7.5%
- Sport: 17.0%–21.0%
- Power Sport: 28.0%–32.5%
- Extreme: 29.0%–33.0%
- Profitability expected on first unit produced (due to economies of scale from OEM platform partnership).
- Cash flow positive projected in first full year of production (2023E).
Competition / moat
- Moat claims: asset-light model (no greenfield manufacturing), VW MEB platform access (negotiations), design heritage (Henrik Fisker - BMW Z8, Aston Martin DB9, Fisker Karma), 150+ trademarks & patents globally / 20+ countries.
- Direct price/feature comparison vs. Tesla Y, Volvo XC40 Electric, BMW i6, Mercedes EQ, Jaguar I-PACE, Rivian R1S.
- Valuation benchmarked vs. Nikola (SPAC) and Tesla (IPO).
- Competitive advantages asserted: lowest price in segment, flexible lease (unique), California Mode IP, sustainable materials, digital-first ownership, no dealer network.
Team & funding ask / use of funds
Team:
- Henrik Fisker - Chairman & CEO (designer BMW Z8, Aston Martin DB9, Fisker Karma)
- Stefan Krause - President & COO (ex-BMW CFO 2002–2007, ex-Deutsche Bank CFO 2008–2015, Co-Founder Canoo)
- Dr. Burkhard Huhnke - CTO (ex-VW SVP Product Innovation & E-Mobility)
- Dr. Geeta Gupta-Fisker - CFO (ex-Consensus Group, Lloyds Bank, PhD Cambridge)
- Spartan: Apollo Global Management (Geoff Strong Senior Partner, John MacWilliams Operating Partner, Joseph Romeo Principal)
Transaction / funding:
- PIPE: $500M committed common equity
- Spartan Trust: $569M (assumes no redemptions)
- Series C Investment: $50M
- Total gross proceeds to Fisker balance sheet: ~$1,040M cash
- Fees & expenses: $79M
- Pro forma equity value: $2,940M (294.0M shares at $10.00)
- Pro forma enterprise value: $1,900M ($2,940M equity – $1,040M cash, no debt)
- Existing Fisker shareholders: 59.5% (175M shares); SPAC investors 18.8%; PIPE 17.0%; Founders 4.7%
- Dual-class voting: co-founders 10:1
Development budget (pre-SOP, ~2.5 years):
- Year 1: $157M (Eng/R&D $49M, Capex $99M, Other $9M)
- Year 2: $533M (Eng/R&D $46M, Capex $314M, Other $16M)
- Year 3 (first 7 months to SOP): $770M cumulative (Eng/R&D $14M, Capex $112M, Other $14M, Working Capital $97M)
- Total pre-SOP budget: ~$770M
Use of funds: fund through SOP of Fisker Ocean Q4 2022. No further equity raise anticipated before SOP.
Recommended financial model
- Archetype + why: De-SPAC operating forecast model (EV OEM - asset-light / contract manufacturing).
- This is a de-SPAC transaction: Spartan + Fisker. The deck is structured as a SPAC investor presentation, not a VC pitch. The model must encompass (a) pro forma capitalization / sources & uses at close, (b) pre-SOP development budget burn, and (c) post-SOP operating P&L through 2025E following management projections. No accretion/dilution merger model needed (no target EPS base); SPAC economics dominate.
- Forecast horizon & granularity:
- Pre-SOP: annual by year (Year 1, 2, 3 = ~2020H2–2022Q3), capex/opex waterfall
- Post-SOP operating: annual 2022E–2025E (management projection period), matching the deck
- Monthly granularity: not warranted given pre-revenue stage and 5-year horizon; annual sufficient
- Key drivers & assumptions:
*Volume:*
- 2022E units produced: 8k (Ocean only)
- 2023E units produced: 51k (Ocean only)
- 2024E units produced: 175k (Ocean 150k, Lifestyle Pickup 25k)
- 2025E units produced: 225k (Ocean 160k, Lifestyle Pickup 45k, Sport Crossover 20k)
- EV fleet share: 0.2% (2023E), 0.6% (2024E–2025E)
*Revenue:*
- 2022E revenue: $0.6B
- 2023E revenue: $3.3B
- 2024E revenue: $10.6B
- 2025E revenue: $13.2B
- Revenue/unit 2023E: ~$64.7k blended ASP (=$3.3B / 51k units), implies mix skewed toward higher trims or lease revenue included - need to reconcile with Base $39k price; likely reflects mix assumption management has not disclosed
*Gross margin:*
- Base package gross margin 2023E: 5.0%–7.5%
- Sport 2023E: 17%–21%; Power Sport: 28%–32.5%; Extreme: 29%–33%
- Blended gross margin: ~13–18% for 2023E depending on trim mix; will need to be modelled as mix assumption
- BoM: ~$29k/unit (Base); Assembly/logistics/warranty: ~$8k/unit (Base)
*Adj. EBITDA:*
- 2022E: ~$0 (4% margin)
- 2023E: $0.441B (13% margin)
- 2024E: $2.007B (19% margin)
- 2025E: $2.760B (21% margin)
*Free cash flow* (defined as Adj. EBITDA less taxes, interest, NWC changes, capex, net lease financing):
- 2022E: ($0.3B)
- 2023E: $0.1B
- 2024E: $1.0B
- 2025E: $1.9B
*Capex / opex pre-SOP:*
- Year 1 capex: $99M; Y2 capex: $314M; Y3 (partial) capex: $112M
- Year 1 Eng/R&D: $49M; Y2: $46M; Y3: $14M
- Other (G&A, S&M, launch costs): Y1 $9M, Y2 $16M, Y3 $14M
- Working capital buffer (Y3): $97M
*SPAC / capitalization:*
- PIPE: $500M at $10/share = 50M shares
- SPAC trust: $569M = 55.2M shares
- Founders shares: 13.8M
- Existing Fisker: 175M shares
- Total shares: 294M; share price $10.00
- Warrants (out of the money, excluded): 27.6M at $11.50 strike
- Fees & expenses: $79M
*Tax rate:* 21% US federal + state blended ~25% once profitable; likely minimal in 2023E given NOL carryforwards from pre-SOP burn *Interest expense:* ~0 (no debt at close per deck) *Lease revenue accounting:* operating lease model; monthly payments recognized over term; no residual value disclosed in deck *Manufacturing cost:* variable per unit; fixed overhead covered by OEM partner; royalty/platform fee to VW not disclosed - key data gap
- Scenarios (Base / Bull / Bear - which variables flex):
- Base: Management projections as stated (2022 SOP, trim mix skewed toward mid/high trims, VW MEB agreement executed)
- Bull: Earlier ramp (Q3 2022 SOP), faster trim mix upgrade, lease attach rate >40%, additional platform licensing revenues, VW agreement finalized on favorable terms
- Bear: SOP delays to 2023 (most likely risk per disclaimers), hard-order conversion rate lower, gross margin at low end (Base trim dominates), VW agreement fails → need alternative manufacturer (cost and timing risk)
- Required sheets / outputs:
- Transaction Overview - Sources & uses, pro forma cap table, ownership waterfall (PIPE, SPAC, founders, Fisker shareholders), warrant dilution
- Development Budget - Pre-SOP annual capex/opex burn (Y1–Y3), cash runway vs. $1,040M proceeds
- Unit Economics - ASP by trim, BoM, assembly costs, gross profit/unit, gross margin % by trim and blended; trim mix sensitivity
- Revenue Build - Units by model × ASP blended (purchase vs. lease), total revenue 2022E–2025E
- P&L - Revenue, COGS, gross profit/margin, operating expenses (R&D, S&M, G&A), Adj. EBITDA/margin, D&A (assumed), EBIT, interest, taxes, net income
- Free Cash Flow Bridge - Adj. EBITDA → taxes → interest → NWC → capex → net lease financing → FCF
- Valuation - EV/Revenue and EV/EBITDA at implied $1,900M EV vs. comps (Tesla, Nikola) for 2023E–2025E
- Scenario / Sensitivity - SOP date, unit volume, trim mix, gross margin range
Frequently asked
Is the Fisker financial model free?+
Yes. The Fisker model is a free Excel (.xlsx) download with live formulas. Sign up with your email and the workbook is yours to keep, review, and edit.
What's included in the model?+
A 5-year monthly forecast with P&L, cash flow and runway, valuation (exit multiple plus a DCF cross-check), MOIC/IRR returns, and unit economics, with live formulas throughout.
How was this model built?+
It was built from Fisker's pitch deck and publicly available information, then structured to investment-banking standards as a fully editable Excel model.
Can I change the assumptions?+
Yes. You can change assumptions and the live formulas will recalculate in the downloadable Excel model.
Have more financial modelling questions? Contact us

Created by ex-finance professionals
Hey, I’m Alex and I created Finamodel.
Over my years in the finance industry I kept building the same models over and over again. Same structure, same assumptions, different logo. So I started building frameworks to turn them into clean, reusable templates.
Every model here is one I’d actually use for a client, and I personally vet each one before it goes up.
I’m not an expert in every industry, but I’ve built enough models to know what belongs in one. And when something is completely foreign to me, I reach out to my network for experts to work on our models with us.
Having a template library on hand cuts a first build from hours to minutes.
Need help finding your model? You’ll find me in the Finamodel app!
Other Climate/Energy Startup Financial Models
Browse another startup in the same category.

Abatable
Robo-advisor platform for sourcing and managing high-quality carbon removal offsets, targeting asset managers.
Bower
Mobile app that rewards consumers for scanning and recycling consumer packaging at existing bins, monetised by CPG brand subscriptions and consumer data.
Bramble Energy
UK deep-tech company commercialising a PCB-based hydrogen fuel cell stack (PCBFC™) for portable power and mobility applications.

Cervest
AI-powered Climate Intelligence platform that quantifies physical climate risk at the asset level, delivered as a freemium SaaS product.

Clockworks Analytics
B2B SaaS platform providing automated fault-detection and diagnostics (FDD) analytics for commercial and institutional building portfolios.

Dandelion Energy
Dandelion Energy installs residential geothermal heat pump systems (ground-source HVAC) with in-house financing, targeting US homeowners on fossil-fuel heating.

Emitwise
B2B SaaS platform automating corporate carbon footprint tracking, reporting, and reduction using machine learning.
Good Loop
Purpose-driven adtech platform that donates a share of ad spend to charities in exchange for user attention, while offering brands impact reporting and carbon-offset tools.


