DHDevoted Health Financial Model
InsurTech Startup Financials (Free Excel Download)
Medicare Advantage (MA) health plan targeting seniors, combining a proprietary tech stack, tech-enabled care coordination ("Devoted Health Guides"), and an owned medical group to drive superior margins versus incumbents.



professionals from Deloitte
Used by professionals from






About this model
Devoted Health is a Medicare Advantage plan for seniors, combining technology, care coordination, and an owned medical group. Its model aims to lower medical cost while improving service, quality ratings, and member retention.
Revenue comes primarily from CMS capitation payments based on county benchmarks, member risk scores, and STAR quality bonuses. The owned medical group provides a separate care-delivery revenue and margin component alongside the insurance plan.
The model is managed-care PMPM economics. Members, risk score, county rates, STAR bonus, medical-loss ratio, care costs, administration, and medical-group performance drive profit. Enrollment growth, clinical outcomes, and quality ratings are the critical variables.
A turnkey financial model
Live formulas, no hardcoded values
Outputs are driven by live formulas, so the workbook updates from its assumptions instead of relying on hardcoded results.
All assumptions in one tab
Inputs are clearly marked in the Assumptions tab and separated from calculations, making it clear what to change and what to leave intact.
Statements always balancing
For integrated-statement models, the balance sheet, cash flow, and supporting schedules tie through properly.
Distinct schedules for clarity
Debt, working capital, taxes, and cash flow can get messy quickly. We group calculations in clear schedules, not across disconnected tabs.
No hidden macros or external links
There are no unexplained external workbook links or macros to undermine auditability or portability.
Changes flow through the model
Update a key driver and see the impact carry through the forecast, financing, and return outputs. We never use hardcoded numbers in formulas.
About Devoted Health
devoted.com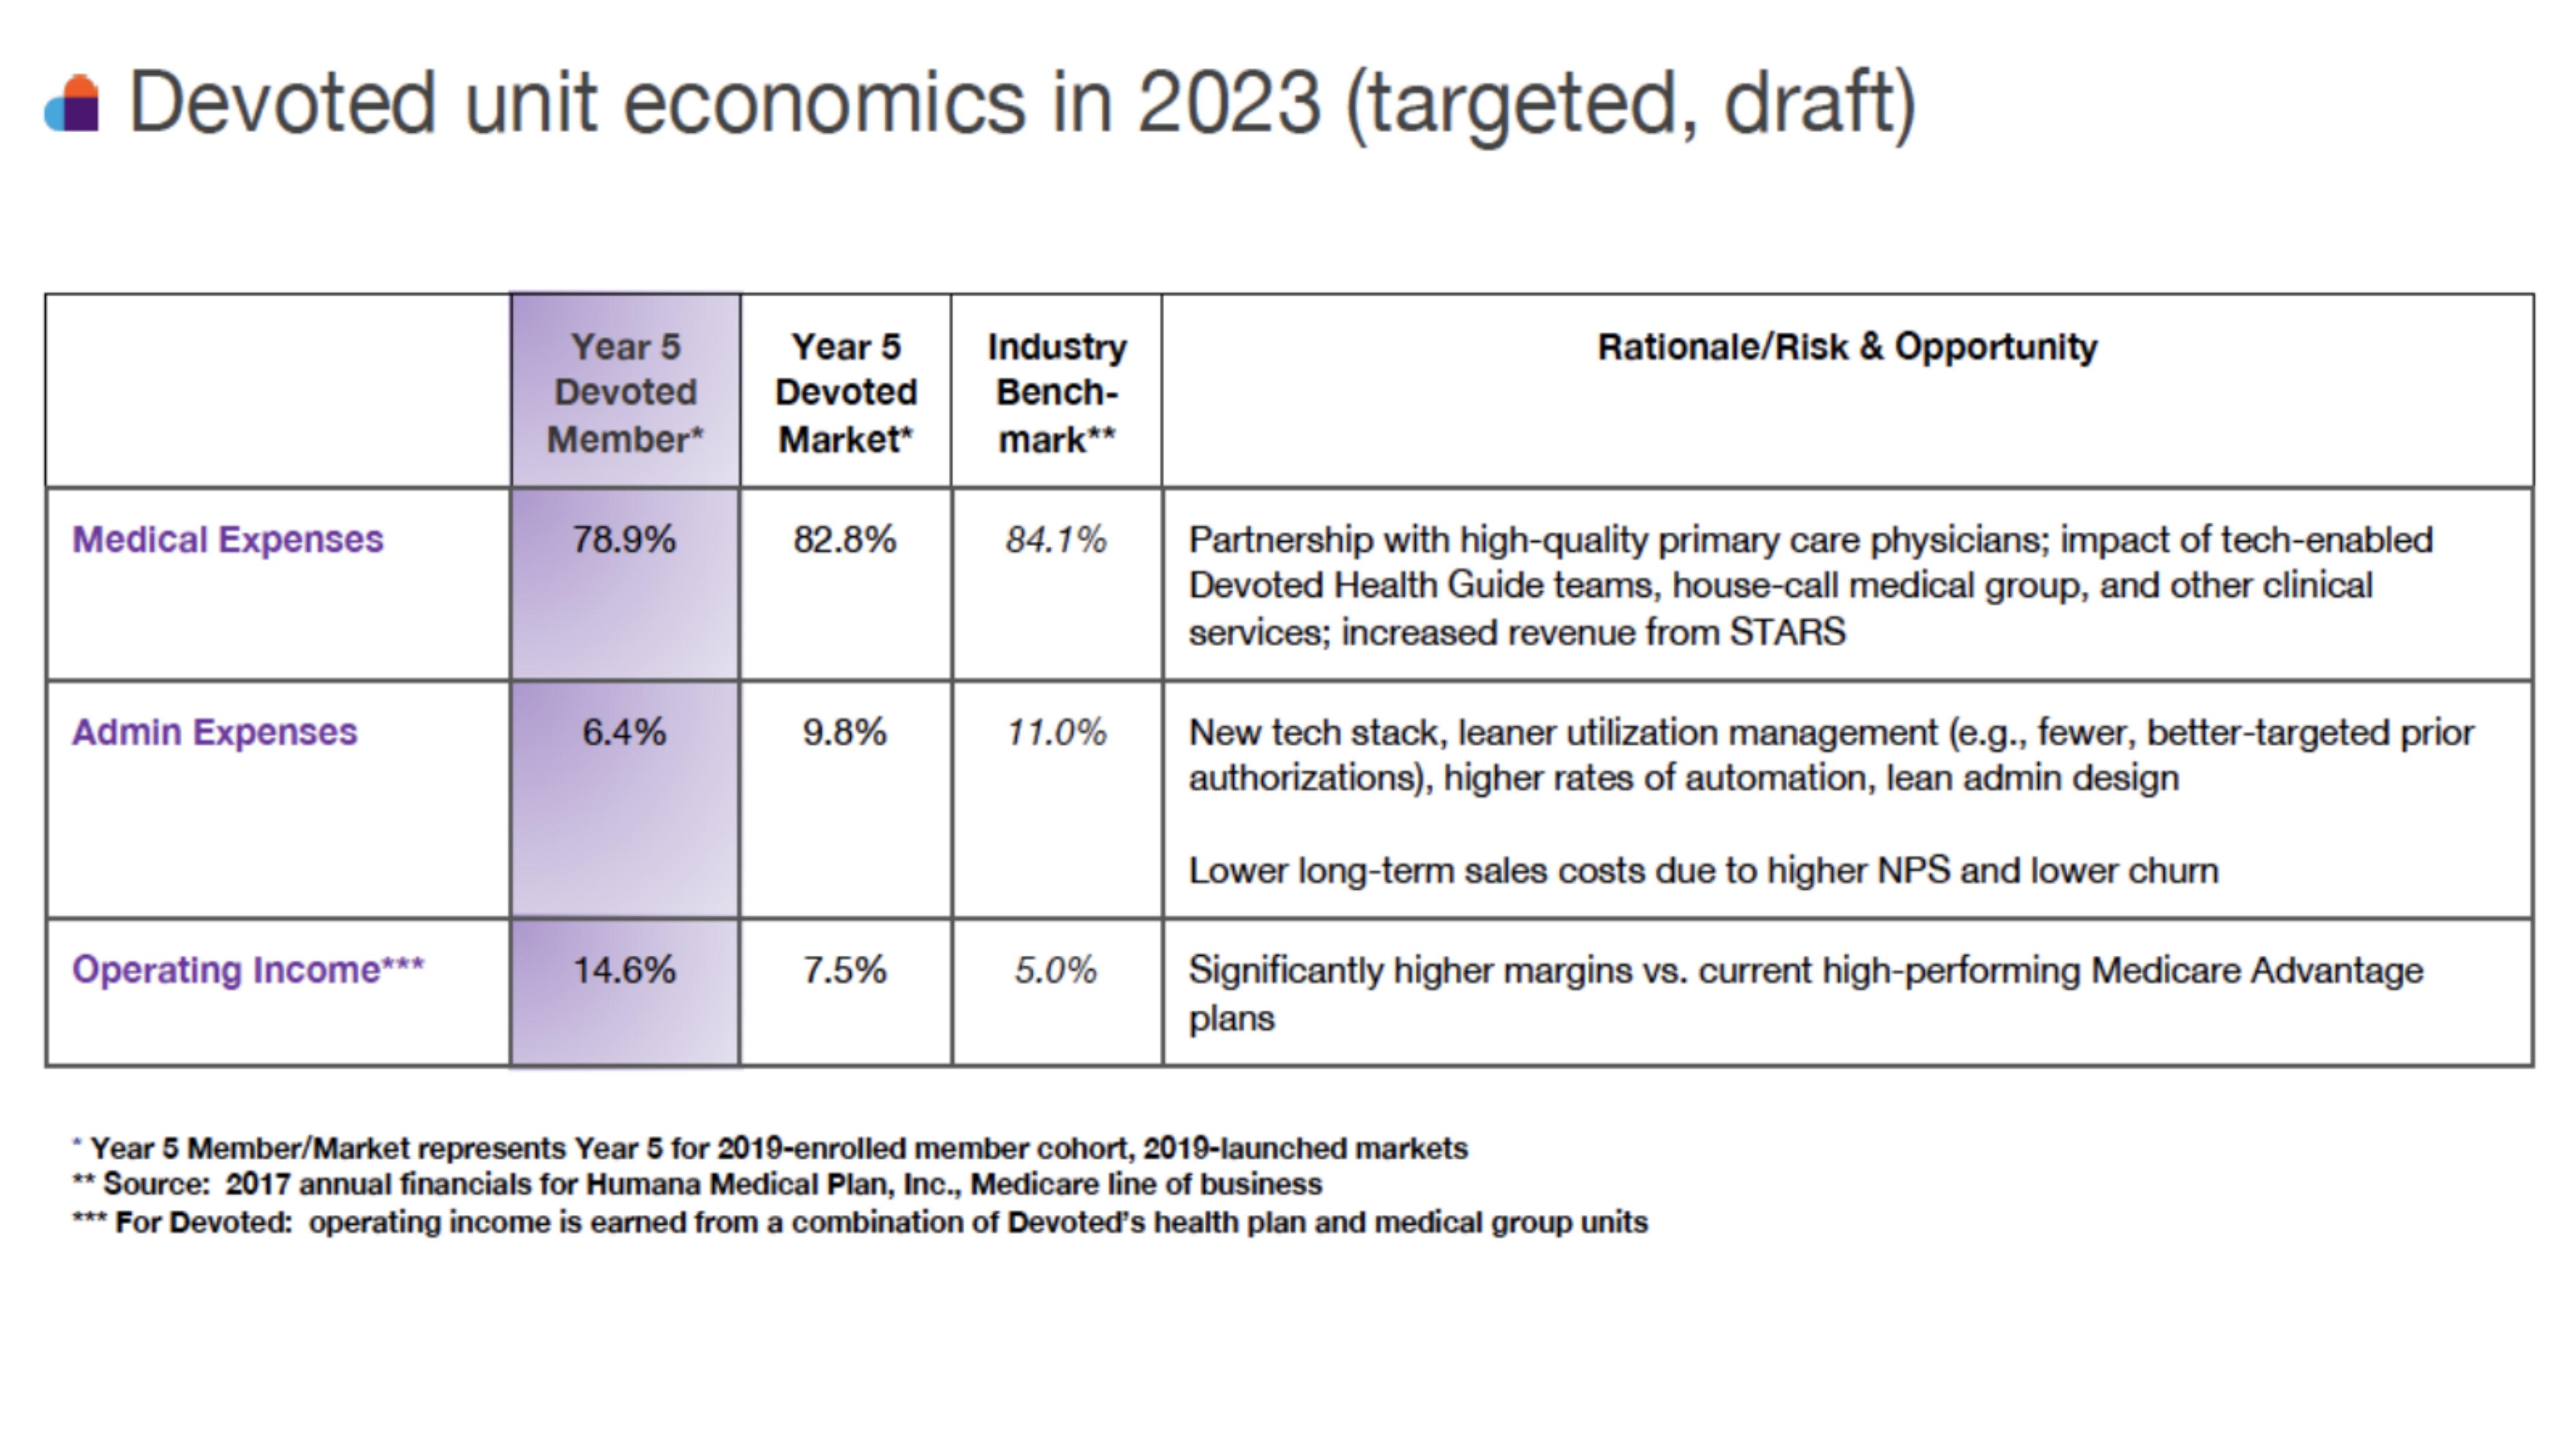
How to build a detailed financial model for Devoted Health
A complete walkthrough of the business, drivers, and assumptions behind the downloadable Devoted Health model - distilled from its pitch deck and publicly available information.
Product & value proposition
- Medicare Advantage plan for seniors with a differentiated cost model:
- Revenue formula: County benchmark × Plan risk score + STARS quality bonus.
- Devoted Health Guides: tech-enabled care-coordination teams to reduce medical costs.
- House-call medical group: owned clinical services that simultaneously lower total cost of care for the plan and generate revenue/margin for the medical group subsidiary.
- New technology stack reducing admin costs vs. legacy competitors.
- Lower churn via higher NPS → lower long-run sales costs.
- 4+ STARS rating yields a 5% CMS revenue uplift; 5 STARS allows year-round enrollment.
Revenue model
- Revenue = (County benchmark × Plan risk score) + STARS quality bonus.
- Average risk score assumption: 1.28 (2019), declining to ~1.15–1.16 (2020–2023) as cohort matures.
- Revenue is recognised on a per-member-month (PMPM) basis from CMS capitation payments.
- Medical Group earns separate revenue and margin by delivering clinical services.
- STARS bonus (4+ stars → +5% revenue) is a meaningful upside lever.
Traction & metrics
All figures from Slide 2 (draft financial projections; marked "Private & Confidential"):
Enrollment | Year | Members | Member-months | YoY Growth | | ----- | -------- | -------------- | ---------- | | 2019 | 5,000 | 45,000 | - | | 2020 | 15,750 | 154,500 | 243% | | 2021 | 33,650 | 343,800 | 123% | | 2022 | 64,358 | 667,890 | 94% | | 2023 | 103,722 | 1,105,311 | 65% |
Average risk score: 1.28 (2019) → 1.16 (2020) → 1.15 (2022–23).
Revenue ($000s) | Year | Revenue | YoY Growth | | ----- | -------- | ---------- | | 2019 | $52,870 | - | | 2020 | $166,806 | 216% | | 2021 | $370,351 | 122% | | 2022 | $721,860 | 95% | | 2023 | $1,193,144 | 65% |
P&L ($000s) | Line | 2018 | 2019 | 2020 | 2021 | 2022 | 2023 | | ----- | ----- | ----- | ----- | ----- | ----- | ----- | | Medical Expense | - | 49,146 | 145,313 | 320,236 | 611,248 | 1,002,184 | | % Revenue (MLR) | - | 93% | 87% | 86% | 85% | 84% | | Admin Expense (ex S&M) | 24,020 | 32,601 | 36,505 | 43,078 | 54,144 | 71,845 | | % Revenue | 61.7% | 21.9% | 11.6% | 7.5% | 6.0% | - | | Sales & Marketing | 7,315 | 8,830 | 21,009 | 30,364 | 45,831 | 57,918 | | % Revenue | - | 16.7% | 12.6% | 8.2% | 6.3% | 4.9% | | Operating Income | (31,335) | (37,708) | (36,022) | (23,327) | 10,637 | 61,197 | | % Revenue | - | 71.3% | 21.6% | 6.3% | 1.5% | 5.1% | | R&D Expense | 3,000 | 5,763 | 10,008 | 16,666 | 28,874 | 41,760 | | Taxes | 0 | 0 | 952 | 3,003 | 6,666 | 19,796 | | Net Income | (34,335) | (43,471) | (46,982) | (42,996) | (24,904) | (360) | | % Revenue | - | 82.2% | 28.2% | 11.6% | 3.4% | 0.0% |
Cash & Reserve Requirements ($000s) | | 2018 | 2019 | 2020 | 2021 | 2022 | 2023 | | | ----- | ----- | ----- | ----- | ----- | ----- | | Cumul. cash used (pre-reserves) | (34,335) | (77,806) | (124,787) | (167,783) | (192,687) | (193,046) | | Reserves | 10,000 | 14,000 | 34,802 | 52,769 | 98,236 | 147,398 | | % Revenue | - | 26.5% | 20.9% | 14.2% | 13.6% | 12.4% | | Cumul. cash used (incl. reserves) | (44,335) | (91,806) | (159,589) | (220,552) | (290,923) | (340,444) |
Unit economics
From Slide 1 ("Devoted unit economics in 2023, targeted, draft") - Year 5 cohort vs. benchmarks:
| Metric | Year 5 Devoted Member | Year 5 Devoted Market | Industry Benchmark (Humana 2017) |
|---|---|---|---|
| Medical Expenses (MLR) | 78.9% | 82.8% | 84.1% |
| Admin Expenses | 6.4% | 9.8% | 11.0% |
| Operating Income margin | 14.6% | 7.5% | 5.0% |
- "Year 5 Member" = Year 5 for a member enrolled in 2019 (i.e., 2023 cohort-level view).
- Industry benchmark source: 2017 annual financials, Humana Medical Plan Inc., Medicare line of business.
- Operating income for Devoted is a blended figure earned across health plan + medical group units.
Competition / moat
- Incumbents referenced only via benchmark: Humana Medical Plan (5.0% operating margin at industry-best).
- Devoted's stated moat: proprietary tech stack (lower admin), owned care coordination and medical group (lower MLR), STARS quality execution (higher revenue), and higher NPS (lower churn, lower long-run S&M cost).
- No explicit competitive landscape slide in the three available slides.
Recommended financial model
- Archetype + why: Medicare Advantage GWP / Medical-Loss-Ratio (MLR) operating model - the core economics are capitation revenue driven by member count, risk score, and STARS rating; costs are primarily medical expense (MLR), admin, and S&M. This mirrors the standard managed-care P&L structure. The owned medical group adds a second revenue/margin stream that must be modelled separately and then consolidated. A 3-statement model (IS + BS + CF) is warranted given the significant upfront capital requirements and statutory reserve obligations shown in Slide 2.
- Forecast horizon & granularity: 2018–2023 (matching the deck's own 6-year projection); annual granularity for the base model. Monthly/quarterly detail for the cash-burn and reserve schedule given the regulatory capital-requirement nature of reserves.
- Key drivers & assumptions:
- Member enrollment growth: 5,000 (2019) → 103,722 (2023); growth rates 243%/123%/94%/65%
- Average risk score: 1.28 (2019) → 1.15–1.16 (2020–2023)
- County benchmark PMPM (CMS rate): proxy from CMS published MA benchmark; ~$850–$950 PMPM national average, escalating ~3–5%/yr - needs actual county selection to pin down
- STARS rating uplift: 4+ STARS = +5% revenue; model as a binary flag (achieved/not achieved) per year
- MLR (medical expense % of revenue): 93% (2019) → 84% (2023)
- Target Year-5 member-cohort MLR: 78.9% vs. 82.8% market and 84.1% industry
- Admin expense % of revenue: 61.7% (2018, pre-revenue year) → 6.0% (2023); scale-driven reduction
- Sales & Marketing % of revenue: 16.7% (2019) → 4.9% (2023); lower churn assumption drives decline
- R&D % of revenue: 10.9% (2019) → 3.5% (2023)
- Tax rate: ~35% effective rate implied by projections for 2022 ($3,003 on pre-tax income of ~$10.6K); calibrate to actuals
- Statutory reserves % of revenue: ~26.5% (2019) → ~12.4% (2023)
- Medical Group margin contribution: partially embedded in blended operating income; needs separate segment disclosure - model as incremental margin uplift vs. pure-health-plan MLR
- CAC ($ per new member): derived from S&M spend / new member adds - e.g., 2020 new members ~10,750, S&M $21M → ~$1,950/member; confirm
- Scenarios (Base / Bull / Bear - which variables flex):
- Base: enrollment and P&L per deck projections; STARS 4+ achieved from 2021
- Bull: STARS 5 achieved (year-round enrollment, higher revenue uplift); MLR tracks to 78.9% Year-5 target faster; churn below 10%
- Bear: STARS miss (no bonus, restricted enrollment windows); MLR stickier at 88–90% in early years; enrollment ramp 20% slower; county benchmark cuts by CMS
- Required sheets / outputs:
- Assumptions & Drivers (risk score, PMPM benchmark, STARS flag, growth rates, margin %s)
- Enrollment Schedule (members, member-months, new vs. retained vs. churned)
- Income Statement (Revenue, Medical Expense, Admin, S&M, R&D, Operating Income, Taxes, Net Income - annual 2018–2023 + 5-yr beyond if desired)
- Medical Group Segment P&L (separate revenue and margin, then consolidated)
- Cash Flow & Reserve Schedule (cumulative cash used pre/post reserves; statutory reserve calculation)
- Unit Economics Dashboard (PMPM revenue, MLR, admin ratio, S&M ratio, operating margin per cohort year)
- Scenario Toggle (Base / Bull / Bear)
Frequently asked
Is the Devoted Health financial model free?+
Yes. The Devoted Health model is a free Excel (.xlsx) download with live formulas. Sign up with your email and the workbook is yours to keep, review, and edit.
What's included in the model?+
A 5-year monthly forecast with P&L, cash flow and runway, valuation (exit multiple plus a DCF cross-check), MOIC/IRR returns, and unit economics, with live formulas throughout.
How was this model built?+
It was built from Devoted Health's pitch deck and publicly available information, then structured to investment-banking standards as a fully editable Excel model.
Can I change the assumptions?+
Yes. You can change assumptions and the live formulas will recalculate in the downloadable Excel model.
Have more financial modelling questions? Contact us

Created by ex-finance professionals
Hey, I’m Alex and I created Finamodel.
Over my years in the finance industry I kept building the same models over and over again. Same structure, same assumptions, different logo. So I started building frameworks to turn them into clean, reusable templates.
Every model here is one I’d actually use for a client, and I personally vet each one before it goes up.
I’m not an expert in every industry, but I’ve built enough models to know what belongs in one. And when something is completely foreign to me, I reach out to my network for experts to work on our models with us.
Having a template library on hand cuts a first build from hours to minutes.
Need help finding your model? You’ll find me in the Finamodel app!
Other InsurTech Startup Financial Models
Browse another startup in the same category.
Ark Kapital
AI-powered precision lending platform for European tech startups, providing non-dilutive growth loans using real-time raw data analytics.

Battleface
Tech-enabled travel insurance platform covering high-risk and non-standard destinations globally, sold direct and via B2B2C partners.
Beam
Digital-first dental insurance company selling group dental (and ancillary) benefits to employers via brokers

Branch
Tech-enabled home & auto insurance company operating as a reciprocal exchange, selling bundled policies via embedded, direct, and agency channels.
Cachet
B2B2C insurtech marketplace offering flexible, usage-based insurance products to gig/platform economy workers via partnerships with ride-hailing, delivery, and gig platforms.

Caura
Mobile app that aggregates all car-related payments (parking, congestion/ULEZ, tolls, tax, insurance) into a single platform, with insurance comparison as a key monetisation layer.

Clark
Digital insurance broker (Makler) providing a robo-advisor + human expert hybrid platform to manage and purchase all insurance lines via mobile app

Counterpart
Digital MGA (managing general agent) selling D&O and management liability insurance to US SMEs via a tech-enabled underwriting platform.


