 Clark Financial Model
InsurTech Startup Financials (Free Excel Download)
Digital insurance broker (Makler) providing a robo-advisor + human expert hybrid platform to manage and purchase all insurance lines via mobile app



professionals from Deloitte
Used by professionals from






About this model
Clark is a digital insurance broker that lets consumers manage existing policies, identify coverage gaps, compare products, and receive support from both algorithms and human advisers. Its marketplace includes more than 160 carriers across multiple insurance lines.
Clark earns one-off commissions on new life and health policies and recurring management commissions on P&C and existing policies. Forty-two percent of FY2020E revenue was recurring, giving the broker a growing renewal and administration base without underwriting risk.
The model is broker-commission P&L. Policies managed, new sales, average premium, commission rates, renewal cohorts, adviser productivity, and churn create revenue. Marketing efficiency, product mix, recurring share, and customer retention determine EBITDA.
A turnkey financial model
Live formulas, no hardcoded values
Outputs are driven by live formulas, so the workbook updates from its assumptions instead of relying on hardcoded results.
All assumptions in one tab
Inputs are clearly marked in the Assumptions tab and separated from calculations, making it clear what to change and what to leave intact.
Statements always balancing
For integrated-statement models, the balance sheet, cash flow, and supporting schedules tie through properly.
Distinct schedules for clarity
Debt, working capital, taxes, and cash flow can get messy quickly. We group calculations in clear schedules, not across disconnected tabs.
No hidden macros or external links
There are no unexplained external workbook links or macros to undermine auditability or portability.
Changes flow through the model
Update a key driver and see the impact carry through the forecast, financing, and return outputs. We never use hardcoded numbers in formulas.
About Clark
clark.de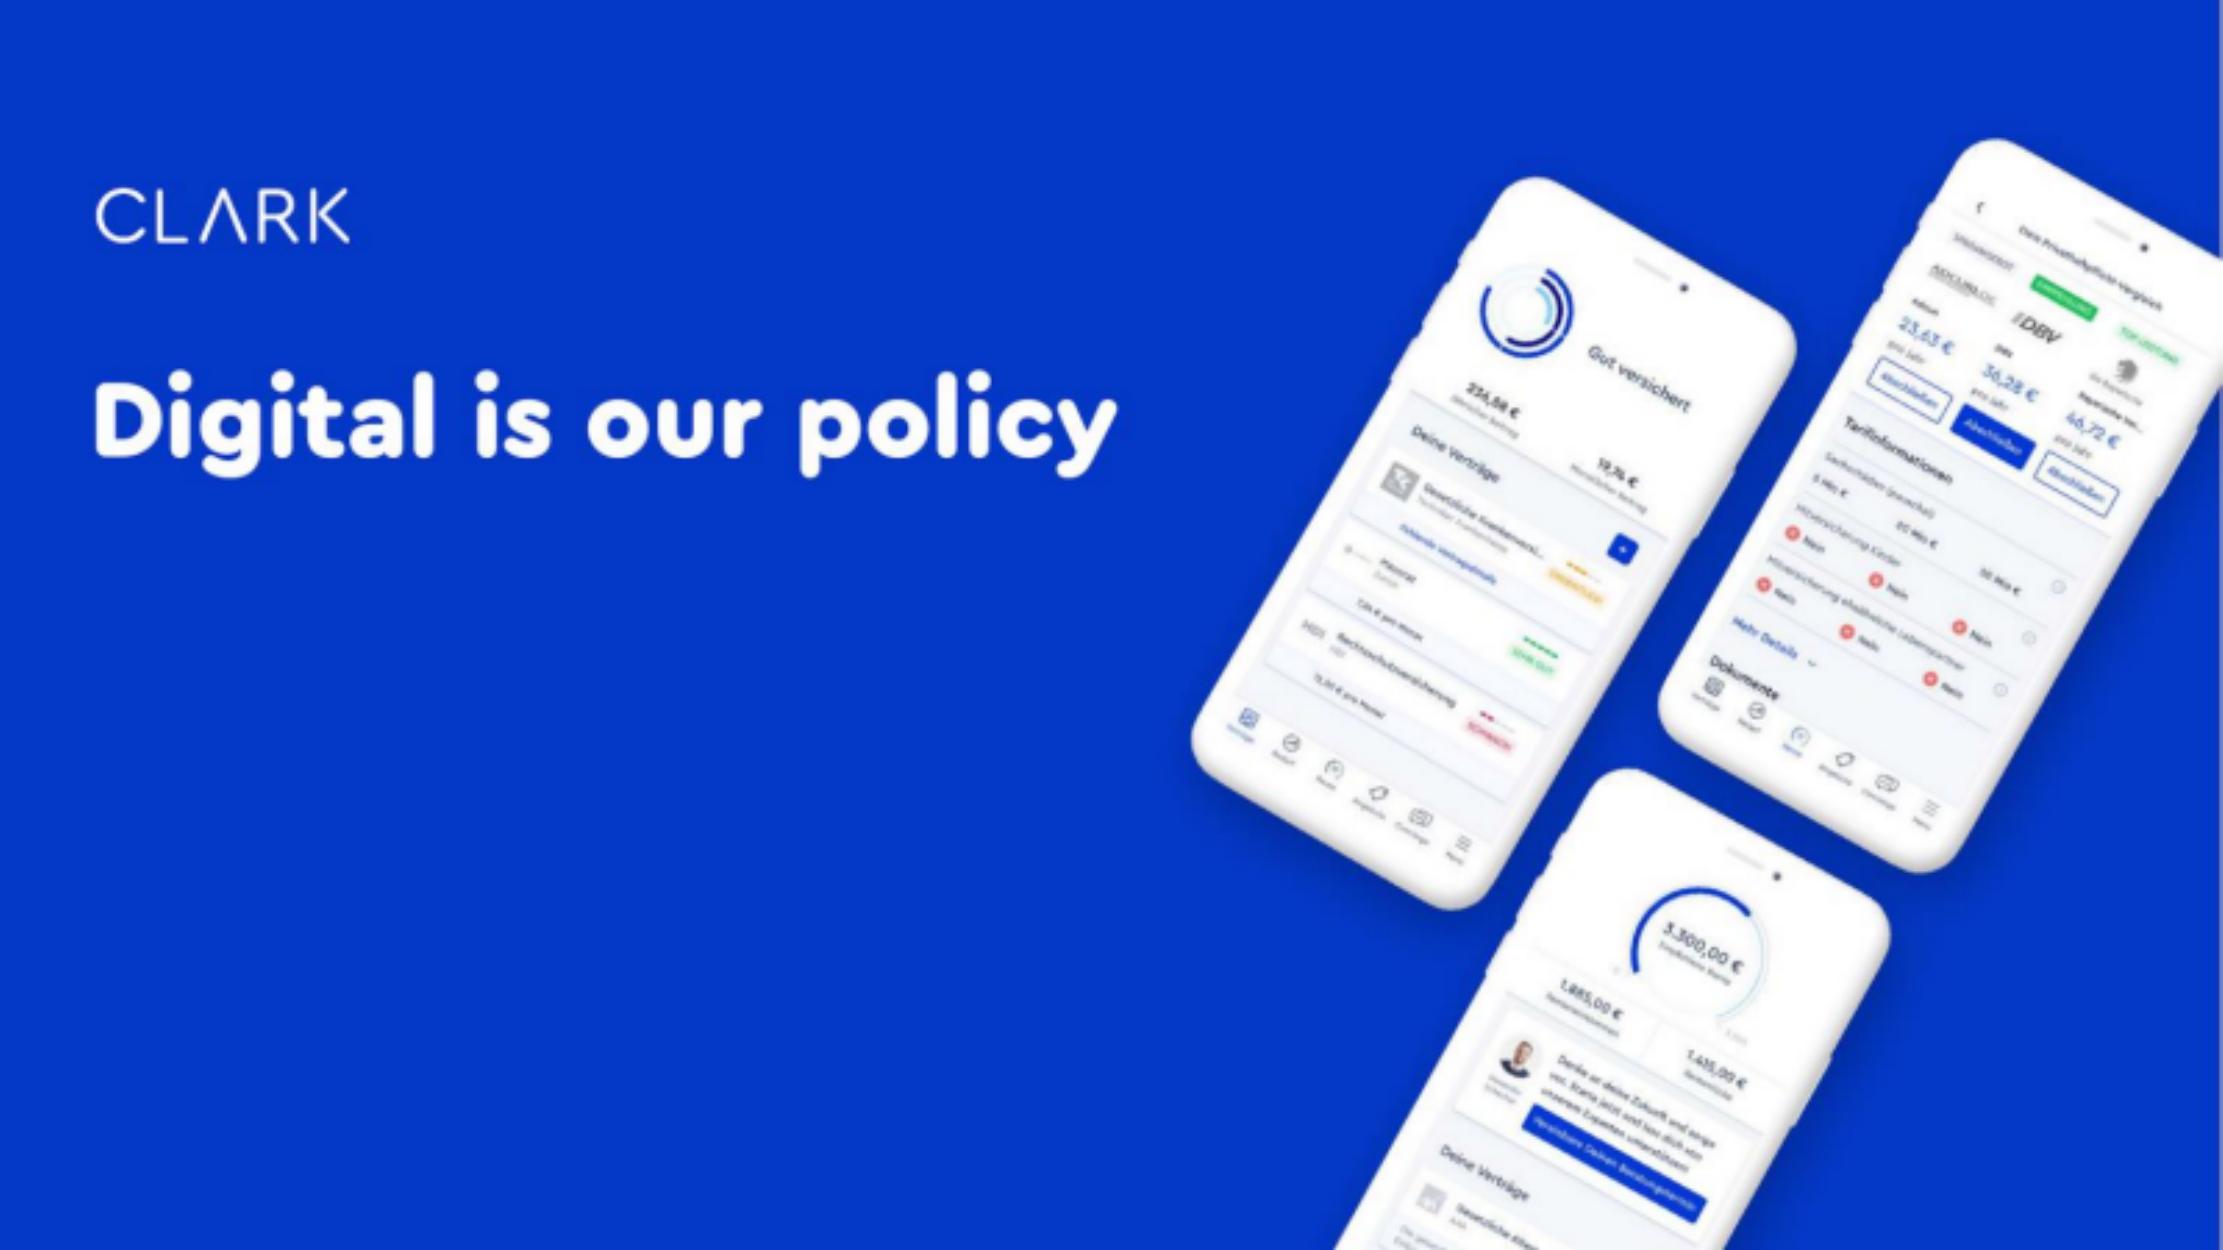
How to build a detailed financial model for Clark
A complete walkthrough of the business, drivers, and assumptions behind the downloadable Clark model - distilled from its pitch deck and publicly available information.
Product & value proposition
- Mobile-first insurance management app (iOS/Android) branded "CLARK"
- Core flows: (1) import/overview all existing policies; (2) AI-driven insurance gap assessment and scoring; (3) curated top-3 product recommendations; (4) 1-click in-app purchase; (5) concierge claims support via WhatsApp-style chat
- 160+ carrier marketplace - independent broker, not tied to any single carrier
- Hybrid model: robo-advisor handles P&C (lower-margin, higher-volume); human experts close Life & Health (higher-margin, more complex)
- Trustpilot score 4.6 vs Allianz 1.3, AXA 1.3, MLP 2.8
Market
- German insurance brokerage TAM: ~€17bn broker fees
- Calculated as broker commission % (OECD) × GWP (Fitch Solutions); source cited Statista/OECD/Fitch
- Western European broker fee TAMs by country visible on map (slide 3): UK ~€26B, France ~€18B, Netherlands/Belgium/Switzerland ~€3B each, Spain ~€6B, Italy ~€3B
- Total addressable Western European market implied: >€20B (the ~€20bn figure referenced in the value-creation math is described as "only existing markets")
- Disruption analogy: insurance brokerage TAM (€17bn Germany) is comparable to Hospitality (€16bn) and larger than Music (€2bn), Classifieds (€1bn)
Revenue model
- Two revenue streams:
- One-off sales fee - commission on new Life or Health policy sale
- Recurring management fee - ongoing admin/renewal commission on P&C and existing policies
- Mix: 42% of revenue is recurring fees (as of FY'20E)
- Distribution: 100% digital; direct-to-consumer via app; no agent network
- Carriers pay CLARK; consumer pays premium directly to carrier
- No premium balance sheet risk - pure broker/marketplace model
Traction & metrics
- Brand awareness: 15% aided brand awareness among German population - highest among pure-play digital insurance companies; #1 pure-play digital insurer in Germany after only 5 years
- Relative positioning: CLARK at 15% vs FRI:DAY at 11%, ottonova 7%, wefox 2%, Lemonade 2%
- Years in operation: 5 years
- Employee churn: 1.2% average unwanted churn (last 6 months)
Unit economics
- Medium-term EBITDA margin target: ~45%
- Per 1% market share in Germany: ~€200mm revenue, ~€90mm EBITDA
Competition / moat
- Traditional offline players (MLP, AON, Marsh & McLennan): large sales force, poor digitalization, fragmented
- Digital carriers / PCWs (comparison sites): price-led, P&C only, no advice
- Pure-play digital insures (Lemonade, wefox, ottonova, FRI:DAY): lower brand awareness, product-focused not broker-model
- CLARK's moat: (1) brand awareness lead; (2) true broker independence (160+ carriers); (3) hybrid robo + expert model enables high-margin Life/Health; (4) proprietary quality-scoring algorithm; (5) network effects from carrier relationships and data; (6) Trustpilot 4.6 (top NPS among peers)
- Positioning matrix: "Blue Ocean" - online + customer-focused
Team & funding ask / use of funds
- Dr. Christopher Oster - Co-Founder & CEO; previously COO/Co-Founder Wimdu (€100M revenue, 300K listings); 5 years BCG (financial institutions)
- Steffen Glomb - Co-Founder & CTO; 13+ years independent IT consultant; former Product Development Director ShipNet (170 developers)
- Dr. Marco Adelt - Co-Founder & COO; 20+ years insurance industry; 50+ consulting projects; offline broker experience
- Chris Lodde - Co-Founder & CMO; former VP Digital Banking at Commerzbank; Executive Advisor at Sun Capital Partners; 30+ projects at SMP AG
- Investors on board: Portage, White Star Capital, Finleap, Yabeo
Recommended financial model
- Archetype + why: Insurance brokerage revenue model (commission P&L) with a SaaS-like recurring revenue layer. CLARK is a broker, not a carrier - no underwriting risk. The right structure is a broker commission P&L model: build GWP managed → blended commission rate → gross revenue → split one-off vs recurring → operating expenses → EBITDA. This mirrors how MLP, Hypoport, and digital broker peers are modelled. The ~45% medium-term EBITDA margin target provides a clear terminal anchor.
- Forecast horizon & granularity: 5-year annual model (FY2020–FY2025), monthly in Year 1 if fundraise timing is relevant. Current markets only in base case; European expansion as a bull-case sensitivity.
- Key drivers & assumptions:
| Driver | Value | Source |
|---|---|---|
| German broker fee TAM | €17bn | - |
| Medium-term EBITDA margin target | ~45% | - |
| Revenue per 1% German market share | ~€200mm | - |
| Recurring revenue share (FY20E) | 42% | - |
| Current aided brand awareness | 15% | - |
| Starting market share (FY2020) | ~0.1–0.3% of €17bn TAM ≈ €17–50mm revenue; deck implies early-stage scaling | - |
| Annual market share gain | 0.1–0.2pp/yr in base; 0.3pp in bull; dependent on CAC spend | - |
| Blended commission rate | ~18–22% of GWP (industry standard for German brokers; OECD data cited in deck) | - |
| Revenue split: one-off vs recurring | evolves from 58%/42% toward 40%/60% as book matures | - |
| GWP per policy (P&C) | ~€300–500/yr, consistent with German market averages | - |
| GWP per policy (Life/Health) | ~€1,500–3,000/yr; higher margin | - |
| COGS / tech & ops | ~30–40% of revenue in early years; improves toward 55% gross margin at scale | - |
| Sales & marketing | ~25–35% of revenue; primary lever for growth | - |
| EBITDA margin trajectory | negative in near term → breakeven ~Year 3–4 → ~45% medium-term | - |
| European expansion revenue | begins Year 4–5; small contribution in base case | - |
- Scenarios (Base / Bull / Bear - which variables flex):
- Base: 0.15pp market share gain/yr in Germany; EBITDA margin reaches ~20–25% by Year 5; no material European revenue
- Bull: 0.25pp share gain/yr; early entry into 1–2 European markets by Year 4; EBITDA margin ~35% by Year 5
- Bear: 0.05–0.08pp gain/yr (slower adoption, increased competition from wefox/Lemonade); EBITDA breakeven pushed to Year 5+; marketing cost inflation
- Required sheets / outputs:
- Assumptions - all drivers in one place, clearly tagged
- Revenue build - GWP managed → commission revenue → one-off vs recurring split; by product line (P&C / Life / Health)
- P&L (Income Statement) - revenue → gross profit → EBITDA → EBIT (5-year annual)
- Unit economics bridge - market share % → implied revenue → EBITDA at maturity (mirrors slide 3 logic)
- Scenario analysis - 3 market share paths; EBITDA margin sensitivity table
- Valuation - EV/Revenue and EV/EBITDA multiples (20–30x EBITDA, per deck) applied to Year 3–5 EBITDA; DCF optional
- European expansion upside - simple revenue bridge showing incremental country contributions
- Dashboard - KPIs: GWP managed, market share %, revenue, EBITDA margin, recurring revenue %, LTV/CAC (if data available)
Frequently asked
Is the Clark financial model free?+
Yes. The Clark model is a free Excel (.xlsx) download with live formulas. Sign up with your email and the workbook is yours to keep, review, and edit.
What's included in the model?+
A 5-year monthly forecast with P&L, cash flow and runway, valuation (exit multiple plus a DCF cross-check), MOIC/IRR returns, and unit economics, with live formulas throughout.
How was this model built?+
It was built from Clark's pitch deck and publicly available information, then structured to investment-banking standards as a fully editable Excel model.
Can I change the assumptions?+
Yes. You can change assumptions and the live formulas will recalculate in the downloadable Excel model.
Have more financial modelling questions? Contact us

Created by ex-finance professionals
Hey, I’m Alex and I created Finamodel.
Over my years in the finance industry I kept building the same models over and over again. Same structure, same assumptions, different logo. So I started building frameworks to turn them into clean, reusable templates.
Every model here is one I’d actually use for a client, and I personally vet each one before it goes up.
I’m not an expert in every industry, but I’ve built enough models to know what belongs in one. And when something is completely foreign to me, I reach out to my network for experts to work on our models with us.
Having a template library on hand cuts a first build from hours to minutes.
Need help finding your model? You’ll find me in the Finamodel app!
Other InsurTech Startup Financial Models
Browse another startup in the same category.
Ark Kapital
AI-powered precision lending platform for European tech startups, providing non-dilutive growth loans using real-time raw data analytics.

Battleface
Tech-enabled travel insurance platform covering high-risk and non-standard destinations globally, sold direct and via B2B2C partners.
Beam
Digital-first dental insurance company selling group dental (and ancillary) benefits to employers via brokers

Branch
Tech-enabled home & auto insurance company operating as a reciprocal exchange, selling bundled policies via embedded, direct, and agency channels.
Cachet
B2B2C insurtech marketplace offering flexible, usage-based insurance products to gig/platform economy workers via partnerships with ride-hailing, delivery, and gig platforms.

Caura
Mobile app that aggregates all car-related payments (parking, congestion/ULEZ, tolls, tax, insurance) into a single platform, with insurance comparison as a key monetisation layer.

Counterpart
Digital MGA (managing general agent) selling D&O and management liability insurance to US SMEs via a tech-enabled underwriting platform.

Cover Genius
API-first B2B2C insurtech platform enabling digital companies to embed and distribute insurance and warranty products globally at the point of sale.


