IFiFarm Financial Model
Enterprise/Security Startup Financials (Free Excel Download)
B2B SaaS + consumables platform providing data-driven software and growing technology for indoor vertical farms



professionals from Deloitte
Used by professionals from






About this model
iFarm provides data-driven software and growing technology for indoor vertical farms. It combines operational tools with the equipment, consumables, and partner-enabled services needed to help farming operators manage controlled-environment production.
The business is a hybrid rather than a pure software company. Recurring SaaS subscriptions sit alongside consumables revenue and potential equipment or project fees, so customer value depends on both farm adoption and the physical operating footprint supported by the platform.
The model separates SaaS ARR, consumables revenue, and project or equipment fees. It forecasts farm customers, growing area or sites, recurring consumables use, implementation timing, hardware-related costs, subscription gross margin, channel economics, and cash needs under different deployment scenarios.
A turnkey financial model
Live formulas, no hardcoded values
Outputs are driven by live formulas, so the workbook updates from its assumptions instead of relying on hardcoded results.
All assumptions in one tab
Inputs are clearly marked in the Assumptions tab and separated from calculations, making it clear what to change and what to leave intact.
Statements always balancing
For integrated-statement models, the balance sheet, cash flow, and supporting schedules tie through properly.
Distinct schedules for clarity
Debt, working capital, taxes, and cash flow can get messy quickly. We group calculations in clear schedules, not across disconnected tabs.
No hidden macros or external links
There are no unexplained external workbook links or macros to undermine auditability or portability.
Changes flow through the model
Update a key driver and see the impact carry through the forecast, financing, and return outputs. We never use hardcoded numbers in formulas.
About iFarm
ifarmproject.com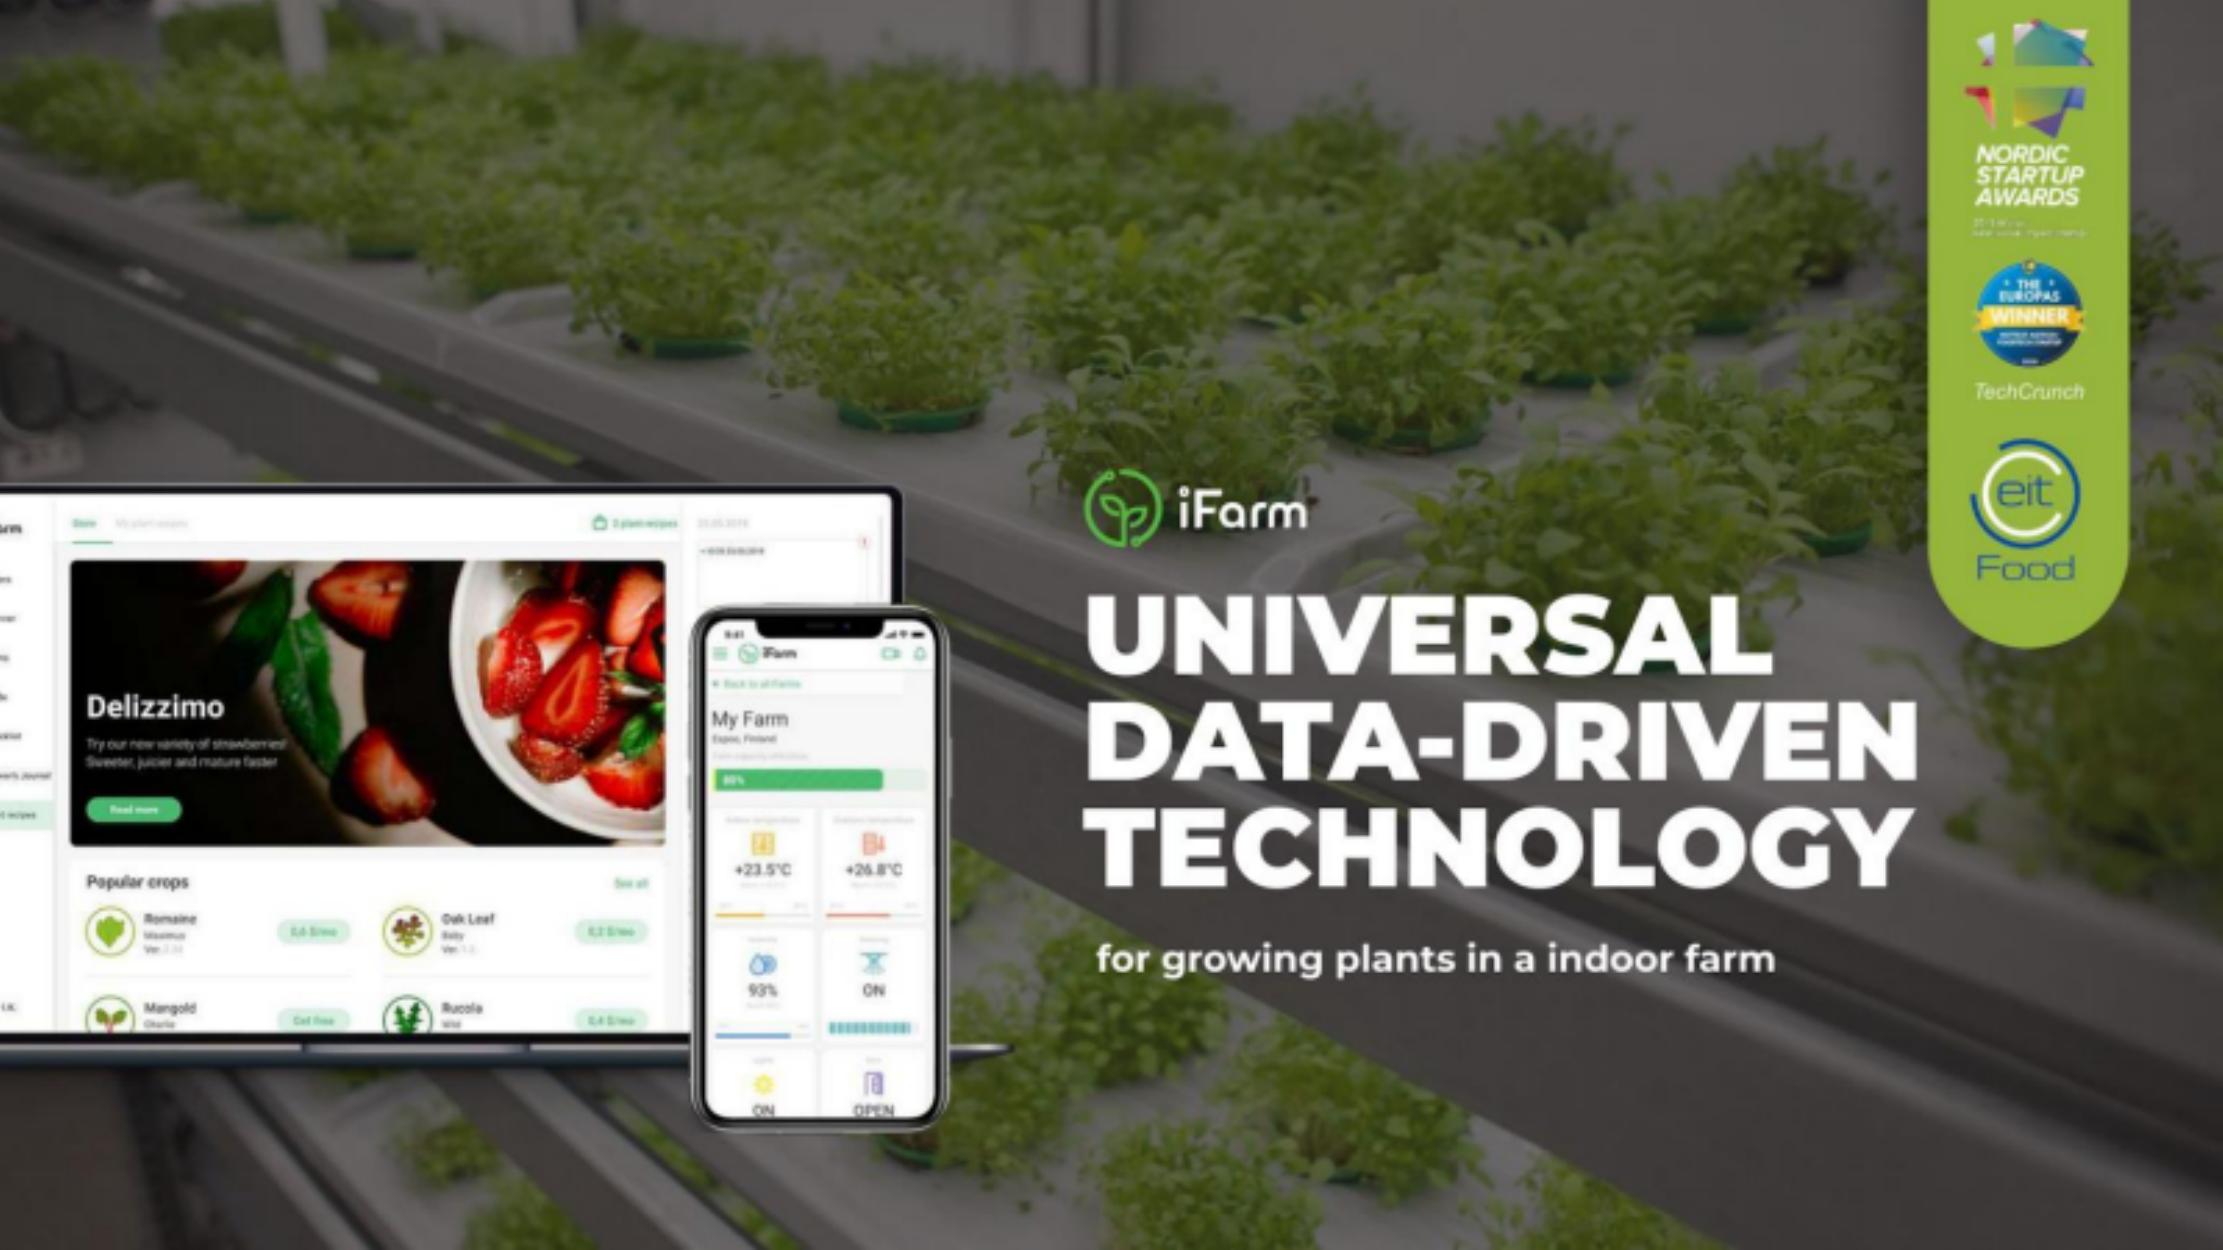
How to build a detailed financial model for iFarm
A complete walkthrough of the business, drivers, and assumptions behind the downloadable iFarm model - distilled from its pitch deck and publicly available information.
Product & value proposition
Three-component technology stack:
- iFarm Growtune Software - SaaS farm management platform: plant recipes (120+ unique growing recipes), environmental controls, production planning, monitoring, price/cost management, CRM, API
- Indoor Farm Hardware - scalable industrial farm infrastructure designed/built by authorized partners
- Growing Cartridges (Consumables) - seeds, fertilizers, pots, substrates, packaging, biosafety supplies
Value proposition: reduce food supply chain from 7 steps to 2 (farm → home); 99% less land, 90% less water, zero pesticides, 24/7/365 production, reduced CO2
AI layer: computer vision (plant weight/disease assessment), predictive analytics (demand forecasting, formulation adjustment), self-improving plant algorithms across farm network
Supported crop types: leafy greens, herbs, berries, flowers, vegetables, medicinal herbs, microgreens
Market
All figures from slide 03:
| Market | Size (2023) | CAGR |
|---|---|---|
| Fruit & Vegetable Market (TAM proxy) | $363B | 2% |
| Indoor Farming Market (SAM proxy) | $125B | 2.5% |
| Indoor Farming Technology Market (addressable) | $44B | 9.65% |
- SOM target: $2B = 5% of the Indoor Farming Technology Market by 2023
- World population growing to 10B by 2050; consumption 146 kg/year per person
Revenue model
Five-step customer journey; iFarm monetizes step 3 directly, steps 1/2/4/5 via authorized partners:
- Farm Design - authorized partners earn % of project cost; iFarm earns referral/channel % (exact rate not in deck)
- Farm Building - authorized partners earn % of unique equipment sales; iFarm earns on proprietary/unique equipment
- Growing Process (primary revenue stream) - direct SaaS subscription on Growtune software + recurring consumables (cartridges: seeds, fertilizers, pots, substrates)
- Special Services (sales, operations, finance) - authorized partners earn % of project cost
- Client Support - authorized partners earn % of project cost
No specific subscription pricing tiers, per-m² rates, or consumables pricing given in deck.
Traction & metrics
:
- Farms launched: 1,374 m² of indoor farm floor space operational
- Farms in Design & Construction: 11,258 m² in pipeline
- Geographic footprint: Helsinki HQ, Moscow, Novosibirsk, Delaware/East Coast US, Dubai - offices in 6 countries per team slide
- Timeline references 2020 and 2021 on map legend; deck is estimated ~2021 vintage
Environmental impact actuals (2020) used as indirect production proxy:
- Food produced in 2020: 469,345 kg
- Implied m² basis consistent with ~1,374 m² launched (cross-check: 469,345 kg ÷ 3.3 kg/m² ≈ 142,226 m²-equivalent conventional, or per vertical farming yields at the stated 3.3 kg/m² baby leaves = ~142,226 m² conventional basis)
No revenue figures, ARR, customer count, churn, or growth rates disclosed in deck.
Unit economics
No CAC, LTV, gross margin, EBITDA margin, or payback period data disclosed.
Competition / moat
Not explicitly a competition slide in deck. Moat implied through:
- Data network effect: AI plant algorithms improve as more farms connect; more farms = smarter recipes = lower prime cost and higher yield
- 120+ proprietary growing recipes across 6+ crop categories
- Partner ecosystem lock-in: authorized partners design, build, and service farms on iFarm technology
- Awards/recognition: Nordic Startup Awards, The Europas Winner, TechCrunch, eit Food featured
Team & funding ask / use of funds
Team:
- Alex Lyskovsky - President; founder of Alawar and Welltory
- Max Chizhov - CEO; founder at Virtuality.club and IISCI
- Kirill Zelenski - VP of iFarm Europe; prior Nokia, Kaspersky, F-Secure
- Konstantin Ulianov - COO; construction and production management background
- Distributed team of 40 professionals in 6 countries
Recommended financial model
Archetype + why: Hybrid SaaS ARR + Consumables recurring revenue model, layered over a farm m² expansion unit driver. The core engine is: new m² of farm floor space added each period → each m² generates a SaaS subscription fee + recurring consumables pull-through. Secondary revenue streams (equipment referrals, partner channel fees) are bolt-on line items. This mirrors a classic "razor-and-blade" or "platform + consumables" model (cf. software + cartridges) with farm m² as the installed base metric.
Forecast horizon & granularity:
- Horizon: 5 years (2021–2026), quarterly for years 1–2, annual for years 3–5
- Granularity: monthly operational cashflow optional in Year 1 given early-stage burn visibility
Key drivers & assumptions:
| Driver | Value / Tag |
|---|---|
| Launched farm m² at period start | 1,374 m² |
| Pipeline m² (Design & Construction) | 11,258 m² |
| Pipeline conversion rate to launched | 70% of pipeline converts within 12 months; typical construction project slippage |
| New m² added per year (growth) | ramp from ~5,000 m²/yr (Y1) to ~50,000 m²/yr (Y5); back-solved from iFarm's 2026 food production target of 47,520,000 kg ÷ 3.3 kg/m² ≈ 14.4M m² conventional equivalent, implying large farm base |
| SaaS subscription fee per m² per year | €15–€30/m²/year; no pricing in deck - sensitivity driver |
| Consumables revenue per m² per year | 1.5–2.5× SaaS fee based on razor/blade comparable ratios; primary recurring stream |
| Equipment/partner channel revenue | one-time fee at farm commissioning; ~10–15% of total project cost flowing to iFarm |
| SaaS gross margin | 75–85%; software-only marginal costs |
| Consumables gross margin | 40–55%; physical goods with logistics |
| Operating expenses | headcount-driven; 40 employees as baseline, scale with revenue |
| SOM target revenue ($2B by 2023) | use as revenue ceiling/bull case anchor |
| 2026 food production target | 47,520,000 kg - cross-check for implied installed base |
Scenarios (Base / Bull / Bear - which variables flex):
- Base: Pipeline converts at 70%; SaaS at mid-range €22/m²/yr; consumables at 1.8× SaaS; moderate new farm win rate
- Bull: Faster pipeline conversion (85%); SaaS pricing at high end (€30/m²/yr); consumables attach rate increases as crop diversity expands; geographic expansion accelerates (US + Dubai win rate improves)
- Bear: Pipeline conversion slips to 50%; SaaS pricing pressure (€15/m²/yr) from competitor incumbents; consumables substitution risk; slow US market entry; higher CAC/sales cycle
Required sheets / outputs:
- Assumptions - all drivers centralized, tagged or
- Farm m² Build - cohort model: installed base by region, pipeline → launched transition
- Revenue - SaaS ARR, consumables recurring, equipment/partner one-time; monthly/quarterly
- P&L (Income Statement) - revenue by stream, COGS by stream, gross profit, OpEx, EBITDA
- Headcount Plan - by function; scale from 40 baseline
- Cash Flow - operating CF, capex (if any direct farm builds), funding runway
- KPI Dashboard - m² installed, ARR, blended gross margin, ARR per m², CAC (when data available)
- Scenario Toggle - Base/Bull/Bear switchable via single cell
Frequently asked
Is the iFarm financial model free?+
Yes. The iFarm model is a free Excel (.xlsx) download with live formulas. Sign up with your email and the workbook is yours to keep, review, and edit.
What's included in the model?+
A 5-year monthly forecast with P&L, cash flow and runway, valuation (exit multiple plus a DCF cross-check), MOIC/IRR returns, and unit economics, with live formulas throughout.
How was this model built?+
It was built from iFarm's pitch deck and publicly available information, then structured to investment-banking standards as a fully editable Excel model.
Can I change the assumptions?+
Yes. You can change assumptions and the live formulas will recalculate in the downloadable Excel model.
Have more financial modelling questions? Contact us

Created by ex-finance professionals
Hey, I’m Alex and I created Finamodel.
Over my years in the finance industry I kept building the same models over and over again. Same structure, same assumptions, different logo. So I started building frameworks to turn them into clean, reusable templates.
Every model here is one I’d actually use for a client, and I personally vet each one before it goes up.
I’m not an expert in every industry, but I’ve built enough models to know what belongs in one. And when something is completely foreign to me, I reach out to my network for experts to work on our models with us.
Having a template library on hand cuts a first build from hours to minutes.
Need help finding your model? You’ll find me in the Finamodel app!
Other Enterprise/Security Startup Financial Models
Browse another startup in the same category.
AgBiome
AgBiome is a microbial-platform agtech company that discovers, develops, and commercialises biological crop protection products (and licences the platform across adjacent markets).

Alation
Enterprise data intelligence platform - data catalog, governance, and metadata management for large organisations.

Archer SPAC
Archera
Cloud resource automation platform that continuously optimizes AWS commitment purchases, de-risks overcommitment, and automates FinOps workflows.

Ardoq
Cloud-native Enterprise Architecture (EA) SaaS platform that helps large enterprises navigate digital transformation through automated data collection, graph-based architecture modelling, and change impact analysis.

Ascend
Ascend.io is an enterprise big data automation platform ("Enterprise Intelligence Platform") that abstracts away the complexity of big data engineering so non-experts can build and run data pipelines.

Athennian
Cloud-based legal entity management system (EMS) uniting entity data with workflow and document automation.

Auditboard
Cloud-based integrated risk management platform connecting audit, risk, compliance, and ESG teams across the enterprise.


