 LoanWell Financial Model
InsurTech Startup Financials (Free Excel Download)
B2B SaaS platform providing end-to-end automated loan origination, underwriting, and servicing software for community lenders.



professionals from Deloitte
Used by professionals from






About this model
LoanWell is end-to-end lending software for community development lenders, credit unions, banks, loan funds, and foundations. Its white-label platform covers borrower intake, underwriting, closing, servicing, and portfolio reporting, with configurable workflow, decisioning, document collection, and QuickBooks integration.
The company sells directly to community lenders that need faster, more consistent credit operations without building their own technology. Its commercial model is straightforward enterprise software: annual subscriptions range from $25,000 to $100,000 per customer, supplemented by one-time integration and onboarding fees of $5,000 to $20,000.
The LoanWell financial model uses a lender-logo waterfall, subscription ACV, and integration timing to build revenue. It tracks new sales, renewals, churn, expansion, and implementation capacity separately, then links them to customer success, sales, R&D, and cash runway. Base, upside, and downside cases flex new-logo growth, average contract value, churn, and gross margin.
A turnkey financial model
Live formulas, no hardcoded values
Outputs are driven by live formulas, so the workbook updates from its assumptions instead of relying on hardcoded results.
All assumptions in one tab
Inputs are clearly marked in the Assumptions tab and separated from calculations, making it clear what to change and what to leave intact.
Statements always balancing
For integrated-statement models, the balance sheet, cash flow, and supporting schedules tie through properly.
Distinct schedules for clarity
Debt, working capital, taxes, and cash flow can get messy quickly. We group calculations in clear schedules, not across disconnected tabs.
No hidden macros or external links
There are no unexplained external workbook links or macros to undermine auditability or portability.
Changes flow through the model
Update a key driver and see the impact carry through the forecast, financing, and return outputs. We never use hardcoded numbers in formulas.
About LoanWell
loanwell.com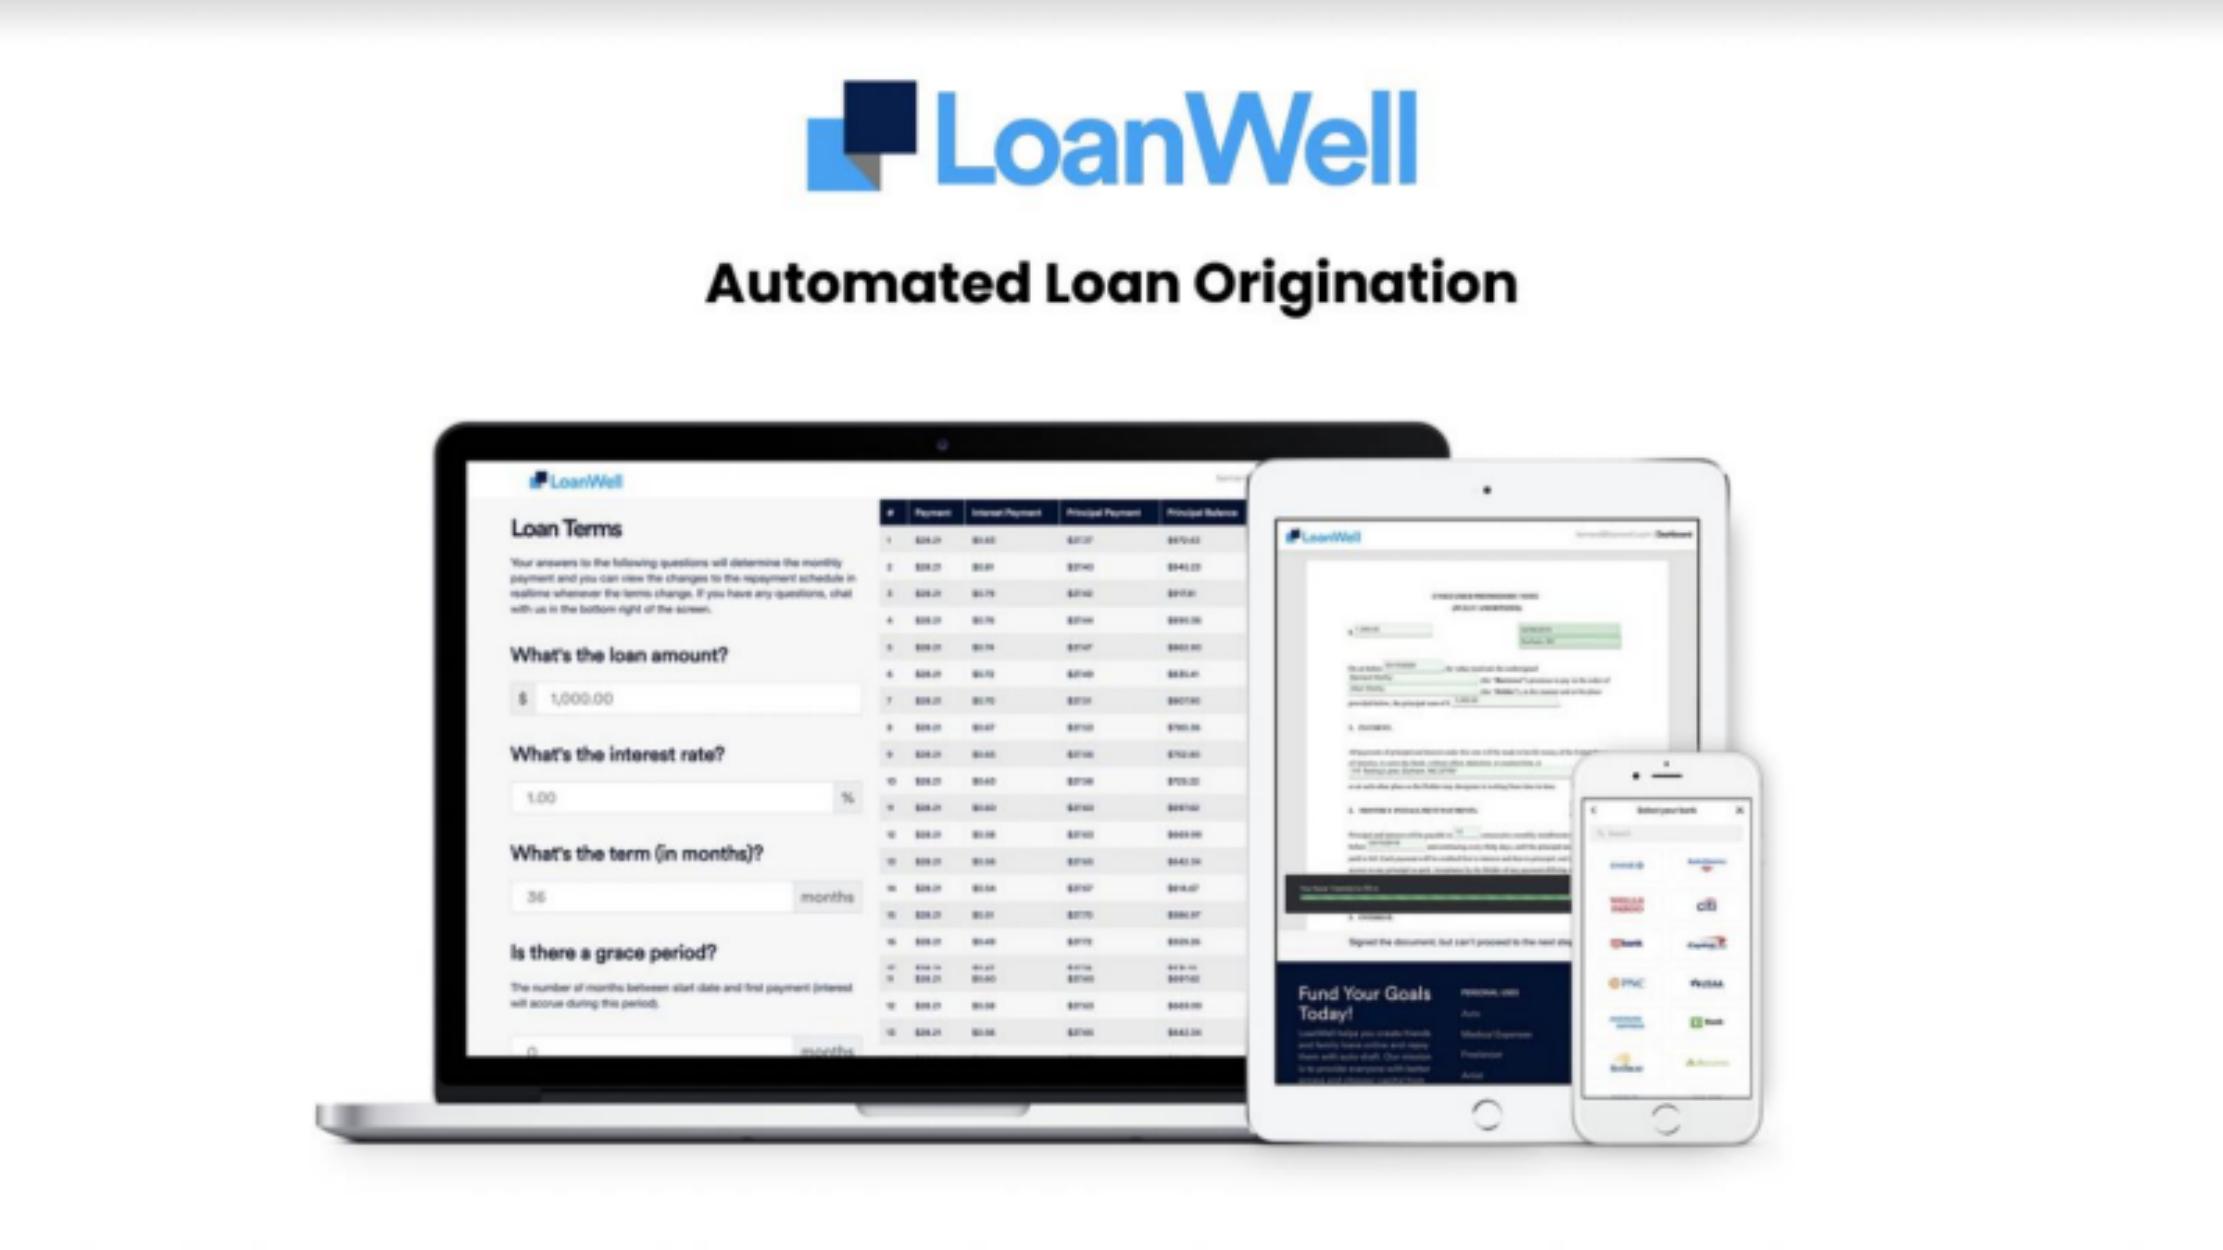
How to build a detailed financial model for LoanWell
A complete walkthrough of the business, drivers, and assumptions behind the downloadable LoanWell model - distilled from its pitch deck and publicly available information.
Product & value proposition
LoanWell is a branded, customizable end-to-end platform covering the full lending lifecycle: intake, origination, underwriting, closing, servicing, and portfolio reporting.
Key modules:
- Front end / borrower portal: Custom-branded white-label web portal (slide 6); TurboTax-inspired guided loan application with real-time payment schedule calculator (slide 1, 7).
- Workflow / back office: Multi-step lender workflow tracking (15+ process steps visible in slide 8); team collaboration; document collection and secure upload.
- Auto-decision engine: Configurable rules-based decisioning with third-party API integrations, Tax Return OCR, and automated letters (slide 9).
- Underwriting: Underwriting setup with QuickBooks integration (slide 8).
- Portfolio reporting: Portfolio-level reporting module (slides 4, 8).
Target customers: CDFIs, loan funds, community banks, credit unions, foundations (PRIs and social-impact investors).
Problem solved: Community lenders struggle with application intake, secure document collection, borrower follow-up, custom workflow management, slow closing times (>90 days), loan servicing efficiency, and portfolio reporting.
Market
- TAM: $8.5B/yr, 18.7% CAGR
- SAM: $540M+/yr, 15K+ lenders
- SOM: $100M+/yr, 3K+ community lenders
No source or methodology cited for market figures in the deck.
Revenue model
Two revenue streams:
| Stream | Range |
|---|---|
| Annual subscription plan | $25K – $100K/yr per customer |
| Integration / onboarding fee (one-time) | $5K – $20K per customer |
| Customer LTV (implied) | $75K – $300K |
- Pricing is B2B enterprise; direct sales channel (VP Sales role on team, slide 5).
- No per-transaction or usage-based fee mentioned.
- LTV implies average customer retention of ~3 years at midpoint pricing.
Traction & metrics
- 13 named "selected" customers shown on slide 12: Thread Capital, NC Rapid Recovery, Allies for Community Business, Appalachian Community Capital, Habitat for Humanity, Community Credit Lab, NC Rural Center, CornerSquare Community Capital, BBIF Florida, Impact Capital, The Institute Economic Development, Piedmont Business Capital, Accion Chicago.
- No ARR, MRR, revenue run-rate, growth rate, churn, or customer count with associated dollar figures disclosed.
- No closing timeline or number of live loans processed disclosed.
Unit economics
From deck:
- Customer LTV: $75K – $300K
- Annual subscription: $25K – $100K
- Integration fee: $5K – $20K
Competition / moat
Not explicitly addressed in deck. Implicit moat factors:
- Fully white-labeled / branded product for each lender (custom design, slide 6).
- Deep workflow customization tailored to community-lender compliance requirements.
- Auto-decision engine with configurable rules (slide 9).
- Integration ecosystem (QuickBooks noted; third-party API framework, slide 9).
- Sr. CS hire from Abrigo - direct competitor awareness (Abrigo is incumbent in community bank/credit union loan software).
Team & funding ask / use of funds
Team:
- Bernard Worthy - CEO/CTO; built software for Visa, Forbes, and startups.
- Justin Straight - COO/CFO; managed banks and credit unions in 4 countries.
- Philip Tester - VP Sales; Dir of Biz Dev at CloudFactory; scaled sales teams.
- Evan Halley - Sr. Engineer; built software for Bandwidth, Archive Social.
- Alison McGee - Sr. Customer Success; CS Manager at Abrigo, scaled CS teams.
Recommended financial model
Archetype + why: B2B SaaS ARR model with one-time integration fee layer.
- Recurring annual subscription is the primary revenue line; integration fee is a one-time event at contract signing. Both are defined in the deck. Vertical SaaS serving a defined, countable addressable market (3K+ community lenders in SOM).
Forecast horizon & granularity: 5-year annual model (Years 1–5), with Year 1 broken into quarterly detail to capture new logo ramp and integration fee timing.
Key drivers & assumptions:
| Driver | Value | Source |
|---|---|---|
| SOM - addressable community lenders | 3,000+ | - |
| Starting logo count (Year 0) | ~13 known customers | - |
| Annual subscription - low / mid / high | $25K / $62.5K / $100K | - |
| Integration fee - low / mid / high | $5K / $12.5K / $20K | - |
| Customer LTV | $75K – $300K | - |
| New logos/year (Year 1) | 15–25 | early-stage; VP Sales in seat; 13 reference logos already; 1–2 new logos/month is conservative for a direct-sales motion |
| New logo growth rate (Year 2–5) | 50–80% YoY | community lending market is fragmented (15K SAM lenders); accelerating sales hiring typical post-fundraise |
| Annual churn rate | 10% | B2B fintech vertical SaaS; sticky workflow software; Abrigo comps suggest low churn; 10% is conservative |
| Gross margin (subscription) | 75% | SaaS delivery; CS labor cost is the primary COGS; community lender segment is complex enough to require hands-on CS |
| Gross margin (integration fee) | 40% | onboarding/setup labor cost; integration projects require engineering and CS hours |
| Blended S&M as % of revenue | 35–45% | direct enterprise sales motion with VP Sales; typical for sub-$5M ARR stage |
| R&D as % of revenue | 25–30% | 2 engineers visible on team; product is complex (15-step workflow, OCR, decisioning engine) |
| G&A as % of revenue | 10–15% | lean team; COO/CFO in-house |
| Average contract length | 3 years | implied by LTV ÷ midpoint ACV; common for vertical fintech SaaS |
Scenarios (Base / Bull / Bear):
- Base: 20 new logos Year 1, 60% YoY growth, $62.5K avg ACV, 10% churn.
- Bull: 30 new logos Year 1, 80% YoY growth, $80K avg ACV, 5% churn (larger institutions in the mix).
- Bear: 10 new logos Year 1, 40% YoY growth, $45K avg ACV, 15% churn (slow sales ramp, price competition from Abrigo/nCino).
Required sheets / outputs:
- Assumptions - all drivers above, toggle for Base/Bull/Bear.
- Logo waterfall - new logos added, churned, net active by year/quarter.
- Revenue build - subscription ARR (ending ARR, average ARR), integration fees (one-time, recognized in period of signing).
- P&L - gross profit by revenue stream, S&M, R&D, G&A, EBITDA, net income.
- Cash flow / runway - operating cash burn by quarter (important pre-profitability).
- KPI dashboard - ARR, net new ARR, logo count, ACV, LTV, CAC (once spend is modeled), LTV:CAC, months to payback, gross margin %.
- Market penetration - logos as % of SOM (3K+), revenue as % of SOM ($100M+).
Frequently asked
Is the LoanWell financial model free?+
Yes. The LoanWell model is a free Excel (.xlsx) download with live formulas. Sign up with your email and the workbook is yours to keep, review, and edit.
What's included in the model?+
A 5-year monthly forecast with P&L, cash flow and runway, valuation (exit multiple plus a DCF cross-check), MOIC/IRR returns, and unit economics, with live formulas throughout.
How was this model built?+
It was built from LoanWell's pitch deck and publicly available information, then structured to investment-banking standards as a fully editable Excel model.
Can I change the assumptions?+
Yes. You can change assumptions and the live formulas will recalculate in the downloadable Excel model.
Have more financial modelling questions? Contact us

Created by ex-finance professionals
Hey, I’m Alex and I created Finamodel.
Over my years in the finance industry I kept building the same models over and over again. Same structure, same assumptions, different logo. So I started building frameworks to turn them into clean, reusable templates.
Every model here is one I’d actually use for a client, and I personally vet each one before it goes up.
I’m not an expert in every industry, but I’ve built enough models to know what belongs in one. And when something is completely foreign to me, I reach out to my network for experts to work on our models with us.
Having a template library on hand cuts a first build from hours to minutes.
Need help finding your model? You’ll find me in the Finamodel app!
Other InsurTech Startup Financial Models
Browse another startup in the same category.
Ark Kapital
AI-powered precision lending platform for European tech startups, providing non-dilutive growth loans using real-time raw data analytics.

Battleface
Tech-enabled travel insurance platform covering high-risk and non-standard destinations globally, sold direct and via B2B2C partners.
Beam
Digital-first dental insurance company selling group dental (and ancillary) benefits to employers via brokers

Branch
Tech-enabled home & auto insurance company operating as a reciprocal exchange, selling bundled policies via embedded, direct, and agency channels.
Cachet
B2B2C insurtech marketplace offering flexible, usage-based insurance products to gig/platform economy workers via partnerships with ride-hailing, delivery, and gig platforms.

Caura
Mobile app that aggregates all car-related payments (parking, congestion/ULEZ, tolls, tax, insurance) into a single platform, with insurance comparison as a key monetisation layer.

Clark
Digital insurance broker (Makler) providing a robo-advisor + human expert hybrid platform to manage and purchase all insurance lines via mobile app

Counterpart
Digital MGA (managing general agent) selling D&O and management liability insurance to US SMEs via a tech-enabled underwriting platform.


