PAPainWorth Financial Model
InsurTech Startup Financials (Free Excel Download)
Web tool that helps personal injury claimants calculate the value of their pain-and-suffering claim using court-case data.



professionals from Deloitte
Used by professionals from






About this model
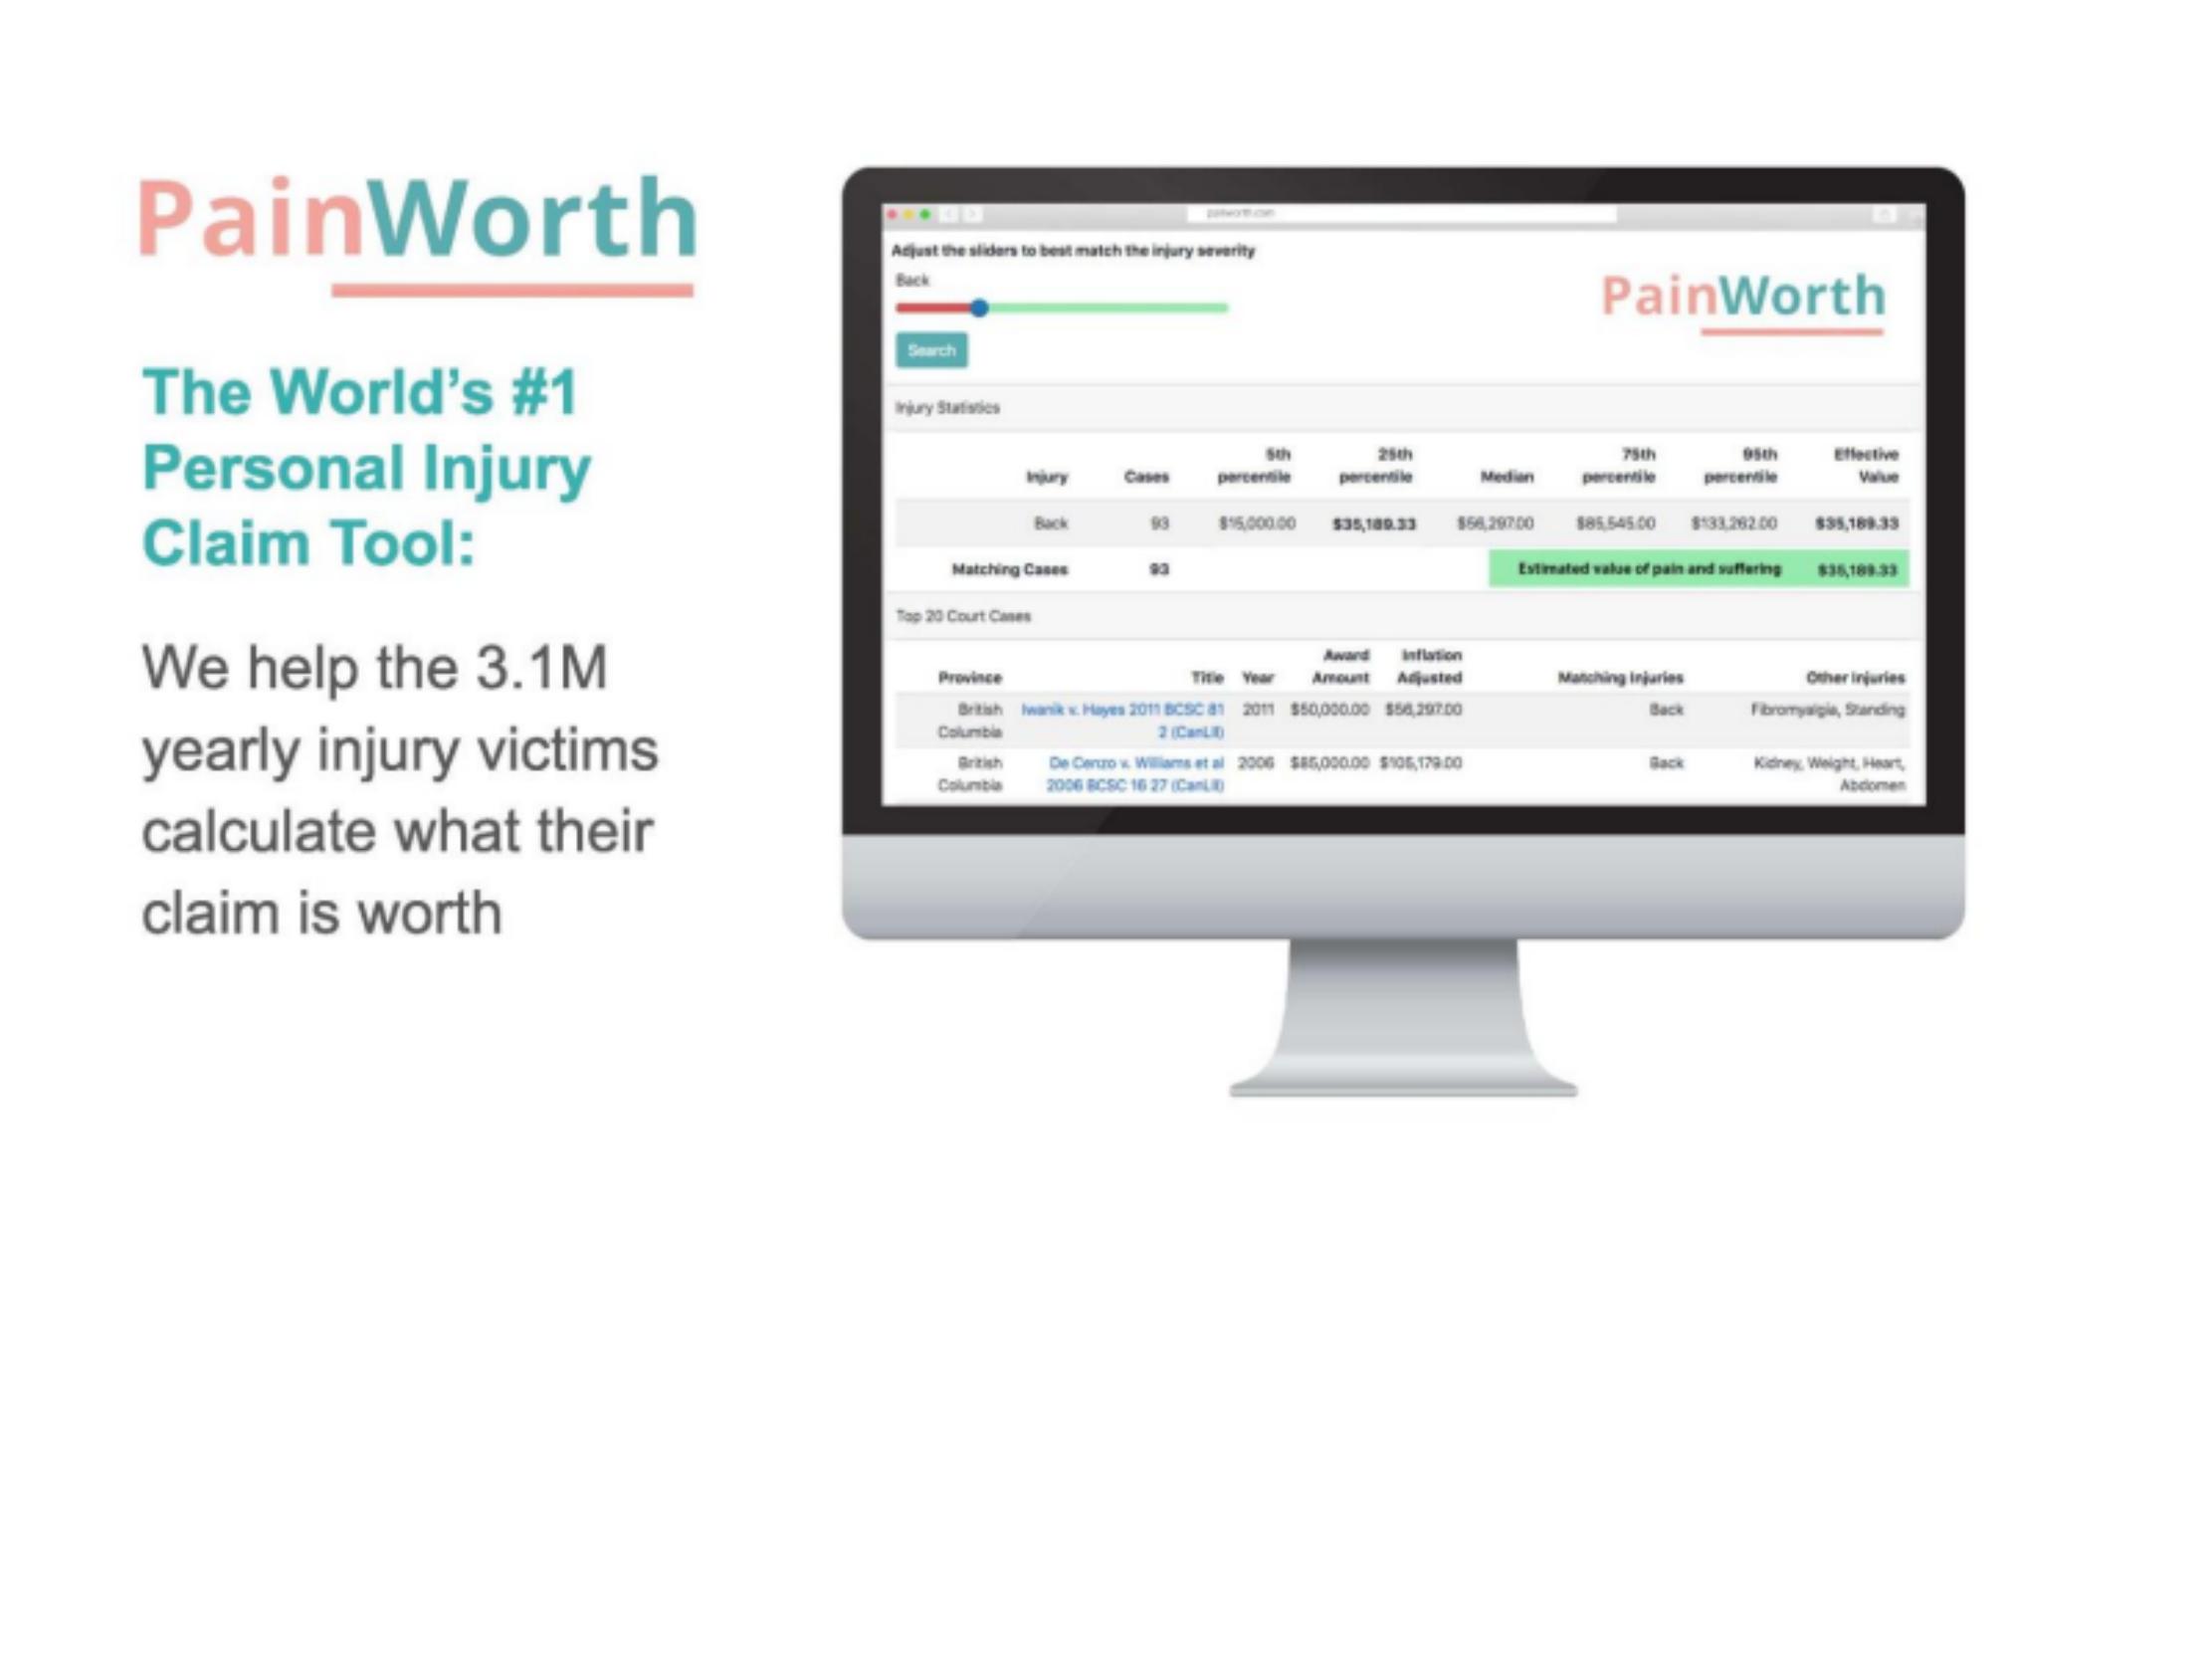
PainWorth is a web tool that estimates pain-and-suffering claim values using inflation-adjusted court-case data. Users adjust injury severity and receive comparable awards, percentile ranges, and an algorithmic estimate of potential claim value.
The product grew from about 50 users to 1,000 through a bootstrapped early phase. Its legal-data tool addresses consumers and potential legal partners, though the deck does not disclose a pricing model or current revenue.
The model should use a freemium legal-tech funnel. Users, paid conversion, subscription or report price, legal-partner referrals, retention, and acquisition build revenue. Data maintenance, search conversion, and potential attorney lead economics are key assumptions.
A turnkey financial model
Live formulas, no hardcoded values
Outputs are driven by live formulas, so the workbook updates from its assumptions instead of relying on hardcoded results.
All assumptions in one tab
Inputs are clearly marked in the Assumptions tab and separated from calculations, making it clear what to change and what to leave intact.
Statements always balancing
For integrated-statement models, the balance sheet, cash flow, and supporting schedules tie through properly.
Distinct schedules for clarity
Debt, working capital, taxes, and cash flow can get messy quickly. We group calculations in clear schedules, not across disconnected tabs.
No hidden macros or external links
There are no unexplained external workbook links or macros to undermine auditability or portability.
Changes flow through the model
Update a key driver and see the impact carry through the forecast, financing, and return outputs. We never use hardcoded numbers in formulas.
About PainWorth
How to build a detailed financial model for PainWorth
A complete walkthrough of the business, drivers, and assumptions behind the downloadable PainWorth model - distilled from its pitch deck and publicly available information.
Product & value proposition
- Slider-based UI: user adjusts injury severity sliders; platform queries a database of inflation-adjusted court cases and outputs 5th/25th/median/75th/95th percentile award values plus an "Effective Value" estimate.
- Example shown: "Back" injury, 93 matching cases; effective value = $35,189.33; median = $56,297.00.
- Surfaces top 20 comparable court cases with award amount and CPI-adjusted figure.
- Claims bias-removal benefit: algorithmic approach vs. human adjuster who awards women ~$5,000 less than men for equivalent injuries.
- Media coverage: CTV, Global News, CBC, 630CHED, LegalTechLIVE.
- Awards: 2021 InsurTech Hartford Innovation Challenge Winner (Travelers "Best Emerging InsurTech Product"); 2021 American Bar Association Startup Alley TechShow Winner.
Market
- Total addressable: 3.1M yearly personal injury victims (geography not specified, likely Canada + US implied).
- Context provided: 80% of injury victims cannot access legal help due to cost or "poor case economics"; average litigation wait time 5 years, sometimes 23 years.
Traction & metrics
- Users at "Birth" (2020): 50.
- Users at "Today" (~late 2021 / early 2022): 1,000.
- Projected users late 2023: 20,000.
- Growth descriptor: "bootstrapped 20x growth".
- Monthly trend chart (slide 6): shows exponential-style curve Dec 2019 → Dec 2020; two media-driven traffic spikes (CTV, Global News) visible - no Y-axis absolute values readable.
- Team size: 7 employees + 1 external counsel.
Competition / moat
- Moat claims: proprietary database of CPI-adjusted Canadian court case awards; algorithm removes human adjuster bias; "World's #1 Personal Injury Claim Tool" positioning.
- Indirect competition: lawyers, insurance adjusters, traditional litigation process.
- Advisor network cited as providing "access to key data repositories and critical industry relationships" in insurtech, legaltech, and insurance.
Team & funding ask / use of funds
- Mike Zouhri - Co-Founder / CEO: serial entrepreneur, community leader, active in social justice causes.
- Chris Trudel - Co-Founder / CTO: >20 years enterprise development, 3x startup experience, experienced chief architect.
- 7 employees + 1 external counsel.
- Advisors: Andrew Arruda (LegalTech), Kyla Sandwith (Legal Scaling), Braden Bosch (Insurance), Ashif Mawji (VC/Serial), Colin LaChance (LegalTech), Sean Morrow (Insurance), Ryan Bencic (Tech Lawyer).
Recommended financial model
- Archetype + why: Consumer freemium / SaaS user-growth model with optional B2B revenue track. Revenue model is absent from the deck so the model must be built around user/traffic growth as the primary driver, with placeholder revenue scenarios (e.g., subscription fee per claim report, B2B licensing per insurer seat, or referral fee per settled claim). A simple 3-statement model with a user-funnel revenue build is appropriate at this stage.
- Forecast horizon & granularity: Monthly for Year 1–2 (2022–2023), quarterly for Year 3–4 (2024–2025). 3-year base case minimum; 5-year for exit/valuation purposes.
- Key drivers & assumptions:
| Driver | Value |
|---|---|
| Personal injury victims / year (addressable) | 3.1M |
| Users at start of model (2022) | ~1,000 |
| Target users end 2023 | 20,000 |
| Implied 2022–2023 CAGR | ~20× over ~2 yrs ≈ ~347% annual |
| Organic monthly user growth rate post-2023 | 8–12% MoM |
| Conversion: free → paid (if freemium) | 3–5% |
| Average revenue per paying user (subscription) | CAD $20–$50 / report or $10–$30/mo subscription |
| B2B licensing channel (insurer / law firm seats) | Optional revenue line, Year 2+ |
| Gross margin (software, minimal COGS) | 70–80% |
| Headcount at model start | 7 employees + 1 counsel |
| Monthly burn (bootstrapped team of 8) | CAD $50K–$80K |
| CAC (paid acquisition) | CAD $15–$40 |
| Churn (annual, consumer) | 40–60% |
- Scenarios (Base / Bull / Bear - which variables flex):
- Bear: User growth slows to 50% YoY post-2023; conversion to paid stays at 2%; no B2B channel; burn exceeds revenue to 2025.
- Base: Users reach 20K by end 2023 per deck projection; 4% paid conversion; B2B pilots begin 2024; breakeven ~2024–2025.
- Bull: Media/PR partnerships accelerate users to 50K+ by end 2023; 6% paid conversion; insurer licensing deal closes 2023; profitable 2024.
- Required sheets / outputs:
- Assumptions dashboard (all drivers in one place)
- User funnel - registered → active → paid (monthly)
- Revenue build - consumer subscription + B2B licensing (separate lines)
- P&L / Income Statement (revenue, COGS, gross profit, OpEx by function, EBITDA)
- Headcount plan
- Cash flow / runway (critical - no raise amount disclosed; burn vs. revenue gap)
- Sensitivity table - user growth rate × ARPU (2×2 or 3×3)
- Summary KPI dashboard (users, MRR/ARR, gross margin %, runway months)
Frequently asked
Is the PainWorth financial model free?+
Yes. The PainWorth model is a free Excel (.xlsx) download with live formulas. Sign up with your email and the workbook is yours to keep, review, and edit.
What's included in the model?+
A 5-year monthly forecast with P&L, cash flow and runway, valuation (exit multiple plus a DCF cross-check), MOIC/IRR returns, and unit economics, with live formulas throughout.
How was this model built?+
It was built from PainWorth's pitch deck and publicly available information, then structured to investment-banking standards as a fully editable Excel model.
Can I change the assumptions?+
Yes. You can change assumptions and the live formulas will recalculate in the downloadable Excel model.
Have more financial modelling questions? Contact us

Created by ex-finance professionals
Hey, I’m Alex and I created Finamodel.
Over my years in the finance industry I kept building the same models over and over again. Same structure, same assumptions, different logo. So I started building frameworks to turn them into clean, reusable templates.
Every model here is one I’d actually use for a client, and I personally vet each one before it goes up.
I’m not an expert in every industry, but I’ve built enough models to know what belongs in one. And when something is completely foreign to me, I reach out to my network for experts to work on our models with us.
Having a template library on hand cuts a first build from hours to minutes.
Need help finding your model? You’ll find me in the Finamodel app!
Other InsurTech Startup Financial Models
Browse another startup in the same category.
Ark Kapital
AI-powered precision lending platform for European tech startups, providing non-dilutive growth loans using real-time raw data analytics.

Battleface
Tech-enabled travel insurance platform covering high-risk and non-standard destinations globally, sold direct and via B2B2C partners.
Beam
Digital-first dental insurance company selling group dental (and ancillary) benefits to employers via brokers

Branch
Tech-enabled home & auto insurance company operating as a reciprocal exchange, selling bundled policies via embedded, direct, and agency channels.
Cachet
B2B2C insurtech marketplace offering flexible, usage-based insurance products to gig/platform economy workers via partnerships with ride-hailing, delivery, and gig platforms.

Caura
Mobile app that aggregates all car-related payments (parking, congestion/ULEZ, tolls, tax, insurance) into a single platform, with insurance comparison as a key monetisation layer.

Clark
Digital insurance broker (Makler) providing a robo-advisor + human expert hybrid platform to manage and purchase all insurance lines via mobile app

Counterpart
Digital MGA (managing general agent) selling D&O and management liability insurance to US SMEs via a tech-enabled underwriting platform.


