 SuperMetrics Financial Model
Enterprise/Security Startup Financials (Free Excel Download)
#1 marketing data integration solution - connects 70+ marketing data sources to spreadsheets, BI tools, and data warehouses.



professionals from Deloitte
Used by professionals from






About this model
Supermetrics connects more than 70 marketing-data sources to spreadsheets, BI tools, and data warehouses. It gives marketers and analysts a managed integration layer for bringing fragmented campaign data into the reporting and analytics tools they already use.
The company serves a large self-serve customer base as well as enterprise buyers, with data-warehouse integrations creating a clear upsell path. Its deck cites 14,000-plus customers, 2.2 times year-on-year growth, and a 35% profit margin, so segment mix matters to the plan.
The model separates SMB and enterprise cohorts, tracking customers, pricing, warehouse upsell, and churn. Connector costs, product-led acquisition, sales hiring, gross margin, and operating expenses test how the established subscription base supports continued profitable growth.
A turnkey financial model
Live formulas, no hardcoded values
Outputs are driven by live formulas, so the workbook updates from its assumptions instead of relying on hardcoded results.
All assumptions in one tab
Inputs are clearly marked in the Assumptions tab and separated from calculations, making it clear what to change and what to leave intact.
Statements always balancing
For integrated-statement models, the balance sheet, cash flow, and supporting schedules tie through properly.
Distinct schedules for clarity
Debt, working capital, taxes, and cash flow can get messy quickly. We group calculations in clear schedules, not across disconnected tabs.
No hidden macros or external links
There are no unexplained external workbook links or macros to undermine auditability or portability.
Changes flow through the model
Update a key driver and see the impact carry through the forecast, financing, and return outputs. We never use hardcoded numbers in formulas.
About SuperMetrics
lunchbox.io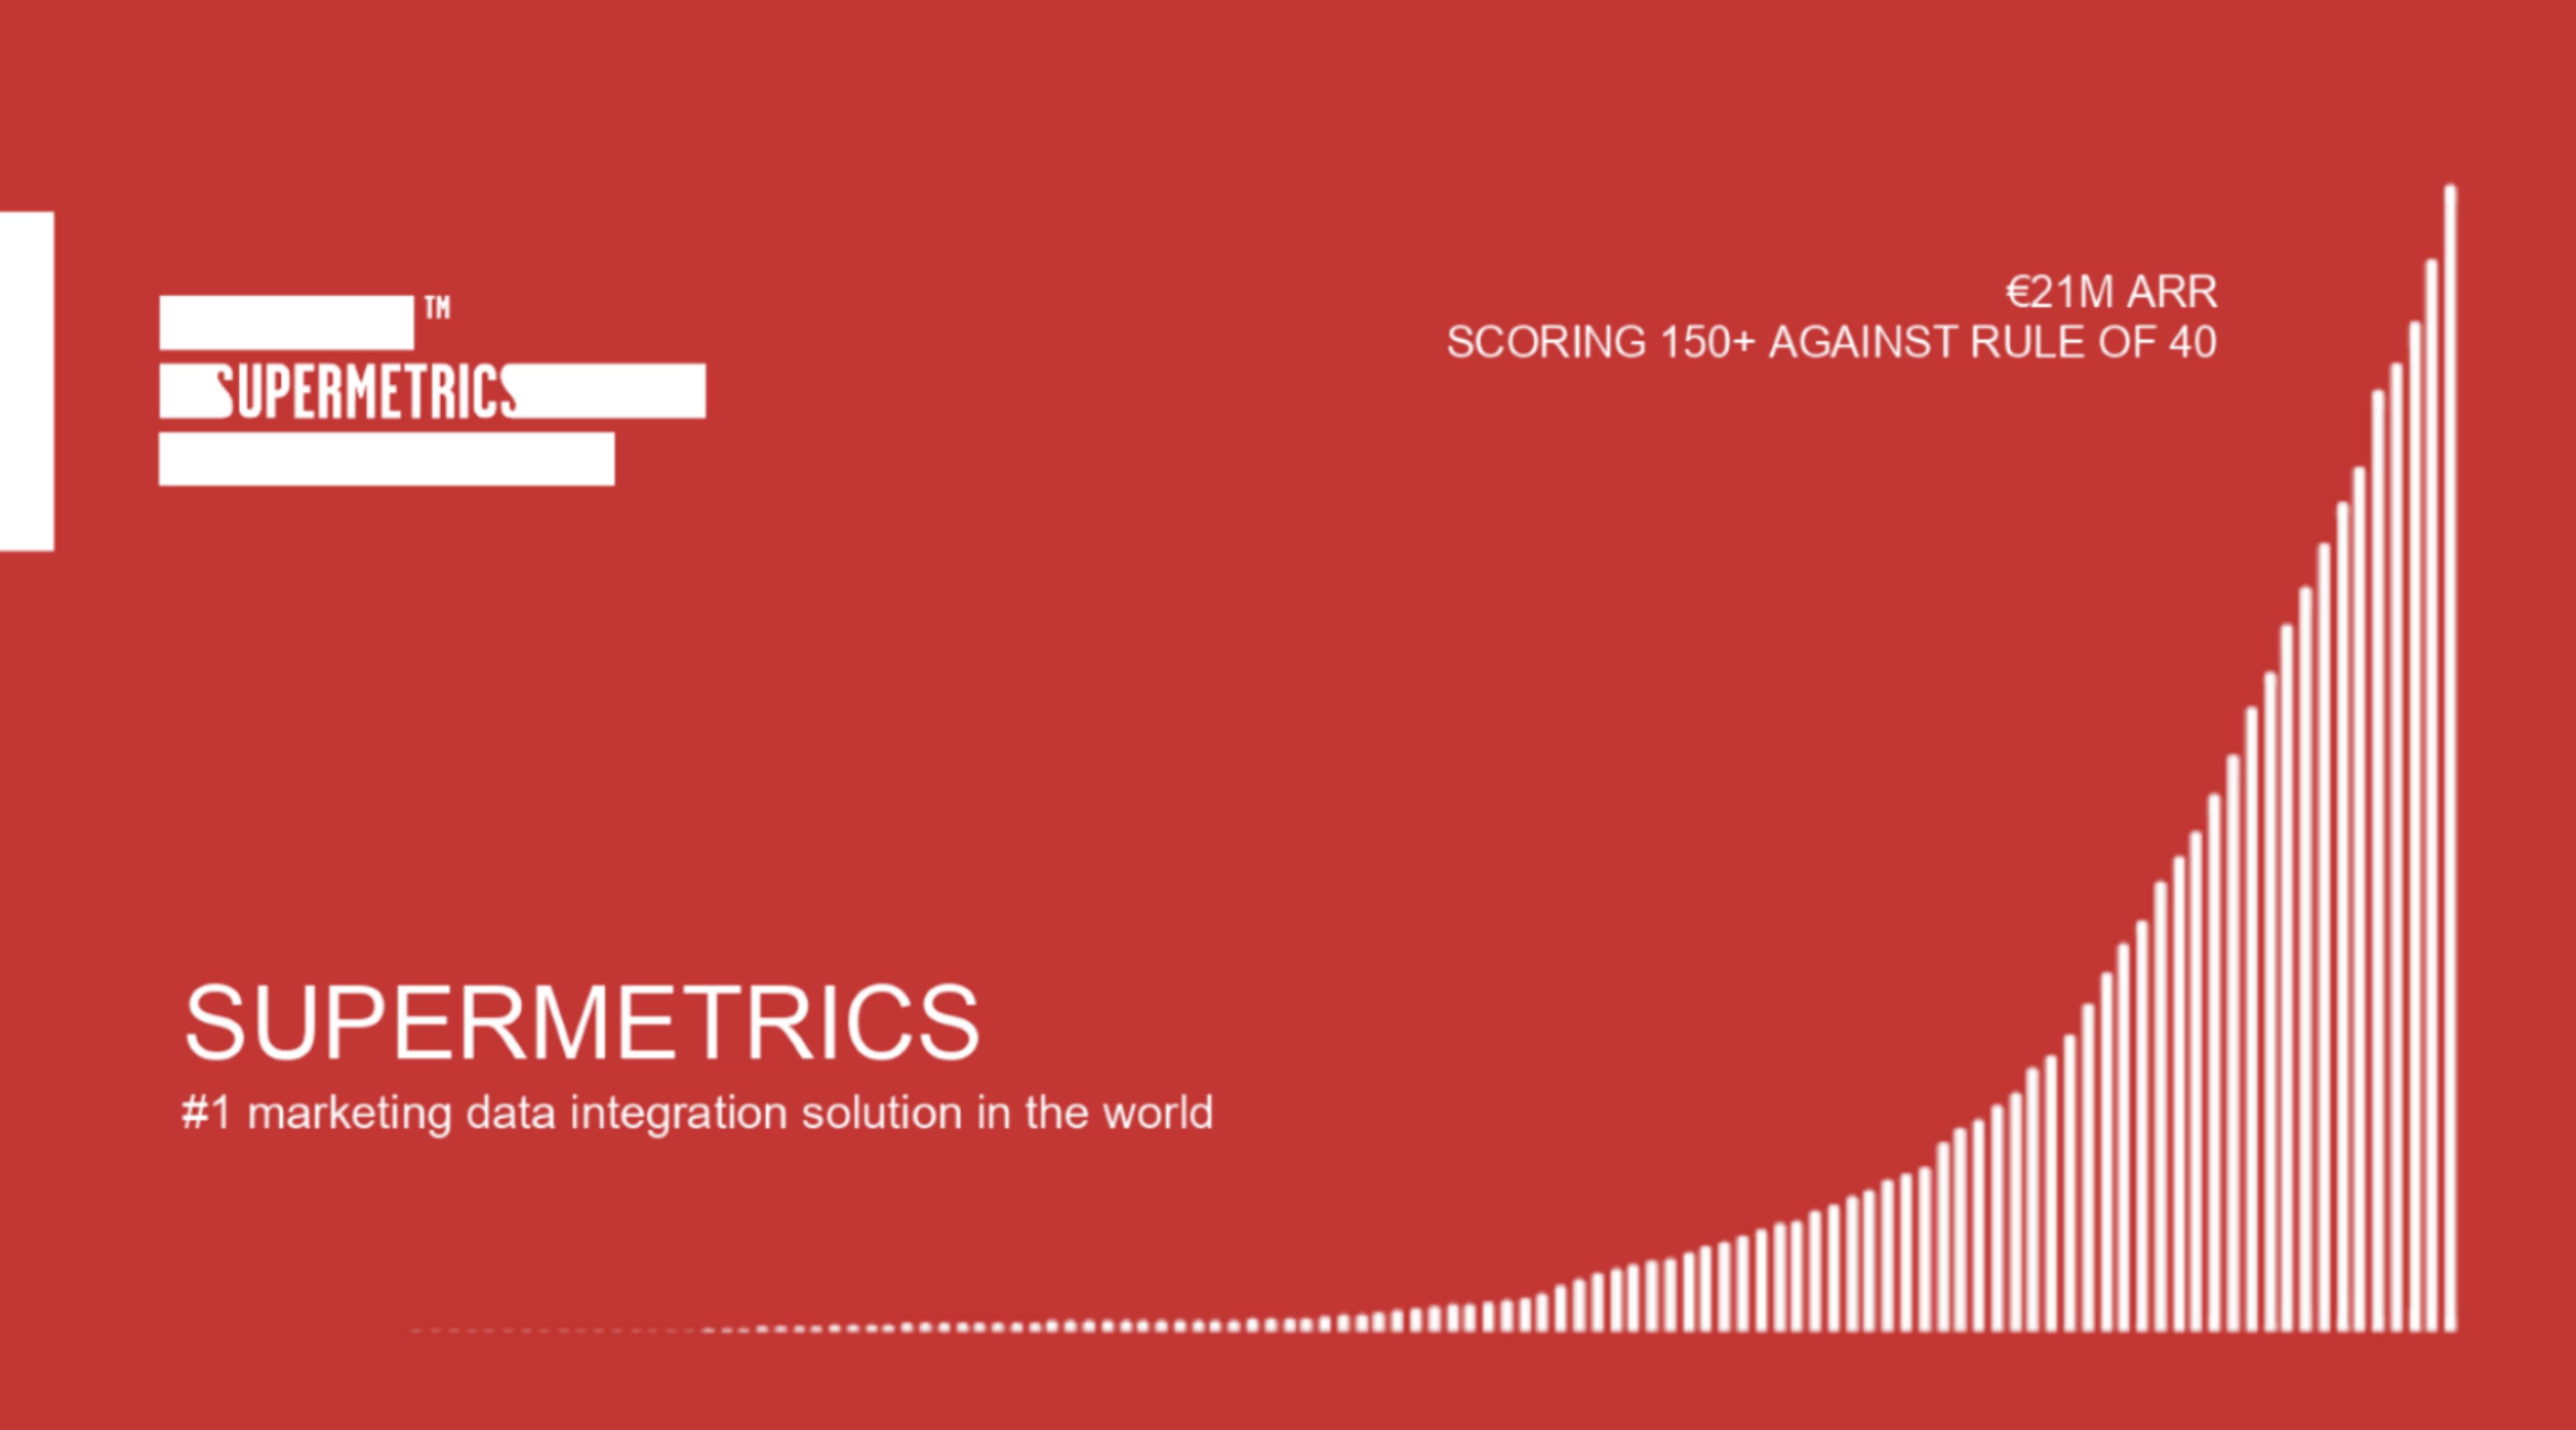
How to build a detailed financial model for SuperMetrics
A complete walkthrough of the business, drivers, and assumptions behind the downloadable SuperMetrics model - distilled from its pitch deck and publicly available information.
Product & value proposition
- Automated data pipeline pulling from 70+ marketing sources (Facebook Ads, Google Ads, etc.) into destinations: Google Sheets, Excel, Data Studio, Tableau, Qlik, Power BI, Google BigQuery, Supermetrics API.
- No-code; targets non-technical marketers and "citizen data scientists".
- Key differentiators: high-quality connectors (clean/unsampled data), zero data storage (data moves, never sits in Supermetrics systems), no new platform to learn.
- Next strategic bet: Marketing Data Warehouse - investing heavily to make data warehousing accessible to marketers.
Market
- 7,000+ data sources exist in the marketing tech landscape - used to frame problem scale.
- €28bn+ in ad spend processed through the platform - signals the scale of customer budgets flowing through.
- No explicit TAM/SAM/SOM figures in deck.
Revenue model
- Subscription SaaS - users pay per product/connector (inferred from product-suite structure: Supermetrics for Google Sheets, for Excel, for Data Studio, API, for BigQuery).
- Two product tiers implied: (1) Spreadsheets & Dashboards (self-serve, lower ASP), (2) Data Warehouses & BI tools (API + BigQuery, higher ASP / enterprise).
- Specific pricing tiers, ARPU, or contract lengths not shown in deck.
- Distribution channel: primarily product-led / marketplace-led (Google Workspace Marketplace: 359 ratings, 371,610 users on Google Sheets add-on alone).
Traction & metrics
- €21M ARR
- 2.2x YoY growth
- 14,000+ paying customers
- 500,000+ total users
- 35% profit margin
- €28bn+ in ad spend processed
- Rule of 40 score: 150+ (growth rate ~120% YoY implied + 35% profit margin)
- MRR chart (slide 9): starts near zero in 2011, near-flat through ~2014, then compound acceleration through 2020; rightmost bar (early 2020) reading ~€1.6–1.7M MRR, consistent with ~€21M ARR run-rate
- Key milestones on MRR chart: Excel (2011–12), Incorporation (2013–14), 1st employee + Google Sheets (2015), OpenOcean investment (2017), Data Studio launch (2017–18), Expansion to Atlanta & Vilnius (2018–19), Google BigQuery (2019–20)
- #1 app in Google's marketplaces by ratings, reviews, and users; rated #1 PPC reporting tool by influencers
- Enterprise customers include Nestlé, L'Oréal, Dyson, WB, Canon, Pfizer, HubSpot, dentsu, Havas Media
Unit economics
- Profit margin: 35% - implies highly capital-efficient, likely EBITDA or operating margin.
- CAC, LTV, payback period, gross margin (vs. operating margin) not disclosed.
- Implied ARPU: €21M ARR / 14,000 customers = ~€1,500/customer/year.
Competition / moat
- Category leader: #1 by ratings, reviews, and user count in Google's marketplaces.
- Rated #1 PPC reporting tool by influencers and marketers.
- Presence on G2, TrustRadius, Capterra.
- Moat sources (inferred from deck): connector quality and breadth (70+ sources), network effects via marketplace distribution, high switching cost (embedded in customer reporting workflows), brand trust with enterprise logos.
- Named competitors not shown in deck.
Team & funding ask / use of funds
- Leadership:
- Mikael Thuneberg - CEO; built automated data fetching to solve his own problem (founder).
- Henna Mäkinen - CFO; ex-CFO at Wolt, CFO at Ilmatar, Legal Counsel at Nokia.
- Duleepa "Dups" Wijayawardhana - CTO; ex-CEO Empire Avenue, ex-Sun/MySQL.
- Martin Illman - Sales; ex-Country Manager at Meltwater.
- Zhao Hanbo - Marketing & Biz Dev; ex-Zokem, Co-founder at Agaidi.
- Prior investor: OpenOcean.
Recommended financial model
- Archetype + why: SaaS ARR model with two segments (self-serve SMB / enterprise). Revenue is purely recurring subscription; 2.2x YoY growth, 14k+ customers, and a 35% profit margin make a standard SaaS ARR waterfall the natural fit. The data warehouse expansion (slide 13) adds an enterprise upsell motion worth modelling separately.
- Forecast horizon & granularity: Monthly for Year 1–2, quarterly for Years 3–5. Five-year horizon appropriate for a growth-stage SaaS at this scale.
- Key drivers & assumptions:
- ARR starting point: €21M
- YoY net new ARR growth rate: 120% in base year (back-calculated: 2.2x growth implies ~120% YoY);; assumed to decelerate to 60% / 40% / 30% in Y2–Y4
- Paying customers: 14,000+; blended ARPU ~€1,500/yr
- Two customer segments: (1) Self-serve / spreadsheet products (lower ARPU ~€500–800/yr, ~80% of customer count); (2) Enterprise / data warehouse + API (higher ARPU ~€5,000–15,000/yr, ~20% of customer count)
- Operating (profit) margin: 35%
- New customer adds: driven by PLG / marketplace; model as % of existing base + paid acquisition
- S&M as % of revenue: ~15–20% (consistent with 35% profit margin if G&A + R&D take the remainder)
- R&D / headcount growth: scale with revenue; new warehouse product investment implies elevated R&D spend in near term
- FX: Revenue reported in EUR; no FX complexity flagged in deck
- Scenarios (Base / Bull / Bear - which variables flex):
- Base: ARR growth decelerates from 120% → 60% → 40% → 30% → 20%; NRR 115%; profit margin holds ~30–35%.
- Bull: Data warehouse product lands enterprise contracts driving ARPU expansion; NRR 125%+; growth sustains 80%+ for 2 years.
- Bear: PLG growth slows as Google Marketplace matures; churn rises in SMB tier; growth decelerates faster to 30% by Y2; margin compresses to 20% as warehouse investment ramps.
- Required sheets / outputs:
- Assumptions - all drivers with Base/Bull/Bear toggles
- ARR Waterfall - opening ARR, new business, expansion, churn, closing ARR; split by segment
- P&L - Revenue, Gross Profit, S&M, R&D, G&A, EBITDA
- Customer Cohorts - customer count by cohort-year, churn, NRR
- Unit Economics - ARPU by segment, blended CAC, LTV, payback
- Dashboard - KPI summary (ARR, MRR, customers, growth, Rule of 40 score, profit margin)
Frequently asked
Is the SuperMetrics financial model free?+
Yes. The SuperMetrics model is a free Excel (.xlsx) download with live formulas. Sign up with your email and the workbook is yours to keep, review, and edit.
What's included in the model?+
A 5-year monthly forecast with P&L, cash flow and runway, valuation (exit multiple plus a DCF cross-check), MOIC/IRR returns, and unit economics, with live formulas throughout.
How was this model built?+
It was built from SuperMetrics's pitch deck and publicly available information, then structured to investment-banking standards as a fully editable Excel model.
Can I change the assumptions?+
Yes. You can change assumptions and the live formulas will recalculate in the downloadable Excel model.
Have more financial modelling questions? Contact us

Created by ex-finance professionals
Hey, I’m Alex and I created Finamodel.
Over my years in the finance industry I kept building the same models over and over again. Same structure, same assumptions, different logo. So I started building frameworks to turn them into clean, reusable templates.
Every model here is one I’d actually use for a client, and I personally vet each one before it goes up.
I’m not an expert in every industry, but I’ve built enough models to know what belongs in one. And when something is completely foreign to me, I reach out to my network for experts to work on our models with us.
Having a template library on hand cuts a first build from hours to minutes.
Need help finding your model? You’ll find me in the Finamodel app!
Other Enterprise/Security Startup Financial Models
Browse another startup in the same category.
AgBiome
AgBiome is a microbial-platform agtech company that discovers, develops, and commercialises biological crop protection products (and licences the platform across adjacent markets).

Alation
Enterprise data intelligence platform - data catalog, governance, and metadata management for large organisations.

Archer SPAC
Archera
Cloud resource automation platform that continuously optimizes AWS commitment purchases, de-risks overcommitment, and automates FinOps workflows.

Ardoq
Cloud-native Enterprise Architecture (EA) SaaS platform that helps large enterprises navigate digital transformation through automated data collection, graph-based architecture modelling, and change impact analysis.

Ascend
Ascend.io is an enterprise big data automation platform ("Enterprise Intelligence Platform") that abstracts away the complexity of big data engineering so non-experts can build and run data pipelines.

Athennian
Cloud-based legal entity management system (EMS) uniting entity data with workflow and document automation.

Auditboard
Cloud-based integrated risk management platform connecting audit, risk, compliance, and ESG teams across the enterprise.


