 Tracer Financial Model
Enterprise/Security Startup Financials (Free Excel Download)
Data intelligence platform combining SaaS tooling and consulting to help agencies, brands, and publishers unify and activate their marketing data.



professionals from Deloitte
Used by professionals from






About this model
Tracer combines data-intelligence software with consulting for agencies, brands, and publishers. The platform helps clients unify and activate marketing data, while the consulting component supports implementation and ongoing client success rather than standing apart from the product.
The business is a hybrid of SaaS and managed services, so its two revenue streams have different delivery margins and staffing requirements. Formed in 2018, Tracer established direct partnerships in 2019 and appointed its CEO in January 2020.
The model separates recurring software ARR cohorts from services projects and utilisation. It tracks new logos, pricing, expansion, churn, delivery costs, sales capacity, gross margin, and overhead, making the contribution of software scale versus people-led services explicit.
A turnkey financial model
Live formulas, no hardcoded values
Outputs are driven by live formulas, so the workbook updates from its assumptions instead of relying on hardcoded results.
All assumptions in one tab
Inputs are clearly marked in the Assumptions tab and separated from calculations, making it clear what to change and what to leave intact.
Statements always balancing
For integrated-statement models, the balance sheet, cash flow, and supporting schedules tie through properly.
Distinct schedules for clarity
Debt, working capital, taxes, and cash flow can get messy quickly. We group calculations in clear schedules, not across disconnected tabs.
No hidden macros or external links
There are no unexplained external workbook links or macros to undermine auditability or portability.
Changes flow through the model
Update a key driver and see the impact carry through the forecast, financing, and return outputs. We never use hardcoded numbers in formulas.
About Tracer
tracerco.com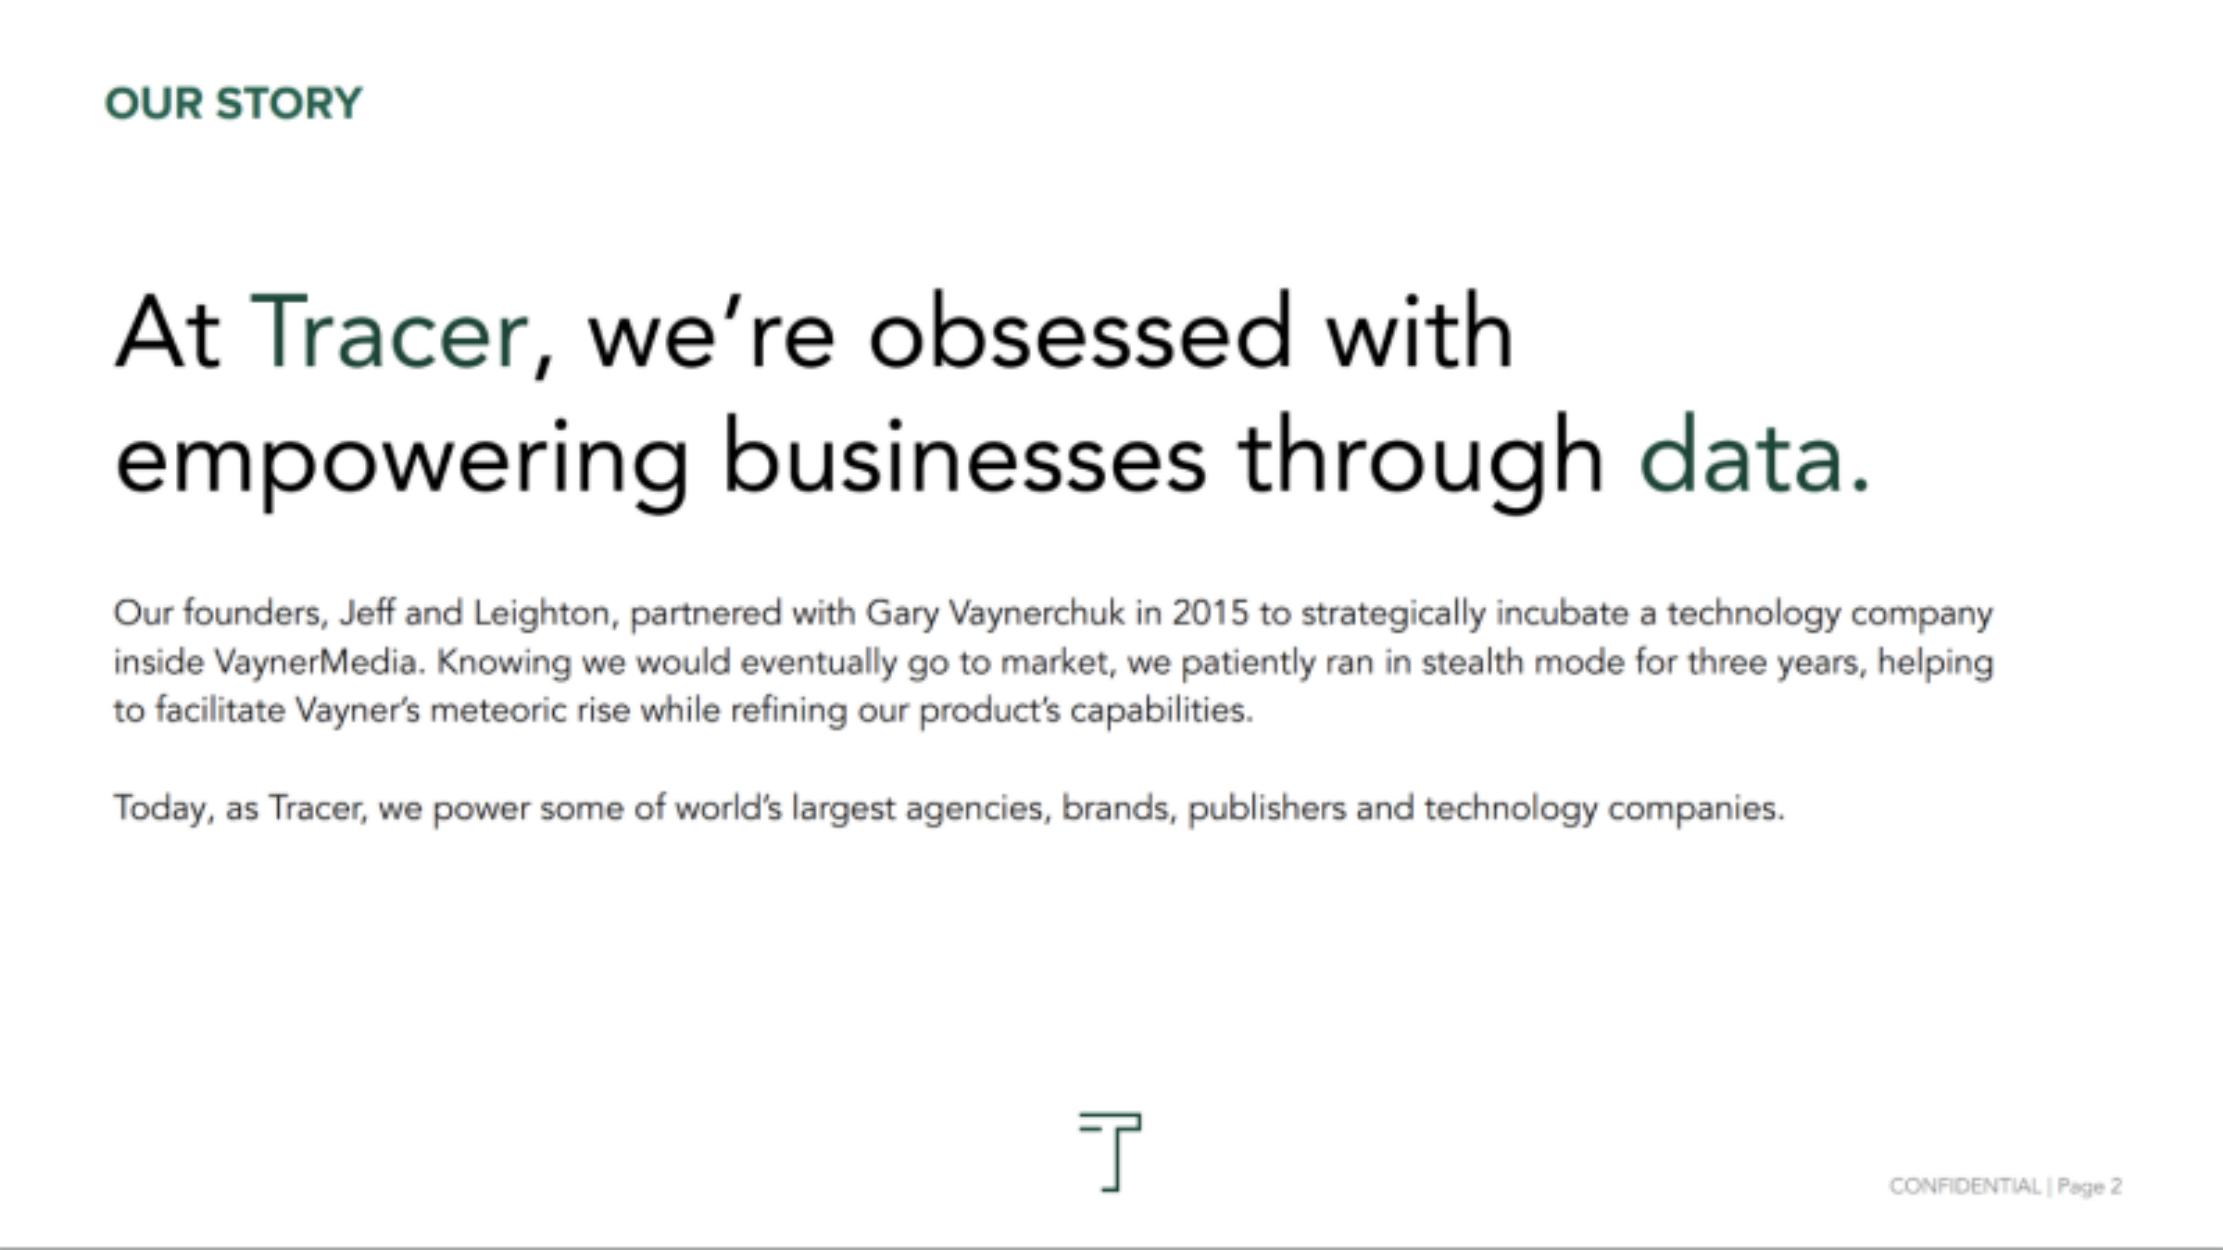
How to build a detailed financial model for Tracer
A complete walkthrough of the business, drivers, and assumptions behind the downloadable Tracer model - distilled from its pitch deck and publicly available information.
Product & value proposition
Tracer's platform is a browser-based data integration and reporting tool. Three layers:
- Connections - API integrations to dominant ad/data sources + custom ingestion (S3, email-based flat files).
- Context - Custom tagging and formula layers to organize data by market, product, and segment in the client's own language.
- Answers - Outputs compatible with existing BI/visualization stacks (plays with any tool).
Differentiator is the bundled consulting ("Client Success") arm alongside the platform - framed as "pilot + plane." Competitors offer one or the other. Three pillars: Product, Process, People.
Market
- Poor data quality costs the US economy up to $3.1 Trillion yearly (IBM cited).
- Worldwide spending on big data analytics will reach $274.3 Billion in 2022 (IDC cited).
- Over 150 Trillion gigabytes of data will need analysis by 2025 (Forbes cited).
- No SAM or SOM defined. No Tracer-specific addressable market sizing provided.
Revenue model
- Platform subscription (SaaS): browser-based platform license per client / seat.
- Managed services / consulting ("Client Success"): recurring engagement alongside the platform.
- Channels: direct sales to agencies, brands, publishers, and tech platforms. Both direct and indirect (via agency) client relationships.
- No pricing tiers, ACV, or contract lengths disclosed.
Traction & metrics
- $1 Billion in media spend tracked across the platform as of Jun 2019.
- 200+ direct and indirect client partners (agencies, publishers, brands, tech platforms).
- Named clients: VaynerMedia, Sanofi, Conde Nast.
- Named technology partners: LiveRamp, Roku, IAS.
- Named platform partners: Google, Amazon, Facebook.
- No revenue, ARR, growth rate, churn, or headcount figures disclosed.
Competition / moat
- Competitive landscape fragmented: companies specialize in data processing, business tagging, OR visualization - not all three.
- Primary named competitor (#1): implied to be Tableau or similar (presentation-layer focus, many small costs, 3rd-party implementation) - competitor not named explicitly.
- Moat: (a) full-stack offering (platform + consulting), (b) VaynerMedia origin gave three years of product refinement at scale without public competition, (c) platform partner relationships and advisory board seats.
Team & funding ask / use of funds
- Founders: Jeff Nicholson (Co-Founder, CEO - former Global Chief Media Officer at VaynerMedia) and Leighton (co-founder, last name not given).
- Backer: Gary Vaynerchuk / VaynerX portfolio.
- No funding ask, round size, valuation, or use-of-funds slide in deck.
Recommended financial model
- Archetype + why: Hybrid SaaS + Professional Services (managed services) model. Revenue splits into a recurring platform subscription line and a time/retainer-based consulting line. This matches Tracer's explicit "pilot + plane" positioning. A pure SaaS ARR model would misrepresent the consulting component's economics (lower margin, labor-driven, less scalable).
- Forecast horizon & granularity: 3 years monthly (Year 1–2) then quarterly (Year 3). Monthly granularity needed for client adds, churn, and headcount build-out in consulting.
- Key drivers & assumptions:
- New clients per month: start 2–4/month given 200 cumulative partners; ramp with sales hire plan.
- Average contract value (ACV) - platform: $60–120K/year for mid-market agency; no deck data.
- Average contract value - consulting: 50–75% of platform ACV as a separate managed-services retainer; no deck data.
- Gross margin - platform: 70–80% (SaaS norm; hosting + infra costs).
- Gross margin - consulting: 30–45% (labor-intensive; analyst headcount drives COGS).
- Client churn (logo): 8–12% annually; no deck data.
- Analysts per client ratio: 1 analyst per 5–8 clients; scales with headcount plan.
- Sales headcount growth: 1 AE per $500K–$1M ARR target; no deck data.
- Media spend tracked ($1B milestone as of mid-2019): informational only - not a direct revenue driver unless Tracer charges a % of spend (not indicated).
- Scenarios (Base / Bull / Bear - which variables flex):
- Bear: slow new client adds (1–2/month), high churn (15%), consulting margin compresses as headcount grows faster than revenue.
- Base: 3–4 new clients/month, 10% churn, consulting margin stabilizes at 35%.
- Bull: 6+ new clients/month, land-and-expand drives ACV uplift, churn below 8%, new enterprise logos accelerate.
- Required sheets / outputs:
- Assumptions - all drivers in one place with scenario toggle.
- Revenue build - platform ARR waterfall (opens, churns, expansions) + consulting retainer revenue separately.
- Headcount plan - analyst, sales, CS, G&A; drives opex and consulting COGS.
- P&L - blended gross margin, EBITDA.
- Cash flow / runway - burn rate and months of runway (critical for fundraising context).
- KPI dashboard - ARR, logo count, NRR, blended gross margin %, CAC payback.
Frequently asked
Is the Tracer financial model free?+
Yes. The Tracer model is a free Excel (.xlsx) download with live formulas. Sign up with your email and the workbook is yours to keep, review, and edit.
What's included in the model?+
A 5-year monthly forecast with P&L, cash flow and runway, valuation (exit multiple plus a DCF cross-check), MOIC/IRR returns, and unit economics, with live formulas throughout.
How was this model built?+
It was built from Tracer's pitch deck and publicly available information, then structured to investment-banking standards as a fully editable Excel model.
Can I change the assumptions?+
Yes. You can change assumptions and the live formulas will recalculate in the downloadable Excel model.
Have more financial modelling questions? Contact us

Created by ex-finance professionals
Hey, I’m Alex and I created Finamodel.
Over my years in the finance industry I kept building the same models over and over again. Same structure, same assumptions, different logo. So I started building frameworks to turn them into clean, reusable templates.
Every model here is one I’d actually use for a client, and I personally vet each one before it goes up.
I’m not an expert in every industry, but I’ve built enough models to know what belongs in one. And when something is completely foreign to me, I reach out to my network for experts to work on our models with us.
Having a template library on hand cuts a first build from hours to minutes.
Need help finding your model? You’ll find me in the Finamodel app!
Other Enterprise/Security Startup Financial Models
Browse another startup in the same category.
AgBiome
AgBiome is a microbial-platform agtech company that discovers, develops, and commercialises biological crop protection products (and licences the platform across adjacent markets).

Alation
Enterprise data intelligence platform - data catalog, governance, and metadata management for large organisations.

Archer SPAC
Archera
Cloud resource automation platform that continuously optimizes AWS commitment purchases, de-risks overcommitment, and automates FinOps workflows.

Ardoq
Cloud-native Enterprise Architecture (EA) SaaS platform that helps large enterprises navigate digital transformation through automated data collection, graph-based architecture modelling, and change impact analysis.

Ascend
Ascend.io is an enterprise big data automation platform ("Enterprise Intelligence Platform") that abstracts away the complexity of big data engineering so non-experts can build and run data pipelines.

Athennian
Cloud-based legal entity management system (EMS) uniting entity data with workflow and document automation.

Auditboard
Cloud-based integrated risk management platform connecting audit, risk, compliance, and ESG teams across the enterprise.


