 Vori Financial Model
Enterprise/Security Startup Financials (Free Excel Download)
Vertical SaaS back-office operating system for local and regional independent supermarket chains



professionals from Deloitte
Used by professionals from






About this model
Vori is a vertical SaaS back-office operating system for local and regional independent supermarket chains. Its product combines order management, inventory management, and analytics, helping grocers run core operations through one workflow rather than disconnected systems.
The company sells to independent grocers with active stores as the natural unit of scale. Its deck describes hundreds of active stores, paid customers, and thousands on a waitlist, while identifying roughly 30,000 US independent-grocer locations as the target market.
The model tracks new chains, active stores, subscription value, expansion, and churn. Onboarding and integrations are separate delivery assumptions, while sales capacity, gross margin, product costs, support, and overhead translate store adoption into ARR growth and cash runway.
A turnkey financial model
Live formulas, no hardcoded values
Outputs are driven by live formulas, so the workbook updates from its assumptions instead of relying on hardcoded results.
All assumptions in one tab
Inputs are clearly marked in the Assumptions tab and separated from calculations, making it clear what to change and what to leave intact.
Statements always balancing
For integrated-statement models, the balance sheet, cash flow, and supporting schedules tie through properly.
Distinct schedules for clarity
Debt, working capital, taxes, and cash flow can get messy quickly. We group calculations in clear schedules, not across disconnected tabs.
No hidden macros or external links
There are no unexplained external workbook links or macros to undermine auditability or portability.
Changes flow through the model
Update a key driver and see the impact carry through the forecast, financing, and return outputs. We never use hardcoded numbers in formulas.
About Vori
vori.com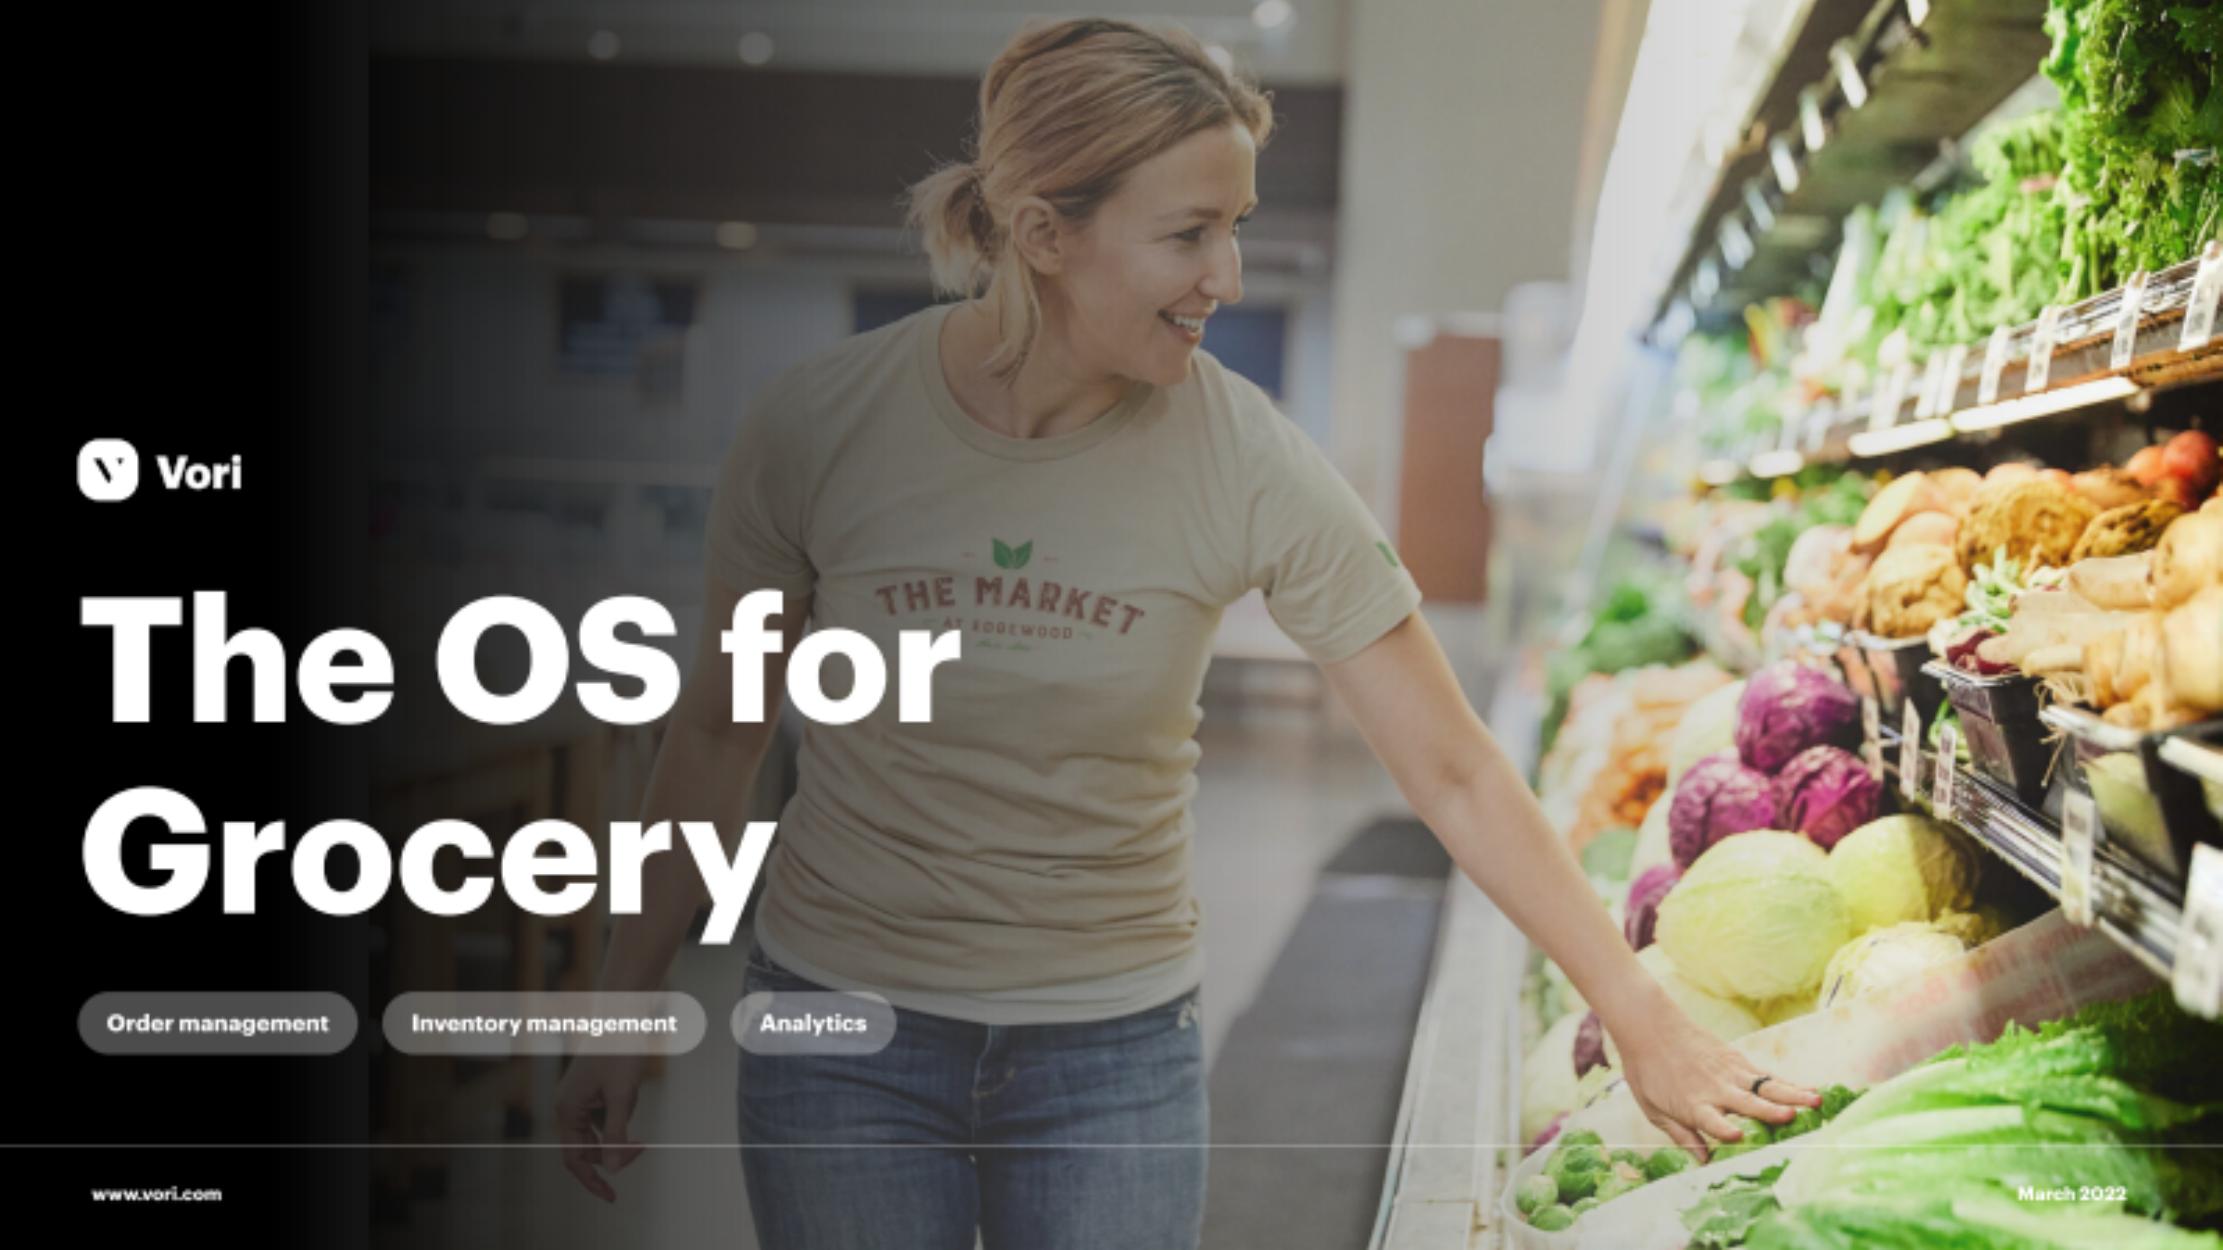
How to build a detailed financial model for Vori
A complete walkthrough of the business, drivers, and assumptions behind the downloadable Vori model - distilled from its pitch deck and publicly available information.
Product & value proposition
- All-in-one grocery back office replacing pencil-and-paper and legacy point solutions
- Three modules: Order management (LIVE as of Spring 2022), Inventory management (Q2 2022 launch), Analytics (Q2 2022 launch)
- Mobile-first app; "Smart Orders" feature suggests ML-driven order suggestions based on historical ordering patterns
- Supplier platform and auto-price updates are differentiating features vs. legacy competitors
- Solves four stated pain points: labor costs on low-margin business, pricing errors (selling below cost), out-of-stocks / food waste from lack of supply chain data, and ineffective legacy software
Market
- Global Grocery Stores total spend: $11.7T
- U.S. All Grocery Stores total spend: $765B
- U.S. Independent Supermarkets total spend (TAM proxy): $250B
- 30,000 independent grocer locations across USA
- 33% of U.S. grocery market share
- Independents grew market share 25%–33% in the last decade; described as "fastest growing sub-category of brick & mortar supermarkets"
- No explicit SaaS software TAM or SAM (e.g., $X per store × 30,000 stores) stated in deck
- Grocers described as "already paying billions for software a year" - no specific software spend figure given
Revenue model
- No per-store pricing, per-seat pricing, or ARPU figures disclosed
- Supplier platform module (slide 12) hints at potential marketplace/take-rate revenue stream (supplier-side fees), but not stated
- Direct sales implied (no channel partner or reseller mention)
Traction & metrics
- "Hundreds of active stores"
- 57% Q/Q growth in active stores
- Growth trend visible from Jan 2020 → Jan 2022 on combo bar/line chart; both active stores (line) and order count (bars) show consistent upward trajectory
- "Dozens of paid customers" with deep integration
- "Thousands of stores on the waiting list"
- Named customer: Berkeley Bowl Marketplace (Director of IT testimonial)
- No ARR, MRR, churn, NRR, or revenue figures disclosed
Competition / moat
- Competing against legacy systems (names blurred in slide 12 image) - 4 unnamed competitors shown
- Vori is the only player with all 6 features checked: Grocery Inventory Mgmt, Order Management, Supplier Platform, Auto-Price Updates, Custom Analytics, Ease of Use
- Key differentiation: Supplier Platform and Auto-Price Updates are unique to Vori among the 5 players shown
- COVID tailwinds cited as urgency drivers: labor shortages, supply chain crisis, COGS inflation, Amazon/Whole Foods competitive pressure
- Moat narrative: CEO's parents have 40 years of grocery experience - domain expertise embedded in product
Team & funding ask / use of funds
- Team: CEO has family background with 40 years of grocery experience; no other team members named or credentialed in deck
Recommended financial model
- Archetype + why: Vertical SaaS ARR model. Revenue is subscription-based per-store (implied). The natural unit is active stores × monthly subscription fee. A 3-statement model is not warranted at this stage given no disclosed financials - a SaaS KPI model (ARR bridge, cohort-based store adds, LTV/CAC once data exists) is the right archetype.
- Forecast horizon & granularity: 3 years (2022–2024), monthly granularity for Year 1, quarterly thereafter. Deck is Spring 2022 so model starts from that base.
- Key drivers & assumptions:
- Active stores (starting point): ~"hundreds" → model as 200
- Q/Q store growth rate: 57% Q/Q; assume this decelerates as base grows - model 40% Q/Q in 2022, tapering to 20% Q/Q by end of 2023, ~10% Q/Q by 2024
- Gross margin: 70–75% typical for vertical SaaS at seed/early Series A; model at 70%
- Inventory mgmt + analytics launch: Q2 2022; assume ARPU step-up of ~30% post-launch as upsell modules attach
- Waitlist conversion: "Thousands on waitlist"; model 5–10% waitlist-to-paid conversion per quarter
- Churn: 1–2% monthly (sticky back-office software; high switching cost once integrated with POS); model at 1.5%/month
- Scenarios (Base / Bull / Bear - which variables flex):
- Bull: Q/Q store adds stay at 40%+ through 2023; ARPU reaches $600 post module launch; churn at 1%/month
- Base: Decelerating store growth as above; ARPU $400 rising to $520 on upsell; churn 1.5%/month
- Bear: Store growth slows to 10% Q/Q by mid-2023 (sales capacity constrained); ARPU stays flat at $350; churn at 2.5%/month (inventory module launch delayed)
- Required sheets / outputs:
- Assumptions - all toggleable drivers
- Store Cohort Model - monthly store adds by cohort, active store count, churn waterfall
- ARR Bridge - new ARR, expansion ARR (module upsell), churned ARR, net new ARR, ending ARR
- P&L - Revenue, COGS, Gross Profit, S&M, R&D, G&A, EBITDA
- Unit Economics - LTV (ARPU × gross margin / monthly churn), CAC (once spend data available), LTV/CAC ratio, payback period
- Dashboard - ARR, active stores, MRR, Q/Q growth, gross margin, burn/runway (if funding data known)
Frequently asked
Is the Vori financial model free?+
Yes. The Vori model is a free Excel (.xlsx) download with live formulas. Sign up with your email and the workbook is yours to keep, review, and edit.
What's included in the model?+
A 5-year monthly forecast with P&L, cash flow and runway, valuation (exit multiple plus a DCF cross-check), MOIC/IRR returns, and unit economics, with live formulas throughout.
How was this model built?+
It was built from Vori's pitch deck and publicly available information, then structured to investment-banking standards as a fully editable Excel model.
Can I change the assumptions?+
Yes. You can change assumptions and the live formulas will recalculate in the downloadable Excel model.
Have more financial modelling questions? Contact us

Created by ex-finance professionals
Hey, I’m Alex and I created Finamodel.
Over my years in the finance industry I kept building the same models over and over again. Same structure, same assumptions, different logo. So I started building frameworks to turn them into clean, reusable templates.
Every model here is one I’d actually use for a client, and I personally vet each one before it goes up.
I’m not an expert in every industry, but I’ve built enough models to know what belongs in one. And when something is completely foreign to me, I reach out to my network for experts to work on our models with us.
Having a template library on hand cuts a first build from hours to minutes.
Need help finding your model? You’ll find me in the Finamodel app!
Other Enterprise/Security Startup Financial Models
Browse another startup in the same category.
AgBiome
AgBiome is a microbial-platform agtech company that discovers, develops, and commercialises biological crop protection products (and licences the platform across adjacent markets).

Alation
Enterprise data intelligence platform - data catalog, governance, and metadata management for large organisations.

Archer SPAC
Archera
Cloud resource automation platform that continuously optimizes AWS commitment purchases, de-risks overcommitment, and automates FinOps workflows.

Ardoq
Cloud-native Enterprise Architecture (EA) SaaS platform that helps large enterprises navigate digital transformation through automated data collection, graph-based architecture modelling, and change impact analysis.

Ascend
Ascend.io is an enterprise big data automation platform ("Enterprise Intelligence Platform") that abstracts away the complexity of big data engineering so non-experts can build and run data pipelines.

Athennian
Cloud-based legal entity management system (EMS) uniting entity data with workflow and document automation.

Auditboard
Cloud-based integrated risk management platform connecting audit, risk, compliance, and ESG teams across the enterprise.


