
Break-Even Analysis in Excel
Key Takeaways
- Contribution margin drives everything. Break-even units = Fixed Costs / Contribution Margin per Unit. Get the fixed/variable cost split right first - the formula itself is trivial.
- Report both units and revenue. They're the same answer in two units; use whichever matches how the business tracks sales.
- Margin of safety translates break-even into risk. "We can absorb a 23% sales miss" lands better with stakeholders than a bare break-even unit count.
- Operating leverage explains why profit swings hard near break-even. High fixed costs relative to variable costs mean small volume changes move operating income disproportionately.
- Never present a single-point break-even. Build a two-way sensitivity table on price and variable cost using a native Excel Data Table, not hardcoded cells, so it stays live as assumptions change.
- Watch for step-fixed and semi-variable costs. These are the most common source of a break-even number that looks precise but is quietly wrong.
For the cost-classification and modelling pitfalls that show up across every model type, not just break-even, see our guide to common financial modelling mistakes. To build a full break-even model with a live sensitivity grid and dashboard, use our break-even analysis template, or try the break-even calculator for a quick one-off answer.
Break-even analysis answers the single most practical question in a business plan: how much do we need to sell before we stop losing money? By splitting costs into fixed and variable components, calculating contribution margin, and solving for the volume (or revenue) where the two lines cross, you get a break-even point - the foundation for pricing decisions, margin-of-safety reporting, and target-profit planning. This guide covers the formulas, a fully worked example, a two-way sensitivity table, and the Excel mechanics to build it yourself.
Break-even analysis is deceptively simple - one formula, two inputs - but it underpins some of the highest-stakes decisions a business makes: whether a new product can be priced profitably, how much runway a cost cut buys, and how exposed the plan is if volume comes in soft. Because it's fast to build and easy to explain, it's usually the first model built for a new product line, a pricing change, or a cost-cutting initiative, before anyone commits to a full 3-statement forecast.
The catch is that break-even analysis is only as good as the fixed/variable cost split behind it. Lump a cost into the wrong bucket - treat a cost that actually jumps in steps as if it were purely fixed, for instance - and the break-even point quietly becomes wrong in a way that's easy to miss until volume gets there.
The Break-Even Framework: From Cost Structure to Margin of Safety
Fixed Costs vs. Variable Costs
Every break-even model starts with a clean split of costs into two buckets:
- Fixed costs don't change with sales volume over the relevant range - rent, salaried wages, insurance, equipment leases, software subscriptions. You pay them whether you sell one unit or one thousand.
- Variable costs scale directly with each unit sold - raw materials, packaging, per-unit shipping, sales commissions, payment processing fees.
The split looks different by business type, which is why a generic template only gets you so far:
| Business Type | Typical Fixed Costs | Typical Variable Costs |
|---|---|---|
| Retail / DTC | Rent, salaried staff, POS software | COGS, packaging, payment processing fees |
| Manufacturing | Factory lease, equipment depreciation, plant supervisors | Raw materials, direct labor, per-unit freight |
| SaaS | Engineering salaries, office lease, core infrastructure | Hosting/compute per active user, payment processing, customer success staffing tied to seat count |
| Professional Services | Office lease, salaried consultants, insurance | Contractor day rates, travel billed per engagement |
Some costs are semi-variable (a utility bill with a base charge plus usage, or hourly staff who get scheduled in blocks as volume rises) and need to be split into their fixed and variable components before they go into the model. Getting this split right matters more than any formula that follows - a break-even model is only as accurate as its cost classification.
The Break-Even Formulas
Contribution Margin
Contribution margin is what's left from each sale after variable costs - the amount that goes toward covering fixed costs and, beyond that, profit.
Contribution Margin per Unit = Price per Unit - Variable Cost per Unit
Contribution Margin Ratio = Contribution Margin per Unit / Price per Unit
Break-Even Point
Break-Even Units = Fixed Costs / Contribution Margin per Unit
Break-Even Revenue = Fixed Costs / Contribution Margin Ratio
Both formulas describe the same point - break-even revenue always equals break-even units multiplied by the selling price. Use whichever unit (volume or dollars) matches how the business tracks performance.
// Contribution margin per unit
= Price_Per_Unit - Variable_Cost_Per_Unit

// Contribution margin ratio
= Contribution_Margin_Per_Unit / Price_Per_Unit

// Break-even units (round up - you can't sell a fraction of a unit)
= ROUNDUP(Fixed_Costs / Contribution_Margin_Per_Unit, 0)

// Break-even revenue
= Fixed_Costs / Contribution_Margin_Ratio
Worked Example
A boutique coffee roastery sells bags of coffee at $18 each. Variable cost per bag (beans, packaging, freight) is $7. Monthly fixed costs (rent, roaster lease, two salaried staff) are $8,500.
| Assumption | Value |
|---|---|
| Price per Bag | $18.00 |
| Variable Cost per Bag | $7.00 |
| Contribution Margin per Bag | $11.00 |
| Contribution Margin Ratio | 61.1% |
| Monthly Fixed Costs | $8,500 |
Break-even units:
Break-Even Units = $8,500 / $11.00 = 772.7 -> 773 bags
Break-even revenue:
Break-Even Revenue = $8,500 / 61.1% = $13,909
Check: 773 bags x $18 = $13,914 (the small gap is from rounding 772.7 bags up to a whole bag).
Margin of Safety
If the roastery is actually selling 1,000 bags a month:
| Metric | Value |
|---|---|
| Actual Sales (units) | 1,000 bags |
| Break-Even Sales (units) | 772.7 bags |
| Margin of Safety (units) | 227.3 bags |
| Margin of Safety (%) | 22.7% |
Margin of Safety % = (Actual Units - Break-Even Units) / Actual Units
= (1,000 - 772.7) / 1,000 = 22.7%
Sales could drop 22.7% before the roastery starts losing money - a useful, non-technical way to communicate downside risk.
Charting the Break-Even Point
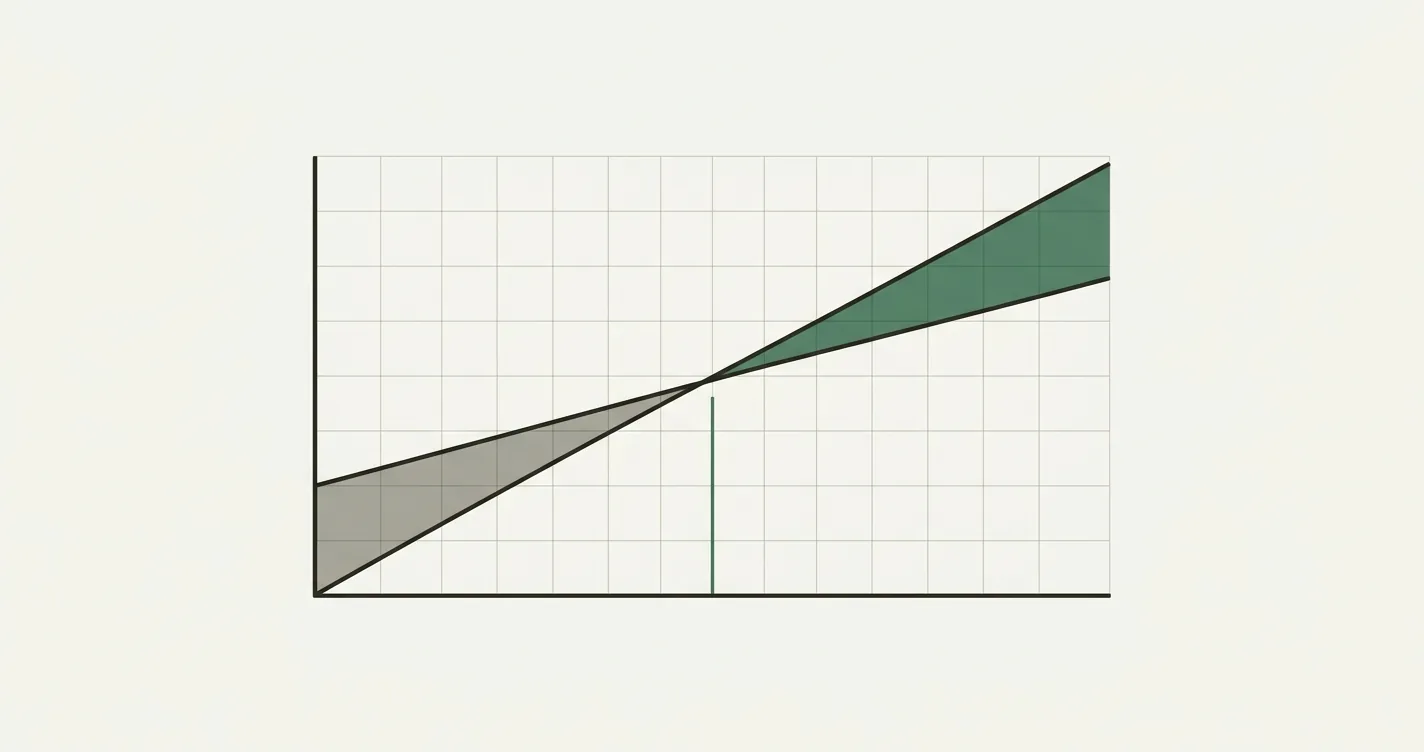
The classic break-even chart plots two lines against unit volume: Total Cost (Fixed Costs + Variable Cost per Unit x Units) and Total Revenue (Price per Unit x Units). Where they cross is the break-even point - below it, Total Cost sits above Total Revenue (a loss); above it, Total Revenue pulls ahead (a profit).
| Units Sold | Total Cost | Total Revenue | Profit / (Loss) |
|---|---|---|---|
| 0 | $8,500 | $0 | ($8,500) |
| 500 | $12,000 | $9,000 | ($3,000) |
| 773 (break-even) | $13,911 | $13,914 | ~$0 |
| 1,000 | $15,500 | $18,000 | $2,500 |
| 1,500 | $19,000 | $27,000 | $8,000 |
Notice the profit at 1,000 units ($2,500) matches the operating income figure used below in the operating leverage calculation - the chart and the formulas are two views of the same model, and they should always tie.
To build this in Excel: lay out a unit-volume column from 0 to a round number above your expected range (e.g., 0 to 1,500 in steps of 100), compute Total Cost and Total Revenue for each row, then insert a 2-D line chart. Add data labels or a vertical marker line at the break-even unit count, and consider shading the area between the lines red below break-even and green above it so the crossover reads at a glance without the viewer needing to trace the axis.
Target-Profit Volume
Break-even analysis extends naturally to a target-profit question: how many bags does the roastery need to sell to hit $5,000 in monthly operating profit, not just $0?
Target Units = (Fixed Costs + Target Profit) / Contribution Margin per Unit
= ($8,500 + $5,000) / $11.00 = 1,227.3 -> 1,228 bags
= ROUNDUP((Fixed_Costs + Target_Profit) / Contribution_Margin_Per_Unit, 0)
Operating Leverage
Because fixed costs don't move with volume, profit grows faster than revenue once you're past break-even - and shrinks faster too. The Degree of Operating Leverage (DOL) measures that sensitivity:
DOL = Total Contribution Margin / Operating Income
At 1,000 bags/month, the roastery's DOL is:
| Metric | Value |
|---|---|
| Total Contribution Margin (1,000 x $11) | $11,000 |
| Operating Income ($11,000 - $8,500) | $2,500 |
| DOL | 4.4x |
A DOL of 4.4x means a 10% increase in sales volume produces roughly a 44% increase in operating income. Check it: 1,100 bags gives $12,100 contribution margin, $3,600 operating income - a $1,100 increase on a $2,500 base is 44%. The same leverage cuts the other way on a sales miss, which is why businesses sitting close to their break-even point see the most volatile profit swings.
= Total_Contribution_Margin / Operating_Income
Multi-Product Break-Even
Most businesses sell more than one product, and each product usually has a different contribution margin. Suppose the roastery actually sells three products, in this unit mix:
| Product | Price | Variable Cost | Contribution Margin | Sales Mix (% of units) |
|---|---|---|---|---|
| Coffee Bags | $18.00 | $7.00 | $11.00 | 60% |
| Cold Brew Bottles | $6.00 | $2.50 | $3.50 | 25% |
| Branded Mugs | $15.00 | $6.00 | $9.00 | 15% |
The break-even point now needs a weighted-average contribution margin - each product's contribution margin weighted by its share of total units sold:
Weighted Avg. Contribution Margin = (60% x $11.00) + (25% x $3.50) + (15% x $9.00)
= $6.60 + $0.875 + $1.35 = $8.825
Total Break-Even Units = $8,500 / $8.825 = 963.2 -> 964 units
Allocated back across the mix, that's 578 coffee bags, 241 cold brew bottles, and 145 mugs (964 total units at the 60/25/15 split).
// Weighted average contribution margin
= SUMPRODUCT(Sales_Mix_Range, Contribution_Margin_Range)

// Total break-even units
= ROUNDUP(Fixed_Costs / Weighted_Avg_Contribution_Margin, 0)
The blind spot in this method: it assumes the sales mix stays constant as volume changes. If cheaper, lower-margin items (cold brew, mugs) sell disproportionately more as volume grows, the true break-even point shifts higher than the weighted-average formula suggests. When presenting a multi-product break-even, flag the mix assumption explicitly - it's doing as much work as the contribution margins themselves.
Two-Way Sensitivity: Price vs. Variable Cost
A single break-even number hides how sensitive it is to two of the most negotiable inputs in the model: price and variable cost per unit. Building a two-way sensitivity table - price across the top, variable cost down the side - shows the full range at a glance.
Break-Even Units by Price and Variable Cost ($8,500 Fixed Costs)
| Variable Cost \ Price | $16 | $17 | $18 | $19 | $20 |
|---|---|---|---|---|---|
| $5 | 773 | 709 | 654 | 608 | 567 |
| $6 | 850 | 773 | 709 | 654 | 608 |
| $7 | 945 | 850 | 773 | 709 | 654 |
| $8 | 1,063 | 945 | 850 | 773 | 709 |
| $9 | 1,215 | 1,063 | 945 | 850 | 773 |
The base case ($18 price, $7 variable cost) is bolded at 773 units. Notice the diagonal pattern: every cell with the same $11 spread between price and variable cost returns the same break-even units, because break-even only cares about the contribution margin - not the price and cost individually. That's a useful sanity check when auditing a break-even model: if two very different price/cost combinations should produce the same answer and don't, something's wired incorrectly.
In Excel, build this with a native two-variable Data Table (Data tab > What-If Analysis > Data Table), with price as the row input and variable cost as the column input, feeding a single break-even-units formula cell - not 25 separate hardcoded formulas. That way the table stays live if fixed costs change. For more on building these (and one-variable tables, Goal Seek, and scenario toggles), see our guide to sensitivity analysis in Excel.
Common Mistakes to Avoid
- Misclassifying step-fixed costs. Some "fixed" costs only stay fixed within a range - a second oven or an extra staff shift kicks in once volume crosses a threshold. Treating these as purely fixed understates the true break-even point at higher volumes.
- Ignoring semi-variable costs. Utilities, hourly labor with overtime, and tiered software pricing all have a fixed base plus a variable component. Lumping the whole bill into one bucket skews the contribution margin.
- Using a single variable cost when it actually changes with volume. Bulk material discounts or shipping-rate breaks mean variable cost per unit can fall as volume rises - a static per-unit cost overstates break-even at scale.
- Confusing break-even (zero operating income) with the actual profit target. Break-even is the floor, not the goal. Always pair it with a target-profit volume so the number in front of the sales team is the one that actually matters.
- Presenting a single point estimate. Price and variable cost are rarely locked in when the model is built. A break-even number without a sensitivity table around it invites false confidence.
- Forgetting that break-even is calculated on operating income, not net income. Interest and taxes sit below the break-even calculation. A business can be "at break-even" operationally and still show a net loss after financing costs.

Alex Tapio
Founder of Finamodel • Professional Financial Modeller • Ex-Deloitte







