Cash-on-Cash Return: Formula and Example

Key Takeaways
- Cash-on-cash return = annual pre-tax cash flow / total cash invested - a levered, single-period return on your actual equity, not the purchase price.
- It's also called the equity dividend rate - the same formula under a different name, common in institutional real estate underwriting.
- Leverage cuts both ways. When the cap rate exceeds the mortgage constant, financing lifts your cash-on-cash return above the all-cash figure (positive leverage); when the mortgage constant is higher, financing drags it down (negative leverage).
- Year one is rarely the full story. Value-add and lease-up deals typically show cash-on-cash climbing meaningfully as NOI stabilizes - always specify which year you're quoting.
- Cash-on-cash and IRR measure different things. Cash-on-cash tracks annual operating cash flow only; IRR captures the full hold period, including loan paydown and sale proceeds - which is why IRR is almost always higher over a multi-year hold with any appreciation at all.
- Always check the denominator. The single most common way this metric gets misquoted is using purchase price or loan amount instead of total cash actually invested.
For the unlevered comparison this metric is measured against, see our guide to cap rate. To build the full income statement a cash-on-cash calculation is pulled from, start with a real estate pro forma. And when you're ready to model a multi-year hold and exit, our guide to the real estate IRR waterfall picks up exactly where this one leaves off.
Cash-on-cash return measures the pre-tax cash flow an income property hands back to you each year against the actual cash you put in - down payment, closing costs, and any upfront reserves - not the full purchase price. Because it isolates the yield on your equity check after debt service, it's the single number most real estate investors watch first when a deal is financed. This guide covers the formula, how leverage moves it up or down, a fully worked apartment-building example, and where cash-on-cash breaks down against IRR.
Cash-on-cash return (also called the equity dividend rate) answers a narrow but important question: for every dollar you actually wired at closing, how many cents come back to you in cash this year? It says nothing about appreciation, loan paydown, or what happens when you sell - that's the tradeoff for being simple, current, and easy to compare across deals.
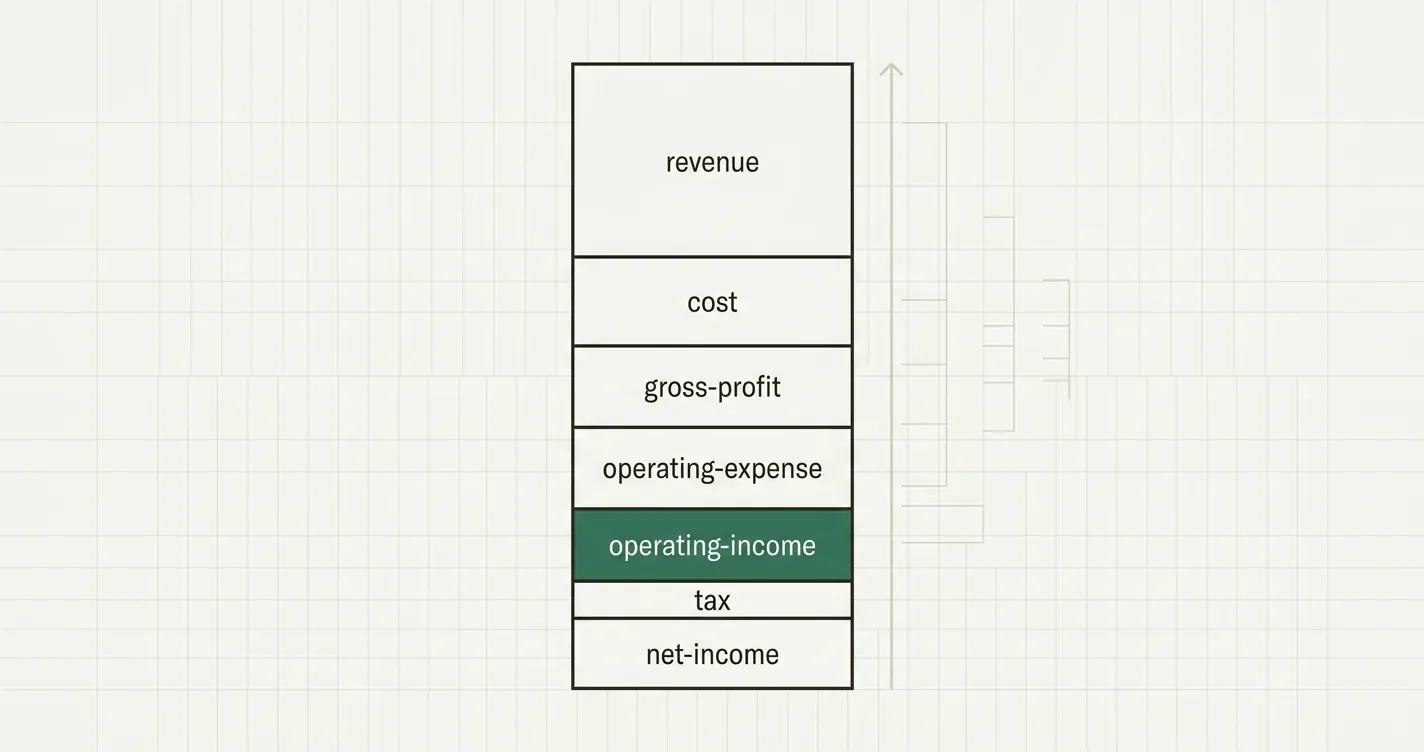
Cash-on-Cash Return: from NOI to a levered yield on the cash you actually put in
What Is Cash-on-Cash Return?
Cash-on-cash (CoC) return is the ratio of a property's annual pre-tax cash flow to the total cash invested to acquire it:
Cash-on-Cash Return = Annual Pre-Tax Cash Flow / Total Cash Invested
Annual pre-tax cash flow is what's left of net operating income (NOI) after paying debt service - the actual cash that hits your bank account. Total cash invested is every dollar you put in out of pocket: down payment, closing costs, loan fees, and any initial capital reserve or renovation budget funded at closing. It is not the purchase price, and it is not your loan amount.
// Annual Pre-Tax Cash Flow
= NOI - Annual_Debt_Service

// Total Cash Invested
= Down_Payment + Closing_Costs + Upfront_Reserves

// Cash-on-Cash Return
= Annual_Pre_Tax_Cash_Flow / Total_Cash_Invested
Because the denominator is only your equity, not the deal's total value, CoC is inherently a levered metric. Buy the same building two ways - one with a mortgage, one with all cash - and you'll get two different cash-on-cash numbers from the identical property.
Cash-on-Cash Return vs. Cap Rate
It's easy to conflate cash-on-cash with cap rate, but they answer different questions. Cap rate divides NOI by the property's value or purchase price - it ignores financing entirely, which is what makes it useful for comparing properties regardless of how any given buyer funds the deal. Cash-on-cash divides levered cash flow by your equity - it's specific to your financing and your deal.
| Cap Rate | Cash-on-Cash Return | |
|---|---|---|
| Numerator | NOI | NOI minus debt service |
| Denominator | Purchase price / value | Cash actually invested |
| Financing | Ignored | Central to the number |
| Answers | "What does the asset yield unlevered?" | "What does my equity yield after debt?" |
A property can have an attractive cap rate and a mediocre cash-on-cash return, or vice versa, depending entirely on the loan terms layered on top.
All-Cash vs. Financed: How Leverage Changes the Math
Whether leverage helps or hurts your cash-on-cash return comes down to one comparison: the cap rate versus the mortgage constant (the loan's all-in annual debt service divided by the loan balance - principal and interest together, not just the interest rate).
// Mortgage Constant
= Annual_Debt_Service / Loan_Amount
- If the cap rate is higher than the mortgage constant, borrowing is accretive - each dollar of debt earns more than it costs, and leverage pushes your cash-on-cash return above the unlevered (all-cash) return. This is called positive leverage.
- If the mortgage constant is higher than the cap rate, leverage is dilutive: debt costs more than the asset yields, and your financed cash-on-cash return will sit below what an all-cash buyer would earn. This is negative leverage.
This is why the same building can look great or mediocre on a cash-on-cash basis purely because of when it was financed and at what rate - the property didn't change, the debt did.
Worked Example: Underwriting a 24-Unit Apartment Building
Assume you're underwriting a 24-unit apartment building using our real estate development model:
| Assumption | Value |
|---|---|
| Purchase price | $3,000,000 |
| Year 1 NOI | $216,000 |
| Going-in cap rate | 7.20% |
| Loan-to-value (LTV) | 65% |
| Loan amount | $1,950,000 |
| Interest rate | 5.5%, 30-year amortization |
| Closing costs | $45,000 |
Step 1: Total cash invested.
Down Payment = $3,000,000 - $1,950,000 = $1,050,000
Total Cash Invested = $1,050,000 + $45,000 = $1,095,000
Step 2: Annual debt service. A $1,950,000 loan at 5.5% over 30 years amortizes to a monthly payment of $11,072, or $132,863 a year (via the Excel PMT function):
= -PMT(5.5%/12, 30*12, 1950000) * 12
// = 132,863
Step 3: Levered cash flow and cash-on-cash return.
Levered Pre-Tax Cash Flow = $216,000 - $132,863 = $83,137
Cash-on-Cash Return = $83,137 / $1,095,000 = 7.59%
Step 4: Compare to the all-cash scenario. Had you paid all cash (no loan, cash invested = purchase price plus closing costs), your return would simply be the unlevered yield on total capital:
All-Cash Cash-on-Cash = $216,000 / ($3,000,000 + $45,000) = 7.09%
| Scenario | Cash Invested | Year 1 Cash Flow | Cash-on-Cash Return |
|---|---|---|---|
| All-cash | $3,045,000 | $216,000 | 7.09% |
| Financed (65% LTV, 5.5%) | $1,095,000 | $83,137 | 7.59% |
The mortgage constant here is 6.81% ($132,863 / $1,950,000), below the 7.2% going-in cap rate - so this loan is accretive. Financing this deal boosts your return from 7.09% to 7.59% even though your dollar profit is much smaller in absolute terms, because you're earning it on a much smaller equity base. That's positive leverage in action.
Year One vs. Stabilized Cash-on-Cash Return
Year-one cash-on-cash is a snapshot, not a forecast. Most value-add and lease-up deals show a lower return in year one - while rents are still being pushed to market or units are still turning over - and a materially higher return once the property stabilizes. Reporting only the year-one figure (or only the stabilized figure) without labeling it clearly is one of the most common ways underwriting gets misread.
Continuing the example, with NOI growing 3% a year and debt service fixed by the amortizing loan:
| Year | NOI | Annual Debt Service | Levered Cash Flow | Cash-on-Cash Return |
|---|---|---|---|---|
| 1 | $216,000 | $132,863 | $83,137 | 7.59% |
| 2 | $222,480 | $132,863 | $89,617 | 8.18% |
| 3 | $229,154 | $132,863 | $96,292 | 8.79% |
| 4 | $236,029 | $132,863 | $103,166 | 9.42% |
| 5 | $243,110 | $132,863 | $110,247 | 10.07% |
Because debt service on a fixed-rate amortizing loan doesn't move with rent growth, every dollar of NOI growth flows straight through to levered cash flow - which is why cash-on-cash climbs from 7.59% in year one to over 10% by year five, well before accounting for any gain on sale.
Cash-on-Cash Return vs. IRR: What CoC Misses
Cash-on-cash is a single-period metric - it tells you what one year returns, not what the whole investment returns. It ignores two things that often make up the bulk of a real estate investor's profit: appreciation (or cap rate movement) at sale, and the equity you build through loan paydown. IRR captures both, because it's computed across every cash flow in the hold period, including the sale.
Extend the example to a 5-year hold. Sell at the end of year 5 at a 7.0% exit cap rate on forward (year 6) NOI, after 2% selling costs, and after paying off the remaining loan balance:
Forward (Year 6) NOI = $243,110 x 1.03 = $250,403
Sale Price = $250,403 / 7.0% = $3,577,189
Selling Costs (2%) = $71,544
Remaining Loan Balance (after 60 monthly payments) = $1,802,982
Net Sale Proceeds = $3,577,189 - $71,544 - $1,802,982 = $1,702,663
| Year | Cash Flow |
|---|---|
| 0 (initial investment) | ($1,095,000) |
| 1 | $83,137 |
| 2 | $89,617 |
| 3 | $96,292 |
| 4 | $103,166 |
| 5 (operating cash flow + net sale proceeds) | $1,812,910 |
Solving for the discount rate that sets the net present value of these cash flows to zero gives an IRR of 16.6% - well above the 8.81% average cash-on-cash return across the same five years. The gap is entirely appreciation and amortization: a 20-basis-point exit cap rate improvement plus five years of principal paydown hand you roughly $1.7M at sale on top of the operating cash flow, and none of that shows up in any single year's cash-on-cash number.
Use the calculator above to test your own hold period, exit cap rate, and loan paydown assumptions - it's the fastest way to see how sensitive the IRR is to your exit assumptions compared to the much steadier cash-on-cash figure.
Common Mistakes When Calculating Cash-on-Cash Return
- Confusing it with cap rate. Cap rate is unlevered and financing-agnostic; cash-on-cash is levered and specific to your loan. Quoting one when you mean the other misrepresents the deal.
- Using purchase price instead of cash invested. The denominator is what you actually wired at closing - down payment, closing costs, and reserves - not the property's price or the loan amount.
- Forgetting closing costs and upfront reserves. Omitting them overstates the return, sometimes by a full percentage point or more on a smaller deal.
- Quoting only the year-one number. A lease-up or value-add deal's year-one cash-on-cash can look weak next to a stabilized deal's, even though the underlying property is stronger once rents are pushed to market. Always label which year you're quoting.
- Treating it as a total-return metric. Cash-on-cash captures operating cash flow only. It says nothing about the equity built through loan amortization or gained through appreciation - both of which IRR and equity multiple pick up.
- Ignoring the mortgage constant. A cash-on-cash return that looks great can quietly be negative leverage if you haven't checked whether the mortgage constant sits above or below the cap rate.

Alex Tapio
Founder of Finamodel • Professional Financial Modeller • Ex-Deloitte