How to Underwrite a Multifamily Acquisition

Key Takeaways
- Underwriting is a chain, not a single number. Rent roll feeds EGI, EGI feeds NOI, NOI feeds both the cap rate check and the DSCR test, and NOI plus the value-add plan feeds the exit returns. An error early in the chain compounds through every step after it.
- Rebuild NOI from the actual rent roll, not the broker's pro forma - the gap between in-place and "pro forma" NOI is usually where the optimism lives.
- DSCR is the real constraint for financed deals. A property can look attractive on cap rate alone and still fail to qualify for the loan size you need if NOI does not clear the lender's DSCR minimum.
- The value-add plan is the thesis, not a footnote. Model the renovation capex, the realistic rent premium, and the multi-year ramp explicitly - a widening DSCR cushion over the hold is often more persuasive underwriting evidence than the exit IRR alone.
- Exit cap rate assumptions deserve the most scrutiny. Cap rate compression is not guaranteed; always stress-test the exit at a flat or wider cap before trusting the projected IRR.
- Present a range of returns, not a point estimate. Cash-on-cash return, IRR, and equity multiple each tell a different part of the story - a deal with a low Year 1 cash-on-cash return can still be an excellent value-add investment if the multi-year IRR and equity multiple clear your hurdle.
To go deeper on the individual pieces of this model, see our guides to building a real estate pro forma, the debt service coverage ratio, and cap rate fundamentals. To test your own numbers, try our DSCR calculator and IRR calculator.
Underwriting a multifamily acquisition means turning a broker's marketing package into your own number: what will this property actually pay you, and does the price justify the risk? This guide walks through the full six-step process a sponsor runs before wiring earnest money - building the rent roll, calculating net operating income (NOI), testing the deal against a lender's DSCR minimum, modeling a value-add renovation plan, and underwriting the exit - using a fully worked 150-unit example with real numbers at every step.
Multifamily underwriting is not one calculation - it is a chain of them, each one feeding the next. A broker's offering memorandum will hand you a "pro forma NOI" that assumes every unit is renovated, fully leased, and paying top-of-market rent on day one. Your job as the buyer is to rebuild that number from the actual rent roll, layer in a realistic financing structure, and decide whether the resulting returns clear your hurdle rate. Skip a step - or worse, trust someone else's step - and you overpay.
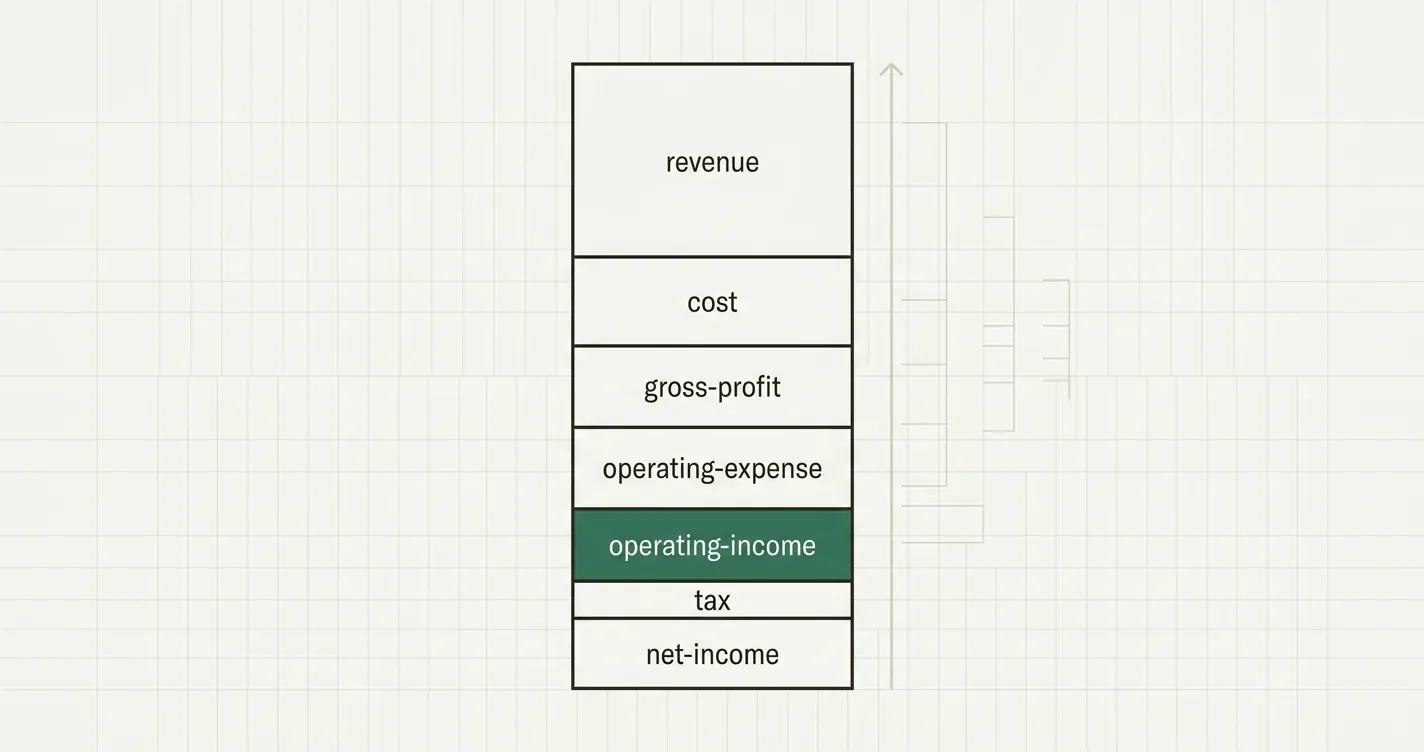
The Multifamily Underwriting Chain: From Rent Roll to Exit Returns
The Six-Step Underwriting Process
Every multifamily acquisition underwriting model - whether it is a 24-unit walk-up or a 400-unit garden community - runs through the same sequence:
- Build the rent roll and unit mix from the actual, verified in-place rents (not the broker's asking rents).
- Project income down to Effective Gross Income (EGI), accounting for vacancy, credit loss, and other income.
- Build operating expenses line by line and calculate Net Operating Income (NOI).
- Check the going-in basis by dividing NOI by the purchase price to get the going-in cap rate.
- Size the debt and test DSCR against the lender's minimum covenant.
- Model the value-add plan - renovation capex, rent premiums, and the resulting stabilized NOI.
- Underwrite the exit - a resale cap rate, sale costs, loan payoff, and the resulting cash-on-cash return, IRR, and equity multiple.
We will work through all seven with one running example: a 150-unit, Class B garden-style community trading at $18,500,000.
Step 1: Build the Rent Roll and Unit Mix
The rent roll is the foundation of the entire model - not the seller's pro forma, the actual current rent roll, unit by unit. Group units by type and take the average in-place rent for each group.
| Unit Type | Units | Avg. In-Place Rent | Monthly Rent |
|---|---|---|---|
| Studio / 1BR | 75 | $850 | $63,750 |
| 2BR / 3BR | 75 | $1,090 | $81,750 |
| Total | 150 | - | $145,500 |
Annualized, that is Gross Potential Rent (GPR) of $1,746,000 - the revenue the property would collect if every unit were occupied, all year, at the current in-place rent. This is the starting point, not the answer: it assumes zero vacancy and ignores whatever the broker claims "market rent" should be.
The gap between these in-place rents and what renovated, re-leased units are actually achieving in the submarket is the entire thesis of a value-add deal - and it is the first thing worth verifying independently against comparable listings, not the seller's claims.
Step 2: Project Income Down to Effective Gross Income (EGI)
Gross Potential Rent overstates real revenue in two ways: some units sit vacant or in collections, and some revenue comes from sources other than rent (parking, pet fees, laundry, application fees). Effective Gross Income (EGI) corrects both.
// Effective Gross Income (EGI)
= GPR - (GPR * Vacancy_And_Credit_Loss_Rate) + Other_Income
For this property, assume a 5% vacancy and credit loss allowance - reasonable for a stabilized Class B asset in a healthy submarket - and $45,000 of annual other income from parking, pet rent, and laundry.
| Line Item | Annual Amount |
|---|---|
| Gross Potential Rent (GPR) | $1,746,000 |
| Less: Vacancy & Credit Loss (5%) | ($87,300) |
| Plus: Other Income | $45,000 |
| Effective Gross Income (EGI) | $1,703,700 |
Underwriters typically test the vacancy assumption against both the property's own trailing 12-month history and the submarket average from a source like a local apartment association or CoStar - if the seller's trailing vacancy is materially lower than the submarket, treat that as a red flag rather than a feature.
Step 3: Build Operating Expenses and Calculate NOI
Net Operating Income (NOI) is EGI less all operating expenses required to run the property - before debt service, capital expenditures, and income taxes. Build it line by line rather than as a single expense-ratio guess; it is the single most manipulated number in a broker's offering memorandum.
| Expense Line | Per Unit / Year | Annual Total |
|---|---|---|
| Property taxes | $1,050 | $157,500 |
| Insurance | $350 | $52,500 |
| Utilities (common area) | $300 | $45,000 |
| Repairs & maintenance | $650 | $97,500 |
| Payroll (on-site staff) | $900 | $135,000 |
| General & administrative | $200 | $30,000 |
| Management fee (3% of EGI) | - | $51,111 |
| Total Operating Expenses | - | $568,611 |
// Net Operating Income (NOI)
= EGI - Total_Operating_Expenses

// Expense ratio sanity check
= Total_Operating_Expenses / EGI
| Metric | Value |
|---|---|
| Effective Gross Income | $1,703,700 |
| Less: Total Operating Expenses | ($568,611) |
| Net Operating Income (Year 1) | $1,135,089 |
| Expense Ratio (OpEx / EGI) | 33.4% |
An expense ratio in the low-to-mid 30s is reasonable for a well-run, moderately sized Class B community - the typical range runs 30-45% depending on age, climate, and whether utilities are owner-paid. If a seller's pro forma shows an expense ratio well below that range, the difference is usually deferred maintenance about to become your problem, not genuine efficiency. For the full build from gross rent to NOI, including reserves and levered cash flow, see our guide to building a real estate pro forma.
Step 4: Check the Going-In Basis with the Cap Rate
Once you have Year 1 NOI, divide it by the purchase price to get the going-in cap rate - the single number brokers lead with, and the one most often manipulated by using an inflated, forward-looking "pro forma NOI" instead of the actual in-place figure.
// Going-in cap rate
= NOI_Year1 / Purchase_Price
| Metric | Value |
|---|---|
| Purchase Price | $18,500,000 |
| Year 1 NOI (in-place) | $1,135,089 |
| Going-In Cap Rate | 6.1% |
A 6.1% in-place cap rate is a realistic, if unspectacular, starting basis for a Class B value-add deal - the return is unremarkable before the renovation plan does anything. That is normal: value-add sponsors are explicitly underwriting the gap between this in-place number and the stabilized NOI they expect to create in Steps 6 and 7, not the day-one yield. For more on how cap rates translate income into price (and vice versa), see our guide to cap rate fundamentals.
Step 5: Size the Debt and Test DSCR
With NOI established, size the acquisition loan and confirm the deal clears the lender's minimum Debt Service Coverage Ratio (DSCR) - the ratio of NOI to annual debt service that determines whether a lender will fund the loan at all, and at what size.
Assume a 70% loan-to-value (LTV) acquisition loan at a 5.75% fixed rate, structured as interest-only for the hold period (typical for a bridge loan financing a renovation program, since there is no amortization to model until refinancing into permanent debt at stabilization).
// Loan amount
= Purchase_Price * LTV

// Annual debt service (interest-only)
= Loan_Amount * Interest_Rate

// DSCR
= NOI / Annual_Debt_Service
| Metric | Value |
|---|---|
| Purchase Price | $18,500,000 |
| Loan Amount (70% LTV) | $12,950,000 |
| Equity (Down Payment) | $5,550,000 |
| Interest Rate | 5.75% |
| Annual Debt Service (Interest-Only) | $744,625 |
| Year 1 NOI | $1,135,089 |
| Year 1 DSCR | 1.52x |
Most agency and bank lenders set a minimum DSCR of 1.20x-1.25x for stabilized multifamily; bridge lenders financing a heavier value-add plan often accept 1.00x-1.15x in-place, betting on the renovation to grow coverage over the hold. At 1.52x, this deal clears even a conservative 1.25x covenant with room to spare in Year 1 - before the value-add plan has done any work. For a deeper look at how lenders calculate and stress-test this ratio, see our guide to the debt service coverage ratio.
Step 6: Model the Value-Add Plan and Stabilized NOI
This is the step that separates multifamily underwriting from a simple income-property pro forma: modeling the capital plan that closes the gap between in-place rent and market rent, and the resulting stabilized NOI once the renovation is complete.
Budget $22,000 per unit ($3,300,000 total across 150 units) for interior renovations - new flooring, countertops, fixtures, and appliances - funded from the initial equity raise alongside the down payment, not from operating cash flow.
| In-Place (Year 1) | Post-Renovation (Market) | Premium | |
|---|---|---|---|
| Studio / 1BR | $850 | $1,000 | +$150 |
| 2BR / 3BR | $1,090 | $1,285 | +$195 |
Rent premiums of 150/mo and 195/mo on renovated units are conservative for a Class B value-add plan - well within the 10-25% lift typical of a well-executed interior renovation program. Assuming all 150 units are renovated and re-leased by Year 5, and market rents grow a modest 3% per year over that ramp:
| Metric | Year 1 (In-Place) | Year 5 (Stabilized) |
|---|---|---|
| Gross Potential Rent | $1,746,000 | $2,314,609 |
| Less: Vacancy & Credit Loss | ($87,300) | ($115,730) |
| Plus: Other Income | $45,000 | $50,648 |
| Effective Gross Income | $1,703,700 | $2,249,527 |
| Less: Operating Expenses | ($568,611) | ($638,709) |
| Net Operating Income | $1,135,089 | $1,610,818 |
| DSCR (on original debt) | 1.52x | 2.16x |
Operating expenses grow more slowly than revenue (2.5%/yr versus 3%/yr) because fixed costs like payroll and G&A do not scale linearly with rent, while the management fee - the one variable line - rises with EGI. The result: NOI grows 41.9% over the hold, and DSCR on the original, unchanged loan balance climbs from 1.52x to 2.16x, since debt service is fixed but income is not. That widening coverage cushion is the real underwriting case for a value-add deal - not just the exit valuation.
Step 7: Underwrite the Exit and the Returns
The final step converts the Year 1-5 NOI path into the cash flows that determine whether the deal actually clears your return hurdle: cash-on-cash return each year, the resale value at exit, and the resulting IRR and equity multiple across the whole hold.
Year-by-Year Levered Cash Flow
With NOI ramping from $1,135,089 to $1,610,818 and debt service fixed at $744,625 (interest-only), the property's operating cash flow to equity grows every year of the hold:
| Year | NOI | Debt Service | Levered Cash Flow |
|---|---|---|---|
| 1 | $1,135,089 | ($744,625) | $390,464 |
| 2 | $1,254,021 | ($744,625) | $509,396 |
| 3 | $1,372,954 | ($744,625) | $628,329 |
| 4 | $1,491,886 | ($744,625) | $747,261 |
| 5 | $1,610,818 | ($744,625) | $866,193 |
Year 1 cash-on-cash return - operating cash flow divided by total equity invested - comes in at 4.4%, which is deliberately modest: this is the underwriting case for a heavy value-add deal, where the return builds over the hold rather than showing up on day one.
Exit Valuation
At the end of Year 5, value the property using the stabilized NOI and a resale cap rate. Assume modest cap rate compression from the 6.1% going-in cap to a 5.85% exit cap, reflecting the improved, renovated asset quality:
// Exit value
= NOI_Year5 / Exit_Cap_Rate

// Net proceeds to equity
= (Exit_Value * (1 - Selling_Cost_Pct)) - Outstanding_Loan_Balance
| Metric | Value |
|---|---|
| Year 5 NOI | $1,610,818 |
| Exit Cap Rate | 5.85% |
| Gross Exit Value | $27,535,350 |
| Less: Selling Costs (2%) | ($550,707) |
| Net Sale Proceeds | $26,984,643 |
| Less: Loan Payoff (interest-only, unchanged) | ($12,950,000) |
| Net Proceeds to Equity at Sale | $14,034,643 |
Sponsor Returns
Add the sale proceeds to the Year 5 operating cash flow, and compare total distributions against the $8,850,000 of total equity invested ($5,550,000 down payment plus $3,300,000 renovation capex):
// IRR across the full hold period
= XIRR(Cash_Flow_Range, Date_Range)

// Equity multiple (MOIC)
= Total_Distributions / Total_Equity_Invested
| Metric | Value |
|---|---|
| Total Equity Invested | $8,850,000 |
| Total Cash Distributed (Years 1-5, incl. sale) | $17,176,286 |
| 5-Year Levered IRR | 15.3% |
| Equity Multiple (MOIC) | 1.94x |
A 15.3% IRR and 1.94x equity multiple sit squarely in the range most sponsors target for a middle-market, value-add multifamily deal (typically 12-18% IRR and 1.5-2.5x over a 5-year hold). Note how sensitive both figures are to the exit cap rate assumption: model the exit at the same 6.1% cap rate you paid, with zero compression, and the exit value - and therefore the IRR - drops meaningfully. Never underwrite cap rate compression as a given; treat it as the upside case and stress-test the deal at a flat or even wider exit cap.
Common Mistakes When Underwriting a Multifamily Acquisition
- Using the broker's pro forma NOI instead of the actual trailing NOI. Offering memoranda routinely show a "Year 1 pro forma" that already assumes renovated units at market rent - rebuild NOI from the real, current rent roll and treat the broker's number as a target, not a starting point.
- Underestimating vacancy and credit loss. A seller's trailing 12-month vacancy can be flattered by recent concessions or a temporary leasing push. Cross-check against the submarket average.
- Ignoring capital reserves. Deducting only operating expenses from EGI and forgetting an ongoing capital reserve (routinely $250-$400/unit/year even outside a renovation program) overstates the cash flow available to equity.
- Assuming cap rate compression at exit. Underwriting the exit at a lower cap rate than you paid is the single most common way sponsors inflate projected IRR. Model a flat or wider exit cap as your base case.
- Sizing debt off pro forma NOI instead of in-place NOI. Lenders (and disciplined sponsors) size the loan against the trailing, in-place NOI - not the stabilized number you hope to achieve after renovation.
- Overestimating renovation rent premiums. A 10-25% premium on renovated units is realistic in most submarkets; underwriting 30%+ premiums without strong comparable evidence is how value-add deals miss their pro forma.
- Treating DSCR as a one-time test. DSCR should be checked every year of the hold, not just at closing - a deal that clears the covenant on Year 1 in-place NOI but would fail it on a downside vacancy scenario carries real refinancing risk.

Alex Tapio
Founder of Finamodel • Professional Financial Modeller • Ex-Deloitte