
How to Build a Cash Flow Forecast in Excel
Key Takeaways
- Cash, not profit, keeps the lights on. A cash flow forecast models the timing of money in and out - the gap that accrual profit ignores and that bankrupts profitable companies.
- Direct method for liquidity, indirect for reconciliation. Build the direct method to watch the bank balance; use the indirect bridge to prove it agrees with your P&L and balance sheet.
- Working capital is the hidden driver. DSO, DIO, and DPO move the forecast more than the revenue line. Model collection and payment timing explicitly, not as same-day cash.
- Roll it forward with formulas. Closing cash flows into next month's opening balance automatically; a
MIN()and anIF()flag turn the model into an early-warning system. - The downside case is the point. A forecast that only shows the base case is decoration. Stress-test revenue, DSO, and lumpy outflows, and arrange financing before the tight month, not during it.
- Forecast at the right granularity. Monthly for budgeting and covenants; weekly (13-week) when liquidity is tight enough that a mid-month dip could breach.
A reliable cash flow forecast is not a once-a-year spreadsheet - it is a living model you update every week against actuals. Start from the free cash flow model template, centralise your assumptions, and let the formulas do the rest.
A cash flow forecast is the most important model a business can run: it tells you, week by week or month by month, whether you will have enough cash to pay your bills. This guide shows you how to build a rolling cash flow forecast in Excel from scratch - the direct and indirect methods, the operating/investing/financing structure, a fully worked monthly example with real numbers, the Excel formulas that make the model self-updating, and the mistakes that turn a forecast into wishful thinking.
A profitable company can still go bankrupt. Profit is an accounting concept measured on an accrual basis; cash is what actually pays salaries, suppliers, and lenders. The gap between the two is timing - you book revenue when you invoice, but the money lands 45 days later, while payroll is due on the 1st regardless. A cash flow forecast (also called a cash flow projection) exists to capture exactly that timing so you never get blindsided by a dip you could have seen coming.
Done well, a cash flow forecast is the difference between calmly drawing on a revolver three months before you need it and frantically calling the bank the week payroll bounces. It is the one model every founder, CFO, and controller should be able to build and trust.
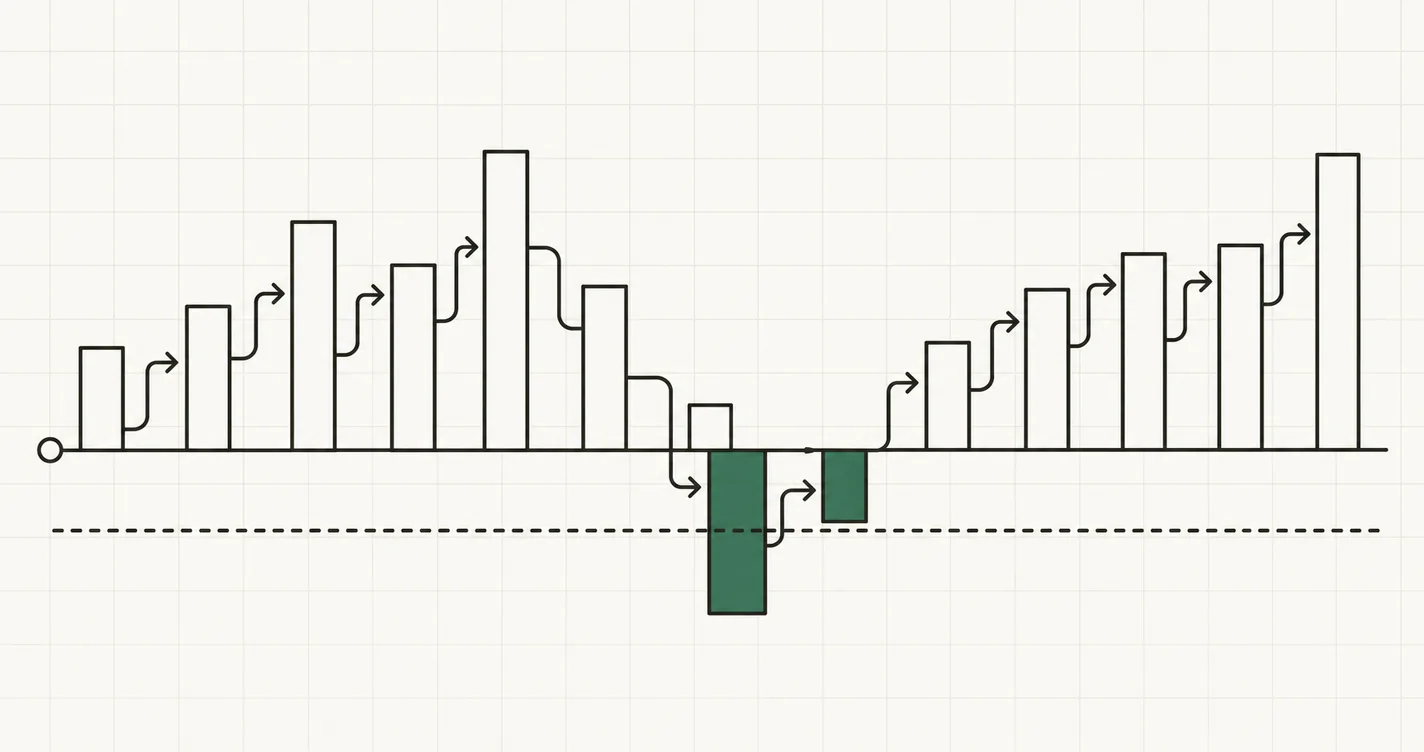
The cash flow forecast logic: each period's closing cash becomes the next period's opening balance, and every closing balance is tested against your minimum cash threshold.
Forecast vs. Projection: A Note on Terminology
People use "cash flow forecast," "cash flow projection," and "cash flow plan" interchangeably, and for practical purposes they mean the same thing: a forward-looking schedule of cash in and cash out. If there is any nuance, it is that a forecast usually implies your single best estimate of what will happen, while a projection sometimes implies a what-if scenario built on a hypothetical assumption ("project our cash position if revenue falls 20%"). In day-to-day finance the two words are synonyms, and a good cash flow forecast template lets you flex assumptions to produce projections on demand.
What matters far more than the label is the time horizon and granularity:
- Short-term (13-week) cash flow forecast: weekly buckets, direct method, used for liquidity management and turnaround situations.
- Medium-term operating forecast: monthly buckets, 12–24 months, used for budgeting and covenant planning.
- Long-term cash flow projection: annual, 3–5 years, used inside a full 3-statement financial model or a DCF valuation.
This guide builds a monthly direct-method forecast because it is the most intuitive starting point and translates directly to the weekly version.
Direct vs. Indirect Method
There are two ways to build the operating section of a cash flow forecast. They reach the same number by different routes.
| Direct Method | Indirect Method | |
|---|---|---|
| Starting point | Actual cash receipts and payments | Net income (accrual profit) |
| How it works | List every cash inflow and outflow by category | Start with profit, add back non-cash items, adjust for working capital changes |
| Best for | Short-term liquidity forecasting (13-week, monthly) | Tying the forecast back to the P&L and balance sheet |
| Data needed | Collection timing, payment terms, payroll dates | Income statement plus AR/inventory/AP balances |
| Intuition | High - "money in, money out" | Lower - requires accounting fluency |
For a standalone cash flow forecast, the direct method is king: it is what a treasurer actually watches. The indirect method is what appears as the cash flow statement inside a 3-statement model, because it reconciles cleanly to net income and the balance sheet. A complete forecast often uses both - direct method for the near-term liquidity view, indirect method to prove it agrees with the accounting.
We will build the direct method first, then show the indirect bridge so you understand how the two connect.
Structuring the Model in Excel
Lay the forecast out as a single horizontal grid: rows are line items, columns are periods (one column per month). Keep three blocks stacked vertically:
- Operating activities - collections from customers, payments to suppliers, payroll, rent, overhead, tax.
- Investing activities - capital expenditure, asset purchases or sales.
- Financing activities - loan draws, debt repayments, interest, equity injections, dividends.
Below the three blocks, add the roll-forward:
Opening Cash
+ Net Operating Cash Flow
+ Net Investing Cash Flow
+ Net Financing Cash Flow
= Net Change in Cash
+ Opening Cash
= Closing Cash
The golden rule is the same as in any model: every assumption lives on a dedicated Assumptions sheet, and every cell in the forecast is a formula that references it. Collection percentages, payment terms, headcount cost, the minimum cash buffer - all of it sits in one place so you can run a new scenario in seconds without hunting through the grid.
Step 1: Forecast Cash Receipts
Receipts are the hardest line to get right because revenue and collection are not the same month. If you invoice $150,000 in March on 45-day terms, very little of it arrives in March - most lands in April and May. Model this with a collection pattern: what fraction of a month's sales is collected in the same month, the next month, and the month after.
// Cash collected this month =
//   this month's sales x % collected in month 0
// + last month's sales  x % collected in month 1
// + sales two months ago x % collected in month 2
= Sales_M0 * Assumptions!$B$4
+ Sales_M1 * Assumptions!$B$5
+ Sales_M2 * Assumptions!$B$6
If your collection percentages do not sum to 100%, you are implicitly assuming bad debt - which is fine, as long as it is deliberate. For a quick first pass, you can drive collections off Days Sales Outstanding (DSO) instead: higher DSO pushes cash further into the future. We return to DSO in the working capital section below.
Step 2: Forecast Cash Disbursements
Disbursements are easier because most are either contractual or predictable:
- Supplier / COGS payments - driven off purchases and your Days Payable Outstanding (DPO). Like collections, these lag the expense.
- Payroll - usually the largest and most rigid outflow. It does not wait for a good month.
- Rent and fixed overhead - flat monthly amounts.
- Tax - lumpy. Quarterly or semi-annual payments create predictable cash air-pockets you must plan around.
- Interest and debt service - from the financing section.
The danger with disbursements is not the steady ones - it is the lumpy ones. A single quarterly tax payment or annual insurance premium can turn a healthy month into a breach if you forecast everything as a smooth monthly average.
A Fully Worked 6-Month Forecast
Let's build a direct-method forecast for a small wholesale business. Opening cash is $40,000, and the bank covenant requires a minimum cash balance of $25,000 at all times.
Assumptions:
| Assumption | Value |
|---|---|
| Opening cash (start of Month 1) | $40,000 |
| Minimum cash covenant | $25,000 |
| Payroll (per month) | $40,000 |
| Rent and fixed overhead (per month) | $18,000 |
| Tax payments | $15,000 in Months 3 and 6 |
| Equipment purchase | $30,000 in Month 2 |
| Loan repayment (per month) | $5,000 |
| New loan draw | $20,000 in Month 4 |
The forecast:
| Line Item | M1 | M2 | M3 | M4 | M5 | M6 |
|---|---|---|---|---|---|---|
| Opening Cash | $40.0k | $49.0k | $34.0k | $31.0k | $75.0k | $102.0k |
| Customer receipts | $120.0k | $130.0k | $125.0k | $145.0k | $150.0k | $165.0k |
| Supplier payments | ($48.0k) | ($52.0k) | ($50.0k) | ($58.0k) | ($60.0k) | ($66.0k) |
| Payroll | ($40.0k) | ($40.0k) | ($40.0k) | ($40.0k) | ($40.0k) | ($40.0k) |
| Rent and overhead | ($18.0k) | ($18.0k) | ($18.0k) | ($18.0k) | ($18.0k) | ($18.0k) |
| Tax | - | - | ($15.0k) | - | - | ($15.0k) |
| Operating Cash Flow | $14.0k | $20.0k | $2.0k | $29.0k | $32.0k | $26.0k |
| Equipment purchase | - | ($30.0k) | - | - | - | - |
| Investing Cash Flow | $0.0k | ($30.0k) | $0.0k | $0.0k | $0.0k | $0.0k |
| Loan repayment | ($5.0k) | ($5.0k) | ($5.0k) | ($5.0k) | ($5.0k) | ($5.0k) |
| New loan draw | - | - | - | $20.0k | - | - |
| Financing Cash Flow | ($5.0k) | ($5.0k) | ($5.0k) | $15.0k | ($5.0k) | ($5.0k) |
| Net Change in Cash | $9.0k | ($15.0k) | ($3.0k) | $44.0k | $27.0k | $21.0k |
| Closing Cash | $49.0k | $34.0k | $31.0k | $75.0k | $102.0k | $123.0k |
| Covenant headroom | $24.0k | $9.0k | $6.0k | $50.0k | $77.0k | $98.0k |
Read the story the numbers tell. The business is profitable on an operating basis every single month, yet Months 2 and 3 are dangerous. The $30,000 equipment purchase in Month 2 combined with weak operating cash flow in Month 3 drives the closing balance down to $31,000 - only $6,000 above the covenant floor. One slow-paying customer or one early tax bill and the company breaches.
A forecast surfaces this in January, when management still has options: delay the equipment purchase a month, accelerate collections, or pre-arrange a small overdraft. Without the forecast, the first sign of trouble is a bounced payment in March. That early warning is the entire point of the exercise.
Why Timing Matters: Working Capital
The reason a profitable business runs short of cash is almost always working capital - the cash tied up in receivables and inventory, net of what suppliers finance for you. Three levers drive it:
- DSO (Days Sales Outstanding): how long customers take to pay. Higher DSO = cash arrives later.
- DIO (Days Inventory Outstanding): how long stock sits before it sells. Higher DIO = more cash frozen in the warehouse.
- DPO (Days Payable Outstanding): how long you take to pay suppliers. Higher DPO = suppliers fund more of your cycle.
The cash conversion cycle is DSO + DIO − DPO. A growing business with a long cycle can grow itself straight into insolvency: every new sale ties up more cash before it ever produces any. Stretch DSO from 45 to 60 days in the example above and a chunk of every month's receipts slides into the following month - enough to push Month 3 below the covenant. Model these timing levers explicitly; they move the forecast more than the revenue line does.
Use the calculator below to see how DSO, DIO, and DPO combine into a net working capital requirement, then feed that timing into your collection and payment assumptions.
The Indirect Method Bridge
If you are building this inside a full model, you will also want the indirect view, which starts from accrual profit and reconciles to cash. For a single month it looks like this:
| Line | Amount |
|---|---|
| Net income | $18,000 |
| + Depreciation and amortisation (non-cash) | $4,000 |
| − Increase in accounts receivable | ($6,000) |
| − Increase in inventory | ($3,000) |
| + Increase in accounts payable | $2,000 |
| = Operating cash flow | $15,000 |
The logic: start with profit, add back non-cash expenses (depreciation reduced profit but no cash left), then adjust for working capital - a rise in receivables or inventory consumes cash, while a rise in payables releases it. The indirect method is exactly how the cash flow statement is built inside a 3-statement financial model, and getting it to agree with your direct-method forecast is the best integrity check you can run.
// Indirect operating cash flow
= Net_Income
+ Depreciation_Amortisation
- (AR_Current - AR_Prior)
- (Inventory_Current - Inventory_Prior)
+ (AP_Current - AP_Prior)
Building It to Update Itself
The model is only useful if it rolls forward automatically. Three formulas do the heavy lifting.
1. Opening cash equals last period's closing cash. Never retype it - link it, so a change in any month cascades:
// February opening cash (cell D30) = January closing cash (cell C42)
= C42
2. Closing cash is opening plus the net change:
= Opening_Cash + Operating_CF + Investing_CF + Financing_CF
3. A minimum-cash flag turns the model into an early-warning system. Conditional-format this red so a breach is impossible to miss:
= IF(Closing_Cash < Assumptions!$B$8, "FUNDING GAP", "OK")
Add a MIN() across the closing-cash row to surface the tightest month at a glance, and a running headroom line (Closing Cash − Minimum Cash) so you always know how much buffer remains:
// Lowest closing balance across the whole forecast horizon
= MIN(C42:H42)
Rather than build all of this from a blank sheet, you can start from a ready-made structure and just plug in your numbers - download the free cash flow model template and preview it live below.
Stress-Testing and Scenarios
A single best-guess forecast is necessary but not sufficient. Because the whole model is driven from the Assumptions sheet, building scenarios is cheap - and the downside case is the one that matters:
- Base case: your honest best estimate.
- Downside case: revenue 15–20% lower, DSO stretched by 15 days, one large customer pays late. This is the scenario that tells you how much runway you really have.
- Upside case: useful for planning growth investment, but never the case you manage liquidity against.
The question a forecast must answer is not "what do we expect?" but "what is the worst week, and do we survive it?" If the downside case breaches the covenant, you arrange financing now - while you still can - rather than after the breach. For early-stage companies where the whole runway question dominates, our startup financial model guide walks through burn rate and runway in depth.
Common Mistakes to Avoid
- Confusing profit with cash. The number one error. Booking a sale is not the same as banking the money. Forecast collections, not revenue, and payments, not expenses.
- Smoothing lumpy outflows. Spreading a quarterly tax bill or an annual insurance premium evenly across twelve months hides the exact air-pockets that cause breaches. Put lumpy items in the month they actually hit.
- Ignoring collection and payment timing. Assuming customers pay the instant you invoice - and that you pay suppliers on the same day - collapses the working capital cycle to zero and dramatically overstates near-term cash.
- No minimum-cash buffer. Forecasting to a zero balance is forecasting to insolvency. Always test closing cash against a covenant floor or self-imposed buffer, and flag breaches automatically.
- Hardcoding the roll-forward. Typing opening balances by hand breaks the chain - change one month and the rest no longer reconcile. Opening cash must always be a formula linked to the prior closing balance.
- Only modelling the base case. Cash forecasts exist for the bad months. If you have not built a downside scenario, you do not know your real runway.
- Forecasting too coarsely for the risk. A monthly forecast can hide a mid-month dip when a big payment lands on the 5th but cash arrives on the 25th. If liquidity is tight, drop to a weekly (13-week) view.

Alex Tapio
Founder of Finamodel • Professional Financial Modeller • Ex-Deloitte







