
How the Three Financial Statements Link Together
Key Takeaways
- Three links do all the work. Net income feeds the CF and retained earnings; ending cash from the CF drives the balance-sheet cash line; depreciation and CapEx roll PP&E forward. Everything else is a supporting connection.
- Every shared number lives in one place. Net income, cash, and PP&E are each calculated once and referenced everywhere else. No number is ever typed twice.
- Cash is an output, never an input. Forecast every balance-sheet line except cash. Cash falls out of the cash flow statement, and that is what makes the model self-consistent.
- The balance check is your proof and your debugger. If Assets = Liabilities + Equity in every period, your 3 statement linkage is correct. If it doesn't, a link is broken - not a formula.
- Build in order: IS, then BS, then CF, then close the loop. Net income has to exist first; cash comes last, feeding back to the balance sheet.
- The whole model becomes dynamic. Once linked, one assumption change - faster growth, a new loan, a slower collection cycle - cascades through all three statements automatically. That is the payoff for wiring the connections correctly.
Ready to build one from scratch? Follow our step-by-step 3-statement model tutorial, or start from the free 3 Statement Model template and see the linkages already wired.
A three statement model links the income statement, balance sheet, and cash flow statement into one connected system, so that a single assumption - a change in revenue, a new loan, a slower collection cycle - flows automatically through all three. This guide explains how the three financial statements connect, walks through the exact linkages line by line, and proves them with a fully tied worked example where the balance sheet balances to the penny.
Most people can build each of the three financial statements in isolation. The skill that separates a real financial modeller from a spreadsheet jockey is understanding how they link. In a properly built three statement model, you never type net income onto the balance sheet or cash into two places - every shared number lives in exactly one statement and is referenced by the others. Get the 3 statement linkage right and the model becomes self-checking: if the balance sheet doesn't balance, you know a link is broken.
This post is the conceptual companion to our step-by-step build tutorial. Here we focus purely on how financial statements connect - the plumbing - so that when you build one, the wiring is obvious.
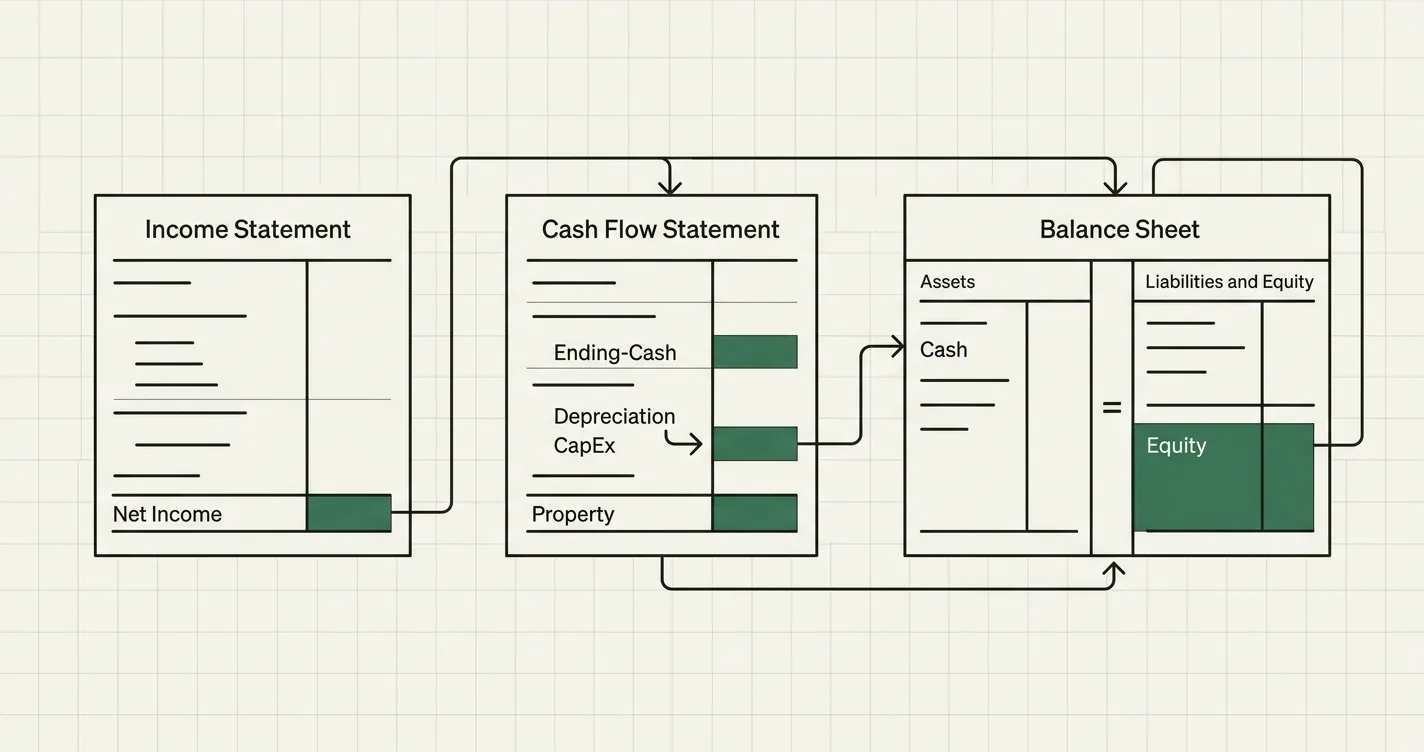
How the three statements connect: net income feeds both the cash flow statement and equity, the cash flow statement drives the cash line, and the balance sheet ties it all together.
The Three Statements at a Glance
Before wiring them together, be clear on what each statement measures:
- Income Statement (IS): Profitability over a period. Revenue minus expenses equals net income. It is an accrual view - it records revenue when earned and expenses when incurred, not when cash moves.
- Balance Sheet (BS): Financial position at a single point in time. Assets = Liabilities + Equity. It is a snapshot, not a flow.
- Cash Flow Statement (CF): The reconciliation between the two. It starts from accrual net income and adjusts for non-cash items and timing differences to show the actual cash that moved during the period.
The cash flow statement exists precisely because the income statement is accrual-based. A company can be profitable and still run out of cash, or unprofitable and cash-rich. The CF statement bridges that gap - and in doing so, it is the connective tissue of the whole model.
The Three Critical Links
Linking income statement, balance sheet and cash flow comes down to three connections. Master these and every other link is a variation on the same idea.
Link 1: Net Income Feeds Both the Balance Sheet and the Cash Flow Statement
Net income is calculated once, on the income statement. From there it flows to two places:
- To the top of the cash flow statement, as the starting point for cash from operations.
- Into retained earnings on the balance sheet, via the roll-forward:
Ending Retained Earnings = Beginning Retained Earnings + Net Income - Dividends
This is the single most important linkage in the model. Net income is never typed twice - it is referenced. If you hardcode it on the balance sheet, the model breaks the moment an assumption changes.
// Net income flows from the income statement into cash flow and equity
CashFlow!Net_Income            = IncomeStatement!Net_Income
BalanceSheet!Retained_Earnings = Prior_Retained_Earnings + IncomeStatement!Net_Income - Dividends
Link 2: The Cash Flow Statement Drives the Cash Line on the Balance Sheet
The cash flow statement sums operating, investing, and financing cash flows into a net change in cash. That net change rolls the opening cash balance forward to a closing balance - and that closing balance is the cash line on the balance sheet.
Ending Cash = Beginning Cash + Net Change in Cash
BalanceSheet!Cash = CashFlow!Ending Cash
Cash is the only asset you should never forecast directly. It is always an output of the cash flow statement. This is what makes the model self-consistent: if every other line is linked correctly, cash falls out automatically and the balance sheet balances.
// Ending cash on the cash flow statement drives the balance sheet cash line
CashFlow!Ending_Cash = CashFlow!Beginning_Cash + CashFlow!Net_Change_in_Cash
BalanceSheet!Cash    = CashFlow!Ending_Cash
Link 3: Depreciation and CapEx Roll PP&E Forward
Depreciation appears on the income statement (as an expense) but is a non-cash item, so the cash flow statement adds it back in operating activities. Meanwhile, capital expenditure (CapEx) is a real cash outflow in investing activities. Both connect to a single balance sheet line - net property, plant & equipment (PP&E) - through a roll-forward:
Ending PP&E = Beginning PP&E + CapEx - Depreciation
So depreciation does triple duty: it lowers net income on the IS, it is added back on the CF, and it reduces PP&E on the BS. CapEx does double duty: it is a cash outflow on the CF and it increases PP&E on the BS. Miss either connection and the balance sheet won't balance.
// Depreciation and CapEx roll PP&E forward
BalanceSheet!PPE_Net = Prior_PPE_Net + CashFlow!CapEx - IncomeStatement!Depreciation
The Supporting Links: Working Capital and Debt
Two more connections complete the picture:
- Working capital: Changes in accounts receivable, inventory, and accounts payable on the balance sheet flow into the operating section of the cash flow statement. An increase in AR or inventory uses cash; an increase in AP is a source of cash.
- Debt and interest: The debt balance sits on the balance sheet. Interest expense (a function of that balance) hits the income statement. Principal repayments are a financing cash outflow that reduces the debt balance on the next period's balance sheet.
// Working capital changes flow from the balance sheet into operating cash flow
CashFlow!Change_in_AR  = -(BalanceSheet!AR_Current - BalanceSheet!AR_Prior)
CashFlow!Change_in_AP  =  (BalanceSheet!AP_Current - BalanceSheet!AP_Prior)

// Debt links interest (IS), repayment (CF), and the balance (BS)
IncomeStatement!Interest = BalanceSheet!Debt_Prior * Interest_Rate
BalanceSheet!Debt        = BalanceSheet!Debt_Prior - CashFlow!Debt_Repayment
A Fully Linked Worked Example
Theory is cheap. Let's prove the linkages with a one-year model that ties out completely. We start with a beginning balance sheet, run one year of operations, and confirm the ending balance sheet balances.
Step 1: The Beginning Balance Sheet (Year 0)
| Balance Sheet | Year 0 |
|---|---|
| Cash | $50 |
| Accounts Receivable | $40 |
| Inventory | $30 |
| PP&E (net) | $200 |
| Total Assets | $320 |
| Accounts Payable | $25 |
| Debt | $100 |
| Common Stock | $100 |
| Retained Earnings | $95 |
| Total Liabilities & Equity | $320 |
The opening balance sheet balances: $320 of assets = $25 + $100 + $100 + $95 = $320 of liabilities and equity.
Step 2: The Income Statement (Year 1)
| Income Statement | Year 1 |
|---|---|
| Revenue | $500 |
| Cost of Goods Sold | ($300) |
| Gross Profit | $200 |
| SG&A | ($100) |
| Depreciation | ($20) |
| EBIT | $80 |
| Interest Expense (5% × $100) | ($5) |
| Pre-Tax Income | $75 |
| Taxes (20%) | ($15) |
| Net Income | $60 |
Interest is $100 opening debt × 5% = $5. Pre-tax income is $80 − $5 = $75. Tax is 20% × $75 = $15. Net income is $75 − $15 = $60.
Step 3: The Cash Flow Statement (Year 1)
Now we apply the links. Net income ($60) starts the statement. We add back depreciation ($20), adjust for working capital, subtract CapEx of $30, and account for financing.
| Cash Flow Statement | Year 1 |
|---|---|
| Net Income | $60 |
| + Depreciation | $20 |
| − Increase in AR ($40 → $50) | ($10) |
| − Increase in Inventory ($30 → $35) | ($5) |
| + Increase in AP ($25 → $33) | $8 |
| Cash from Operations | $73 |
| CapEx | ($30) |
| Cash from Investing | ($30) |
| Debt Repayment | ($10) |
| Dividends Paid | ($20) |
| Cash from Financing | ($30) |
| Net Change in Cash | $13 |
| Beginning Cash | $50 |
| Ending Cash | $63 |
Cash from operations: $60 + $20 − $10 − $5 + $8 = $73. Net change in cash: $73 − $30 − $30 = $13. Ending cash: $50 + $13 = $63.
Step 4: The Ending Balance Sheet (Year 1)
Every line below is driven by the other two statements - nothing is typed in directly except what the operating assumptions dictate.
| Balance Sheet | Year 0 | Year 1 | Driver |
|---|---|---|---|
| Cash | $50 | $63 | Ending cash from CF |
| Accounts Receivable | $40 | $50 | Working capital assumption |
| Inventory | $30 | $35 | Working capital assumption |
| PP&E (net) | $200 | $210 | $200 + $30 CapEx − $20 Depr |
| Total Assets | $320 | $358 | |
| Accounts Payable | $25 | $33 | Working capital assumption |
| Debt | $100 | $90 | $100 − $10 repayment |
| Common Stock | $100 | $100 | No new issuance |
| Retained Earnings | $95 | $135 | $95 + $60 NI − $20 dividends |
| Total Liabilities & Equity | $320 | $358 |
Step 5: The Balance Check
The proof that every link is correct: Total Assets ($358) = Total Liabilities & Equity ($358). The difference is exactly zero.
// The balance check that proves the links hold
Check = BalanceSheet!Total_Assets - (BalanceSheet!Total_Liabilities + BalanceSheet!Total_Equity)
// Check must equal 0 in every period
Trace each linkage through the numbers:
- Net income ($60) started the cash flow statement and lifted retained earnings from $95 to $135 (after the $20 dividend).
- Ending cash ($63) from the cash flow statement became the balance sheet cash line.
- Depreciation ($20) and CapEx ($30) rolled PP&E from $200 to $210.
- Working capital changes (−$10 AR, −$5 inventory, +$8 AP) reconciled the balance sheet movements into operating cash flow.
- Debt repayment ($10) from financing cut the debt balance from $100 to $90.
Because all five connections hold, the balance sheet balances without a plug. That is the entire point of a linked model.
Which Statement Do You Build First?
A common question, and the order matters:
- Income statement first. You need net income before anything else can flow.
- Balance sheet second - but leave cash blank. Build every line except cash, which you can't know yet.
- Cash flow statement third. It pulls net income and non-cash items from the IS and working-capital movements from the BS, producing the net change in cash.
- Close the loop. Feed ending cash back to the balance sheet's cash line. Now the balance sheet balances.
If it doesn't balance on the first try, that's normal - the balance check is your debugging tool, and the error is always a missing or double-counted link.
Common Mistakes to Avoid
- Hardcoding net income on the balance sheet. Retained earnings must reference the income statement, not a typed number. Hardcode it and the balance sheet stops responding to assumptions.
- Forecasting cash directly. Cash is an output of the cash flow statement, never an input. If you plug a cash number, you've hidden the very error the balance check is designed to catch.
- Getting the working-capital sign backwards. An increase in accounts receivable is a use of cash (negative on the CF). An increase in accounts payable is a source of cash (positive). Flip a sign and the model balances nowhere.
- Omitting the depreciation add-back. Depreciation reduces net income but not cash. Forget to add it back on the cash flow statement and you understate operating cash flow - and PP&E won't roll forward correctly either.
- Double-counting CapEx. CapEx belongs in investing activities and increases PP&E on the balance sheet - but it should hit cash only once, through the cash flow statement.
- Chasing the balance-sheet imbalance in the wrong place. When assets don't equal liabilities plus equity, the culprit is almost always a broken link - an item that moved on one statement but not the other. Check the three critical links before touching individual formulas.
- Circular reference panic. Interest on average debt or a cash sweep can create intentional circularity. Enable iterative calculation rather than breaking the link - see our guide to modelling mistakes for how to handle it cleanly.

Alex Tapio
Founder of Finamodel • Professional Financial Modeller • Ex-Deloitte







