
NPV Formula: How to Calculate Net Present Value in Excel
Key Takeaways
- The formula is one line:
NPV = Σ CFt / (1 + r)^t. Discount every future cash flow, leave the year-0 flow undiscounted, and add them all up. - Positive NPV = accept. It means the project earns more than the discount rate and adds value in today's dollars. Zero NPV means it earns exactly
r, and that rate is the IRR. - Excel's
NPV()is offset by one period. Pass it future cash flows only and add the initial investment outside:=C1 + NPV(B1, C2:C6). The wrong version understates NPV by a factor of1 / (1 + r). - Use
XNPV()for irregular dates. It discounts on actual days from the first date, includes the period-0 flow in its range, and does not introduce the timing errors you get from forcing cash flows onto even annual periods. - The annuity shortcut works for level streams:
PV = C x [1 - (1 + r)^-n] / r. Faster than discounting term by term, and easy to check againstNPV(). - The discount rate is the swing factor. Use WACC for firm-level analysis, cost of equity for equity cash flows, and always stress-test NPV across a range rather than trusting a single point.
- NPV runs on cash, not profit. Add back non-cash charges, subtract CapEx and working-capital investment, and include a terminal value if the asset keeps producing cash after the forecast ends.
For the metric-versus-metric debate, read NPV vs IRR. To see NPV applied to a company valuation, work through the DCF model tutorial or start from the DCF template.
The NPV (net present value) formula discounts every cash flow a project produces back to today's dollars and adds them up: NPV = the sum of CFt / (1 + r)^t. A positive result means the investment beats your discount rate and adds value; a negative result means it does not. This guide breaks down the net present value formula term by term, works a full five-year example, and shows exactly how to calculate NPV in Excel three different ways - including the one-period offset that quietly corrupts most spreadsheets.
Net present value is the cornerstone of investment appraisal and the engine inside every discounted cash flow valuation. The logic is simple: a dollar received in three years is worth less than a dollar today, because today's dollar can be invested and grown. NPV puts every future cash flow on the same footing - today's purchasing power - so you can compare a lump-sum cost against a stream of future benefits on a like-for-like basis.
The formula itself is a single line. What trips people up is the mechanics: which cash flow sits at time zero, whether Excel's NPV() function discounts the way you think it does, and how to handle cash flows that do not land on tidy annual dates. We will cover all three.
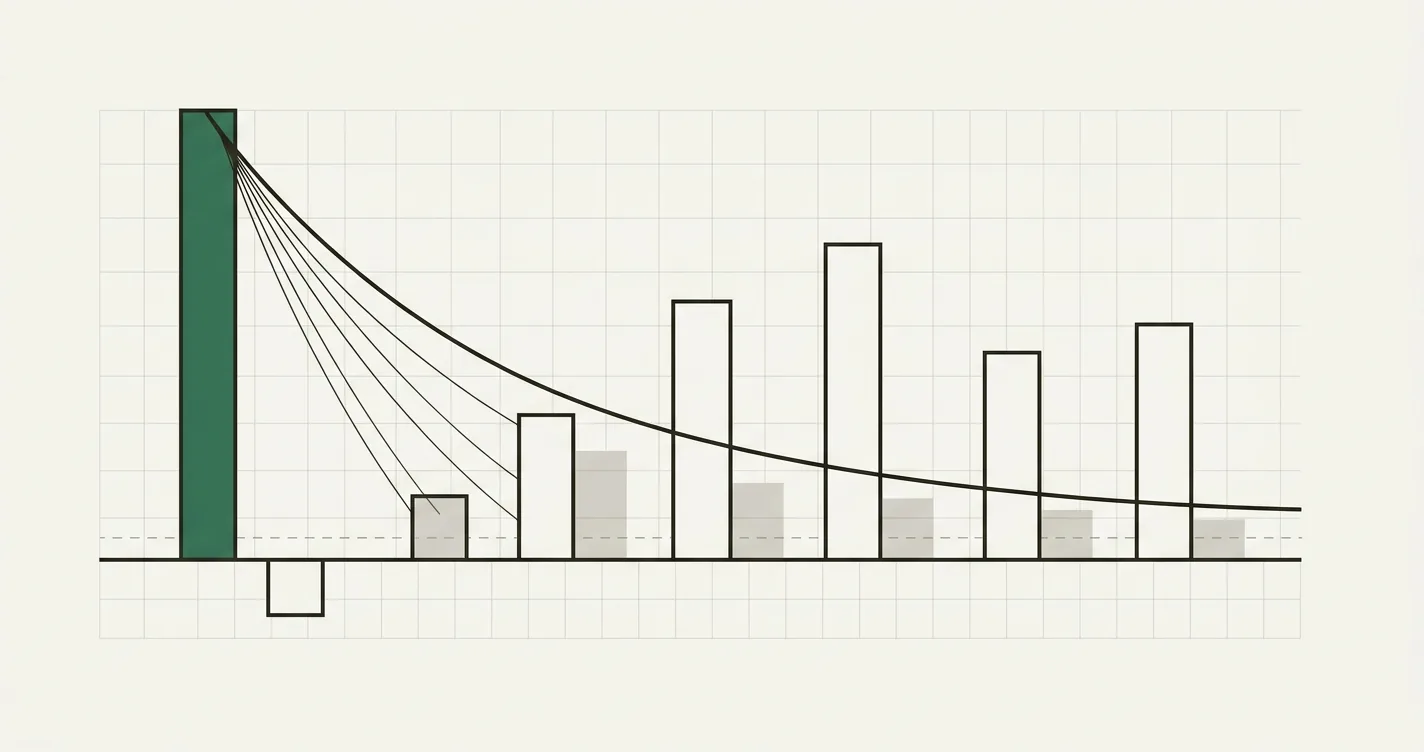
The net present value decision rule, from raw cash flows to accept or reject.
The Net Present Value Formula
The NPV formula is:
NPV = Σ [ CFt / (1 + r)^t ] for t = 0 to n
Where:
- CFt - the net cash flow in period
t. Inflows are positive, outflows negative.CF0is almost always the initial investment and is therefore negative. - r - the discount rate per period (per year if your periods are years). This is your hurdle rate, cost of capital, or required return.
- t - the number of whole periods between today and the cash flow. Today is
t = 0. - n - the final period in the forecast.
Because (1 + r)^0 = 1, the period-0 cash flow is never discounted - it already sits in today's dollars. So the formula is often written to separate it out:
NPV = CF0 + Σ [ CFt / (1 + r)^t ] for t = 1 to n
The discount factor
The term 1 / (1 + r)^t is the discount factor for period t - the present value of one dollar received t periods from now. Every discounting method, from a back-of-envelope NPV to a full DCF, is just this factor applied cash flow by cash flow. At a 10% discount rate:
| Period (t) | Discount factor 1 / (1.10)^t |
|---|---|
| 1 | 0.909091 |
| 2 | 0.826446 |
| 3 | 0.751315 |
| 4 | 0.683013 |
| 5 | 0.620921 |
Notice the factor shrinks each year: a dollar in year 5 is worth only about 62 cents today at a 10% rate. The higher the rate, the faster the decay, and the more a project's value depends on its near-term cash flows.
Worked Example: NPV of a Five-Year Project
A company is considering a piece of equipment that costs $500,000 today and is expected to generate the following net cash inflows:
| Assumption | Value |
|---|---|
| Initial investment (t = 0) | $500,000 |
| Year 1 cash inflow | $120,000 |
| Year 2 cash inflow | $150,000 |
| Year 3 cash inflow | $180,000 |
| Year 4 cash inflow | $200,000 |
| Year 5 cash inflow | $160,000 |
| Discount rate (r) | 10% |
Discount each inflow by its period's discount factor, then sum:
| Year (t) | Cash flow | Discount factor (10%) | Present value |
|---|---|---|---|
| 1 | $120,000 | 0.909091 | $109,090.91 |
| 2 | $150,000 | 0.826446 | $123,966.94 |
| 3 | $180,000 | 0.751315 | $135,236.66 |
| 4 | $200,000 | 0.683013 | $136,602.69 |
| 5 | $160,000 | 0.620921 | $99,347.41 |
| Sum of PV of inflows | $604,244.62 |
Now subtract the upfront cost:
NPV = -$500,000 + $604,244.62 = $104,244.62
The NPV is +$104,244.62. At a 10% required return, the project is expected to create about $104k of value beyond recovering its cost and paying investors their 10% - so it clears the hurdle and should be accepted.
As a sanity check, the total undiscounted inflow is $810,000 against a $500,000 cost, so the project is clearly profitable in nominal terms; discounting simply tells you how much of that $310,000 nominal gain survives once you charge a 10% cost of capital against the wait.
How to Calculate NPV in Excel
There are three ways to get NPV out of Excel. They should all agree - and when they do not, one of them is wrong.
Method 1 - Build it by hand (most transparent)
Lay the timeline out explicitly and discount each period with a formula. If B1 holds the rate and the cash flows sit in C2:C6 (years 1–5), with the -500000 in C1:
// Present value of the Year 1 cash flow
= C2 / (1 + $B$1)^1

// Drag across for each year, incrementing the exponent
= C3 / (1 + $B$1)^2
= C4 / (1 + $B$1)^3

// NPV = initial outlay + sum of discounted inflows
= C1 + SUM(D2:D6)
This is the version to use in a model you want auditable: every discount period is visible on the sheet.
Method 2 - The NPV() function (watch the offset)
Excel's built-in function is =NPV(rate, value1, [value2], ...). The critical rule: NPV() assumes the first value occurs at the end of period 1, one period in the future - not today. So you pass it the future cash flows only and add the period-0 investment outside the function:
// Correct: investment in C1 is added outside NPV()
= C1 + NPV(B1, C2:C6)

// Returns 104,244.62 -- matches the hand calculation
NPV(B1, C2:C6) discounts the five inflows and returns $604,244.62; adding the -500,000 in C1 gives $104,244.62.
Method 3 - XNPV() for irregular dates
When cash flows do not fall exactly one year apart, use =XNPV(rate, values, dates). Unlike NPV(), the values range includes the period-0 cash flow, and each flow is discounted from the first date on an actual/365 basis:
// A2:A7 = dates, B2:B7 = cash flows (B2 is the -500,000 on the first date)
= XNPV(0.10, B2:B7, A2:A7)
More on XNPV, with a worked example, below.
The #1 Excel NPV Mistake: The One-Period Offset
The single most common NPV error is dropping the initial investment inside the NPV() range. Here is what each version returns for the example above:
| Formula | What Excel assumes | Result | Error vs. correct |
|---|---|---|---|
=C1 + NPV(B1, C2:C6) |
Outlay today, inflows in years 1–5 | $104,244.62 | correct |
=NPV(B1, C1:C6) |
Every cash flow shifted one year later | $94,767.83 | −$9,476.78 (≈ −9%) |
=NPV(B1, C2:C6) |
Inflows only, investment forgotten | $604,244.62 | +$500,000 |
The middle row is the sneaky one. Putting C1:C6 inside NPV() tells Excel the -500,000 happens at the end of year 1, the first inflow at the end of year 2, and so on - the whole schedule slides back a year. The result is the true NPV multiplied by 1 / (1 + r), i.e. 104,244.62 / 1.10 = 94,767.83. At a 10% rate the understatement is about 9%; at 15% it is about 13%. It is large enough to flip a marginal decision but small enough to look plausible, which is why it survives so many models.
Rule of thumb: the number of values inside NPV() should equal the number of future periods. If your project runs 5 years, NPV() gets 5 arguments, and the year-0 cash flow is added on the outside.
NPV with Even Cash Flows: The Annuity Shortcut
When every future cash flow is identical, you do not need to discount them one by one. A level stream is an annuity, and its present value is:
PV = C x [ 1 - (1 + r)^-n ] / r
The bracketed term is the annuity factor. Example: a $380,000 investment returning a flat $90,000 per year for 6 years at an 8% discount rate.
Annuity factor (8%, 6 years) = [ 1 - 1.08^-6 ] / 0.08 = 4.6228797
PV of inflows = $90,000 x 4.6228797 = $416,059.17
NPV = -$380,000 + $416,059.17 = $36,059.17
In Excel, either approach ties out:
// Using NPV() on the six equal inflows
= -380000 + NPV(8%, 90000, 90000, 90000, 90000, 90000, 90000)

// Using PV() for the level annuity (PV returns a negative, so subtract it)
= -380000 - PV(8%, 6, 90000)

// Both return 36,059.17
The project's NPV is +$36,059.17, so it is accepted. The annuity shortcut is handy for quick lease-versus-buy checks, loan comparisons, and any cash flow stream that is genuinely flat.
XNPV: When Cash Flows Do Not Land on Annual Dates
Real projects rarely pay out in exact 12-month intervals. XNPV() handles this by discounting each cash flow on the actual number of days from the first date, divided by 365.
XNPV = Σ [ CFi / (1 + r)^((di - d0) / 365) ]
Example at a 10% annual rate, with the initial outlay on 1 Jan 2026:
| Date | Days from start | Years (days / 365) | Discount factor | Cash flow | Present value |
|---|---|---|---|---|---|
| 2026-01-01 | 0 | 0.000000 | 1.000000 | −$500,000 | −$500,000.00 |
| 2026-07-01 | 181 | 0.495890 | 0.953836 | $130,000 | $123,998.70 |
| 2027-01-01 | 365 | 1.000000 | 0.909091 | $160,000 | $145,454.55 |
| 2027-07-01 | 546 | 1.495890 | 0.867124 | $180,000 | $156,082.27 |
| 2028-01-01 | 730 | 2.000000 | 0.826446 | $210,000 | $173,553.72 |
| 2028-07-01 | 912 | 2.498630 | 0.788088 | $150,000 | $118,213.27 |
| XNPV | $217,302.51 |
The two January dates (t = 1.000000 and t = 2.000000) discount at exactly the annual factors, confirming the day-count math. The July dates fall on fractional years and discount accordingly. Summing the present-value column gives $217,302.51.
// A2:A7 hold the dates, B2:B7 hold the cash flows including the -500,000
= XNPV(0.10, B2:B7, A2:A7)
Note two differences from NPV(): XNPV's range includes the first (period-0) cash flow, and it does not discount that first flow because zero days have elapsed. If you tried to force these six flows onto even annual periods with NPV(), you would misplace the mid-year payments by up to half a year and distort the answer.
Choosing the Discount Rate
The formula is only as good as r. The discount rate should reflect the return investors could earn on an equivalent-risk alternative:
- Whole-company or typical project: use the weighted average cost of capital (WACC) - the blended after-tax cost of the firm's debt and equity.
- Equity-only cash flows: use the cost of equity (from CAPM), since the cash flows already belong to shareholders.
- High-risk or non-core project: add a risk premium above WACC to reflect the extra uncertainty.
Because NPV is so sensitive to this input, never rely on a single rate. Build an NPV profile.
The NPV profile and the link to IRR
An NPV profile plots NPV against a range of discount rates. Using the five-year example's cash flows (−$500,000; $120,000; $150,000; $180,000; $200,000; $160,000):
| Discount rate | NPV |
|---|---|
| 0% | $310,000.00 |
| 5% | $195,735.59 |
| 8% | $138,501.02 |
| 10% | $104,244.62 |
| 12% | $72,734.30 |
| 15% | $30,021.22 |
| 20% | −$30,915.64 |
NPV falls as the discount rate rises, and it crosses zero between 15% and 20% - at approximately 17.3%. That crossover rate is the project's internal rate of return (IRR): the discount rate at which NPV is exactly zero. If your cost of capital is below 17.3%, the project has a positive NPV; above it, negative. For a full comparison of the two metrics - and why NPV wins when they disagree - see NPV vs IRR. For a faster (but cruder) screen that ignores the time value of money entirely, see payback period.
NPV inside a full DCF model
In a discounted cash flow valuation, NPV is the same calculation applied to a company's projected free cash flows, with a terminal value bolted onto the final year. The DCF model template below shows the structure - forecast cash flows, discount factors, present values, and the enterprise-to-equity bridge - with every discount period visible on the sheet.
For the full walkthrough of building one from scratch, see How to Build a DCF Model in Excel.
Common Mistakes to Avoid
- Putting the initial investment inside
NPV(). The function discounts the first value by one full period. Add the year-0 outlay outside the function, or useXNPV(). - Mismatched rate and period. If your cash flows are monthly, the discount rate must be monthly (annual rate ÷ 12, or the compounded equivalent). Feeding an annual rate into a monthly schedule overstates discounting twelvefold.
- Forgetting to subtract the upfront cost.
=NPV(rate, inflows)on its own returns the present value of the benefits, not the net present value. You still owe the year-0 cash outflow. - Using accounting profit instead of cash flow. NPV runs on cash - add back non-cash charges like depreciation, and subtract real cash outflows like CapEx and increases in working capital.
- Double-counting financing. If you discount unlevered free cash flow at WACC, do not also subtract interest and debt repayments - that mixes two frameworks and understates value.
- Trusting one discount rate. A one-point change in
rcan move NPV 15–30%. Always show an NPV profile across a range of rates. - Ignoring cash flows beyond the forecast. If the asset still produces cash after year
n, you need a terminal value; truncating at yearnsilently assumes the business stops. - Comparing NPVs of different-length projects head-to-head. A 3-year and a 10-year project are not directly comparable on raw NPV; use equivalent annual annuity or a common horizon.

Alex Tapio
Founder of Finamodel • Professional Financial Modeller • Ex-Deloitte







