
Pro Forma Financial Statements: A Complete Guide
Key Takeaways
- One model, not three spreadsheets. Credible pro forma financial statements are a single connected model. Net income flows to retained earnings and to cash flow; working capital drives operating cash; ending cash returns to the balance sheet.
- The income statement is the start, not the answer. It tells you profitability, but the cash flow statement reveals whether the plan is actually fundable.
- The balance check is non-negotiable. A live formula confirming Assets = Liabilities + Equity in every period is the fastest way to catch a broken link.
- Drive everything from assumptions. Centralise inputs on one sheet and reference them everywhere. This makes the model auditable and lets you run scenarios in seconds.
- Taper your growth and respect cash. Declining growth rates and an honest accounting of CapEx and working capital keep projections defensible.
- Know which 'pro forma' you mean. Forward-looking projections and 'as-if' transaction statements are different jobs built on the same mechanics - and the latter carries real disclosure rules under Regulation S-X.
- Reconcile to GAAP. Whenever you adjust figures, show the bridge back to the nearest standard measure. Transparency is what separates a useful pro forma from a misleading one.
Ready to build your own? Start from our free 3-statement model template, and if you want the full mechanics behind the links above, read our step-by-step guide to building a 3-statement financial model.
Pro forma financial statements are projected versions of the three core statements: the income statement, the balance sheet, and the cash flow statement. They translate a set of assumptions about growth, margins, and working capital into a forward-looking picture of how a business will earn, what it will own and owe, and how cash will move. This guide explains what pro forma statements are, walks through building a fully linked pro forma income statement, balance sheet, and cash flow statement in Excel, and shows a worked three-year example that ties out to the penny.
Whenever you raise money, apply for a loan, build a budget, or model an acquisition, you are working with pro forma financial statements. The word pro forma is Latin for 'as a matter of form' - these are statements presented in the standard form of real financials, but populated with estimates rather than audited actuals. They are the language investors, lenders, and boards expect when they ask 'what does the plan look like?'
The single most important idea is that a credible set of pro forma statements is not three separate spreadsheets. It is one connected model in which net income, working capital, and cash all flow between the statements automatically. Get the links right and the balance sheet balances on its own; get them wrong and you have three numbers that look plausible but do not reconcile.
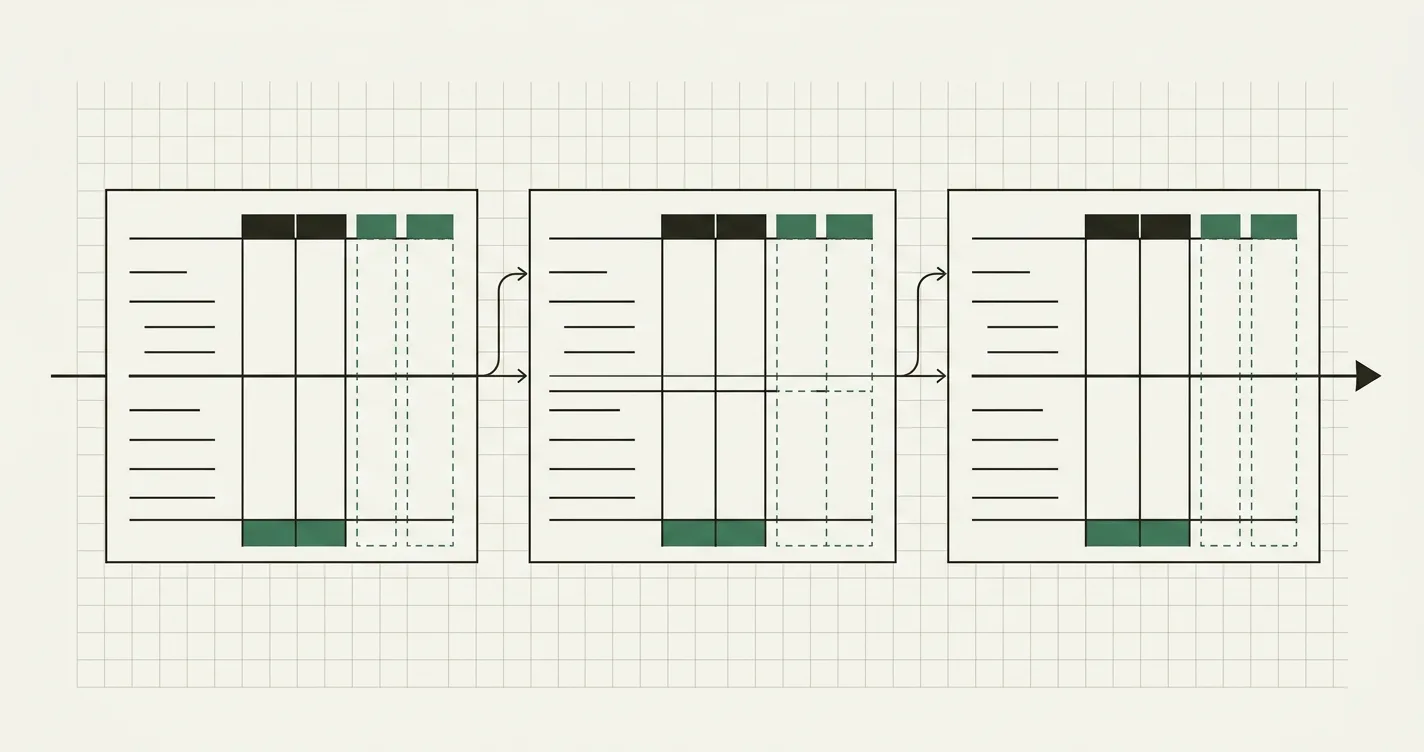
How the three pro forma statements link: assumptions drive the income statement, which feeds both the cash flow statement and the balance sheet, and ending cash closes the loop back to the balance sheet.
What Are Pro Forma Financial Statements?
The term carries two distinct meanings, and confusing them is a common source of error.
1. Forward-looking projections. This is the everyday meaning for founders, FP&A teams, and lenders. You start from the most recent actual results and project the income statement, balance sheet, and cash flow statement forward over three to five years based on explicit assumptions. This is what a bank means when it asks for 'three years of pro forma financials' with a loan application, and what an investor means when they ask for your model.
2. 'As-if' transaction statements. This is the meaning common in M&A and securities filings. Here pro forma statements restate historical results as if a specific event had already occurred: an acquisition, a financing, a divestiture, or a major change in capital structure. The goal is to show the combined or adjusted entity on a comparable basis. Public companies in the United States follow Regulation S-X, Article 11, which prescribes how these adjustments must be presented and reconciled.
This guide focuses primarily on the first meaning - building a forward-looking, fully linked set of pro forma statements - because that is the foundation. The transaction case is a specialised application of the same mechanics, covered briefly near the end.
In every case, the defining feature is the same: pro forma numbers are estimates, not audited actuals. They should always be accompanied by the assumptions that produced them.
The Three Pro Forma Statements
A complete set has three parts, and each answers a different question:
- Pro forma income statement - How profitable is the business expected to be? Runs from revenue down through COGS, operating expenses, depreciation, interest, and tax to net income.
- Pro forma balance sheet - What does the business own and owe at each point in time? Lists assets, liabilities, and equity, and must satisfy the accounting identity Assets = Liabilities + Equity.
- Pro forma cash flow statement - Where does the cash actually go? Reconciles net income to the change in cash across operating, investing, and financing activities.
The links between them are what make the model trustworthy:
- Net income from the income statement flows to two places - into retained earnings on the balance sheet, and to the top of the cash flow statement.
- Working-capital changes (receivables, inventory, payables) on the balance sheet drive operating cash flow.
- Ending cash from the cash flow statement becomes the cash line on the balance sheet.
If you have not yet built a connected model end-to-end, start with our deeper walkthrough on building a 3-statement financial model - the pro forma case here is that same machinery pointed at the future.
Building the Pro Forma Income Statement
The pro forma income statement is the natural starting point because its output - net income - feeds the other two statements. The golden rule is to drive every line from an assumption on a dedicated Assumptions sheet, never to hardcode a number into the statement itself.
We will value a mid-sized products company. Last year (Year 0) it generated $20.0M of revenue. Our forecast assumptions are:
| Assumption | Value |
|---|---|
| Year 0 Revenue (actual) | $20.0M |
| Revenue growth (Y1, Y2, Y3) | 15%, 12%, 10% |
| COGS as % of revenue | 55% (45% gross margin) |
| SG&A as % of revenue | 28% |
| Depreciation and amortization as % of revenue | 4% |
| Interest expense (flat) | $0.6M |
| Tax rate | 25% |
Each forecast year grows off the prior year. In Excel, the first projected year references the last actual:
// Pro forma revenue: Year 1 grows off Year 0 actual
= Y0_Revenue * (1 + Assumptions!$B$3)

// COGS driven as a percentage of revenue
= Revenue * Assumptions!$B$4

// Gross profit
= Revenue - COGS

// EBIT
= Gross_Profit - SGandA - DandA

// Net income
= (EBIT - Interest) * (1 - Assumptions!$B$8)
Applying these assumptions produces the pro forma income statement below. Note how the percentage drivers keep the structure consistent across years - gross margin holds at 45% and the cost ratios are stable, which is exactly what a reviewer expects to see.
| Income Statement ($M) | Y0 Actual | Y1 PF | Y2 PF | Y3 PF |
|---|---|---|---|---|
| Revenue | 20.0 | 23.0 | 25.8 | 28.3 |
| Revenue growth | - | 15% | 12% | 10% |
| COGS (55%) | 11.0 | 12.7 | 14.2 | 15.6 |
| Gross profit | 9.0 | 10.4 | 11.6 | 12.8 |
| Gross margin | 45% | 45% | 45% | 45% |
| SG&A (28%) | 5.6 | 6.4 | 7.2 | 7.9 |
| D&A (4%) | 0.8 | 0.9 | 1.0 | 1.1 |
| EBIT | 2.6 | 3.0 | 3.3 | 3.7 |
| Interest | 0.6 | 0.6 | 0.6 | 0.6 |
| Pre-tax income | 2.0 | 2.4 | 2.7 | 3.1 |
| Tax (25%) | 0.5 | 0.6 | 0.7 | 0.8 |
| Net income | 1.5 | 1.8 | 2.1 | 2.3 |
Net income grows from $1.5M to $2.3M over the forecast - but profit is not cash, and the income statement alone tells you nothing about whether the company can fund that growth. For that, we need the balance sheet and cash flow statement.
Building the Pro Forma Balance Sheet
The balance sheet captures what the business owns and owes at a point in time. Most of its lines are driven by operating assumptions, with two special items - retained earnings and cash - that connect it to the other statements.
The working-capital lines are typically driven by activity ratios expressed in days:
// Accounts receivable from Days Sales Outstanding (DSO)
= Revenue * (DSO_Days / 365)

// Inventory from Days Inventory Outstanding (DIO)
= COGS * (DIO_Days / 365)

// Accounts payable from Days Payable Outstanding (DPO)
= COGS * (DPO_Days / 365)

// Net PP&E roll-forward
= PPE_Opening + CapEx - Depreciation

// Retained earnings roll-forward
= RE_Opening + Net_Income - Dividends
For our worked example we add these balance-sheet drivers: DSO of 45 days, DIO of 60 days, DPO of 40 days, CapEx equal to 5% of revenue, debt held flat at $10.0M, and no dividends. Year 0 opening balances are cash of $3.0M and net PP&E of $8.0M.
Working through Year 1 (Revenue $23.0M, COGS $12.7M, Net income $1.79M):
- Accounts receivable = $23.0M × 45 / 365 = $2.84M
- Inventory = $12.65M × 60 / 365 = $2.08M
- Accounts payable = $12.65M × 40 / 365 = $1.39M
- Net PP&E = $8.00M + (5% × $23.0M CapEx) − $0.92M depreciation = $8.00M + $1.15M − $0.92M = $8.23M
- Retained earnings (within equity) = $4.07M + $1.79M = $5.86M
- Cash = the ending balance from the cash flow statement (computed in the next section) = $4.10M
Working capital is the engine that turns profit into a cash need, so it pays to size it deliberately rather than guess. The calculator below lets you sanity-check how receivables, inventory, and payables combine into a net working-capital requirement before you wire it into the balance sheet:
Laying out the full balance sheet for Year 0 and Year 1:
| Balance Sheet ($M) | Y0 | Y1 | Driver |
|---|---|---|---|
| Cash | 3.00 | 4.10 | Plug from cash flow statement |
| Accounts receivable | 2.47 | 2.84 | DSO 45 days |
| Inventory | 1.81 | 2.08 | DIO 60 days |
| Net PP&E | 8.00 | 8.23 | Opening + CapEx − depreciation |
| Total assets | 15.28 | 17.25 | |
| Accounts payable | 1.21 | 1.39 | DPO 40 days |
| Debt | 10.00 | 10.00 | Held flat |
| Equity | 4.07 | 5.86 | Opening + net income |
| Total liabilities and equity | 15.28 | 17.25 |
Both sides total $17.25M in Year 1, so the balance check is zero. Critically, you do not force this with a plug typed into the cash line - cash arrives from the cash flow statement, equity arrives from net income, and the identity holds because the links are correct. The balance check is the single most valuable formula in the entire model:
// Balance check - must equal zero in every column
= Total_Assets - (Total_Liabilities + Total_Equity)
The Pro Forma Cash Flow Statement
The cash flow statement reconciles net income to the actual change in cash. The indirect method - standard in financial modelling - starts from net income, adds back non-cash charges like depreciation, and adjusts for changes in working capital and for investing and financing flows.
// Cash from operations (indirect method)
= Net_Income + DandA
  - Increase_in_AR - Increase_in_Inventory + Increase_in_AP

// Net change in cash
= Cash_From_Operations + Cash_From_Investing + Cash_From_Financing
For Year 1, the working-capital changes come straight off the balance sheet: receivables rose $0.37M, inventory rose $0.27M, and payables rose $0.18M. An increase in an asset uses cash; an increase in a liability provides it.
| Cash Flow Statement - Year 1 ($M) | Amount |
|---|---|
| Net income | 1.79 |
| + Depreciation and amortization | 0.92 |
| − Increase in accounts receivable | (0.37) |
| − Increase in inventory | (0.27) |
| + Increase in accounts payable | 0.18 |
| Cash from operations | 2.25 |
| − CapEx | (1.15) |
| Cash from investing | (1.15) |
| Debt drawdown / (repayment) | 0.00 |
| Dividends | 0.00 |
| Cash from financing | 0.00 |
| Net change in cash | 1.10 |
| Beginning cash | 3.00 |
| Ending cash | 4.10 |
That $4.10M ending cash is exactly the figure that lands on the Year 1 balance sheet - proof the three statements are wired together. Notice the story the cash flow statement tells that the income statement hides: the company earned $1.79M of net income but only grew cash by $1.10M, because $0.46M was absorbed by growing working capital and $1.15M went to CapEx. That gap between profit and cash is precisely why pro forma statements must be built as a connected set.
Pro Forma Statements for Transactions
The second meaning of pro forma - 'as-if' transaction statements - reuses the same mechanics but answers a different question: what would the financials look like if this deal had already happened?
Typical adjustments include:
- Acquisitions: Combine the acquirer and target income statements, layer in financing (new debt and its interest), eliminate intercompany items, and add purchase-accounting effects such as incremental depreciation and amortisation of acquired intangibles.
- Financings: Show the balance sheet as if a new debt or equity raise had closed - more cash, more debt or shares, and the resulting change in interest expense.
- Divestitures: Remove the disposed unit's contribution to revenue, costs, and assets.
For public companies, these presentations are governed by Regulation S-X, Article 11, which limits adjustments to those that are directly attributable to the transaction, factually supportable, and (for the income statement) expected to have a continuing impact. The same discipline applies even when you are not filing with a regulator: every adjustment should be traceable to a clear, defensible assumption.
Pro Forma vs GAAP - A Caution
Because pro forma figures often add back one-time, non-cash, or 'non-recurring' charges, they can flatter performance relative to GAAP. A company might report a GAAP net loss but a positive 'pro forma' or 'adjusted' profit after excluding stock-based compensation, restructuring costs, and acquisition expenses.
These adjustments can be legitimate, but they can also be abused. The guardrails:
- Always reconcile pro forma figures back to the nearest GAAP measure.
- Disclose every adjustment and the reason for it.
- Be sceptical of 'adjusted EBITDA' that strips out costs which clearly recur.
For projections, the equivalent discipline is to anchor your starting point in audited actuals and to make your assumptions explicit and conservative.
Common Mistakes to Avoid
- Hardcoding instead of linking. Typing numbers directly into the statements breaks the chain of logic. Every line should reference an assumption or another statement so a single input change ripples through correctly.
- Forgetting working capital in the cash flow statement. The classic error: receivables and inventory grow on the balance sheet, but the change never flows to operating cash. The result is a balance sheet that will not balance.
- Plugging cash to force a balance. If you type a number into the cash line to make the balance check zero, you have hidden an error rather than fixed it. Cash must come from the cash flow statement.
- Never-tapering growth. Compounding 25% revenue growth for ten straight years produces a fantasy. Growth rates should decline toward a sustainable long-run figure.
- Ignoring the cash cost of growth. Profitable companies routinely run out of cash because CapEx, working capital, and debt repayment consume more than operations generate. The pro forma cash flow statement is what surfaces this.
- Aggressive adjustments without reconciliation. Presenting 'adjusted' profit that quietly excludes recurring costs, with no bridge back to GAAP, destroys credibility with any serious reviewer.
- No live balance check. Without a formula that flags a non-zero difference between assets and liabilities-plus-equity, errors go undetected until someone else finds them.

Alex Tapio
Founder of Finamodel • Professional Financial Modeller • Ex-Deloitte







