
Working Capital Model: Excel Guide
Key Takeaways
- Working capital is the cash trapped in operations. Net working capital = current assets - current liabilities; the operating version that matters for forecasting is AR + inventory - AP.
- Model it with DSO, DIO, and DPO. Drive each balance off an income-statement line and a days assumption: AR = Revenue x DSO / 365, Inventory = COGS x DIO / 365, AP = COGS x DPO / 365.
- The cash conversion cycle (DSO + DIO - DPO) is the headline metric. A shorter cycle frees cash; a negative cycle means suppliers and customers finance the business.
- The change in working capital is what hits cash. An increase is a use of cash (negative in the cash flow statement); a decrease is a source. Get the sign right.
- Growth consumes working capital. In the worked example, the business had to fund $3.1M–$3.2M of extra working capital every year just to support revenue growth - cash that never appears on the income statement.
- Three levers free cash: collect receivables faster (DSO), turn inventory faster (DIO), and stretch payables (DPO). Each 10-day improvement moves the cycle and releases real cash.
- Judge negative working capital against the business model. For a subscription or cash-retail business, a negative cycle is a structural strength, not a distress signal.
For the broader context of how working capital plugs into a complete model, read our 3-statement financial model guide, and download the free working capital model template to start from a working build.
Working capital is the cash a business ties up in the gap between paying for what it sells and getting paid for it. In a financial model, working capital is where a profitable company can still run out of cash: grow fast, and receivables and inventory swell faster than payables, draining the very cash the growth was supposed to generate. This guide shows how to model net working capital in Excel with the DSO, DIO, and DPO drivers, how to compute the cash conversion cycle, and how the change in working capital flows into the cash flow statement - with a fully worked three-year forecast you can rebuild cell by cell.
Net working capital is deceptively simple to define and easy to get wrong in a model. Define it as a static balance-sheet subtraction and it just sits there; the moment you want to forecast it - or ask "how much cash does growth consume?" - you need a driver-based approach. That means tying receivables, inventory, and payables to the income statement through three ratios: Days Sales Outstanding (DSO), Days Inventory Outstanding (DIO), and Days Payable Outstanding (DPO). Get those right and your working capital model self-adjusts as revenue and margins move.
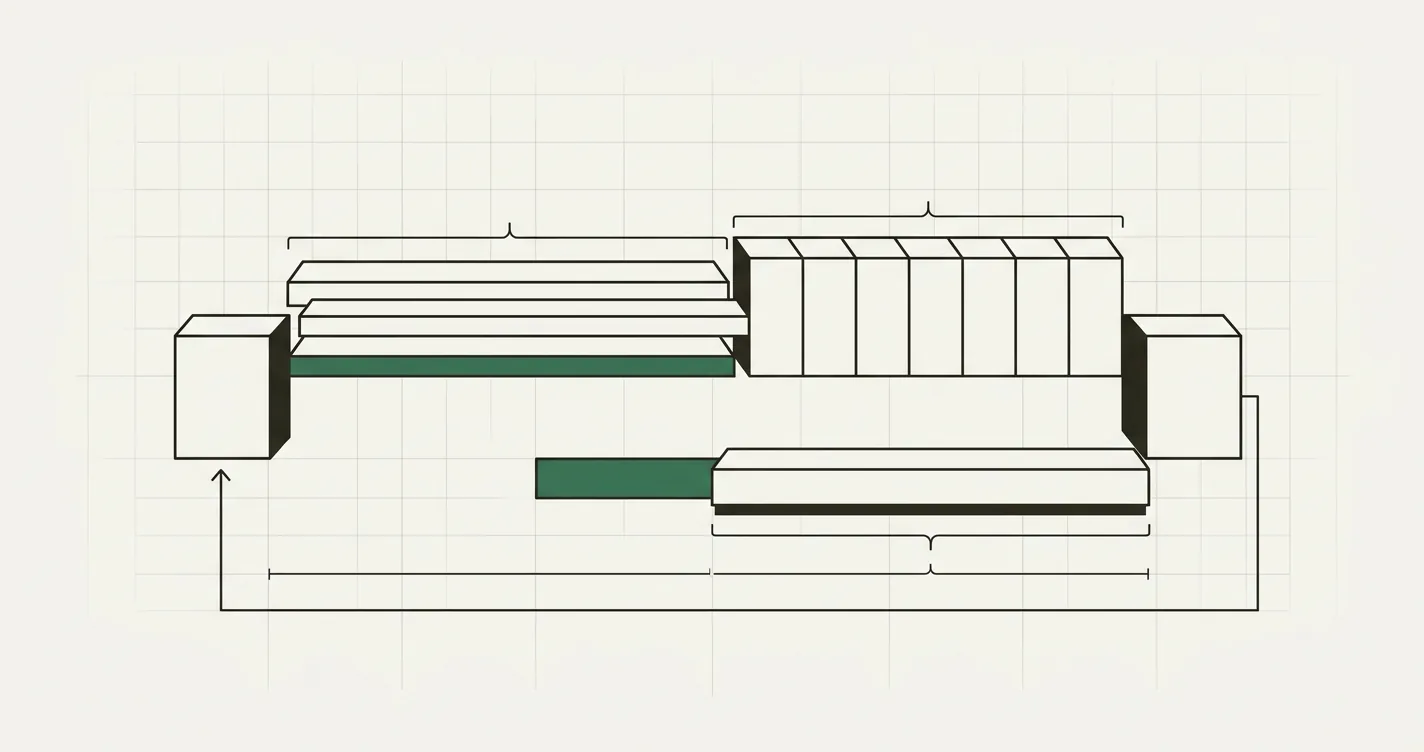
How a driver-based working capital model flows from revenue and COGS all the way to the cash flow statement.
What Is Working Capital?
At its simplest, working capital is the difference between a company's current assets and its current liabilities:
Working Capital = Current Assets - Current Liabilities
Current assets are things expected to turn into cash within a year - cash itself, accounts receivable (AR), inventory, and other short-term assets. Current liabilities are obligations due within a year - accounts payable (AP), short-term debt, and other accruals. Net working capital is just another name for the same figure, emphasising that it is a net position.
Positive working capital means current assets exceed current liabilities: the company can cover its short-term obligations from short-term resources. Negative working capital means the opposite - which, depending on the business model, can be a warning sign or a sign of exceptional efficiency (more on that below).
For modelling purposes, though, the raw balance-sheet definition is too broad. It lumps in cash and short-term debt, which are financing items, not operating ones. That is why modellers separate out operating working capital.
Operating Working Capital
Operating working capital strips out cash and any interest-bearing debt, leaving only the items that move with the day-to-day operations of the business:
Operating Working Capital = Accounts Receivable + Inventory - Accounts Payable
This is the number that matters for forecasting, because these three line items scale directly with revenue and cost of goods sold (COGS). Cash and debt are outputs of the model - driven by financing decisions - not operating drivers. When people talk about "change in working capital" in a discounted cash flow or a 3-statement model, they almost always mean the change in operating working capital.
Working Capital and Liquidity Ratios
Before forecasting, it helps to read a company's current working-capital position and its liquidity. Three ratios do most of the work:
- Current ratio = Current Assets / Current Liabilities. Above 1.5x is generally comfortable; below 1.0x means current liabilities exceed current assets.
- Quick ratio (acid test) = (Current Assets - Inventory) / Current Liabilities. Strips out inventory, which is the least liquid current asset. Above 1.0x is strong.
- Cash ratio = Cash / Current Liabilities. The most conservative test - can the company cover its short-term obligations with cash alone?
Use the calculator below to enter a balance sheet and see working capital and all three liquidity ratios update instantly.
These ratios describe a snapshot. To forecast how working capital evolves, you need the cash conversion cycle.
The Cash Conversion Cycle: DSO, DIO, DPO
The cash conversion cycle (CCC) measures how many days of cash a company has tied up in operations. It is built from three activity metrics:
- Days Sales Outstanding (DSO): how long, on average, customers take to pay.
DSO = Accounts Receivable / Revenue x 365. - Days Inventory Outstanding (DIO): how long inventory sits before it is sold.
DIO = Inventory / COGS x 365. - Days Payable Outstanding (DPO): how long the company takes to pay its suppliers.
DPO = Accounts Payable / COGS x 365.
Put them together and you get the cash conversion cycle:
Cash Conversion Cycle = DSO + DIO - DPO
The intuition: the company holds inventory for DIO days and collects from customers DSO days after the sale, but it delays paying suppliers by DPO days. The net number of days that cash is locked up is DSO + DIO - DPO. A shorter cycle means less cash trapped in operations; a negative cycle means suppliers effectively finance the business.
Typical ranges vary widely by industry: DSO of 30-60 days is common in B2B, near zero for cash retailers; DIO can run from under 20 days for fast-moving goods to 90+ for heavy manufacturing; DPO is usually 30-60 days depending on supplier terms.
How to Model Working Capital in Excel
The driver-based approach inverts the ratio formulas above. Instead of deriving DSO from a known AR balance, you assume DSO and use it to forecast AR. Each balance is a function of an income-statement line and a days assumption:
// Accounts Receivable, driven by DSO and forecast revenue
= Revenue * DSO / 365

// Inventory, driven by DIO and forecast COGS
= COGS * DIO / 365

// Accounts Payable, driven by DPO and forecast COGS
= COGS * DPO / 365

// Operating Working Capital
= AR + Inventory - AP

// Change in Working Capital (a use of cash if positive)
= OWC_Current - OWC_Prior

// Cash Conversion Cycle in days
= DSO + DIO - DPO
As always, the days assumptions (DSO, DIO, DPO) live on a dedicated Assumptions sheet and every balance references them - never hardcode a ratio inside a formula. A cleaner version referencing the assumptions sheet looks like this:
// AR in period B, referencing revenue on row 3 and DSO on the Assumptions sheet
= B3 * Assumptions!$B$8 / 365
The live model below is built exactly this way - DSO, DIO, and DPO drive AR, inventory, and AP, and the cash conversion cycle and cash impact recalculate automatically.
Worked Example: A Three-Year Working Capital Forecast
Let's forecast operating working capital for a growing products business. Start with the assumptions:
| Assumption | Value |
|---|---|
| COGS as % of Revenue | 60% |
| DSO (Days Sales Outstanding) | 45 days |
| DIO (Days Inventory Outstanding) | 60 days |
| DPO (Days Payable Outstanding) | 40 days |
| Days in year | 365 |
Revenue grows from a $100M base, with COGS held at 60% of revenue:
| Line | Historical (Y0) | Year 1 | Year 2 | Year 3 |
|---|---|---|---|---|
| Revenue | $100.0M | $120.0M | $140.0M | $160.0M |
| COGS (60%) | $60.0M | $72.0M | $84.0M | $96.0M |
Now apply the three drivers. Take Year 1 as a checkpoint:
AR (Y1)  = $120M x 45 / 365 = $14.8M
Inv (Y1) = $72M  x 60 / 365 = $11.8M
AP (Y1)  = $72M  x 40 / 365 = $7.9M
Operating Working Capital (Y1) = 14.8 + 11.8 - 7.9 = $18.7M
Rolling that across every period gives the full working capital schedule:
| Line | Driver | Y0 | Y1 | Y2 | Y3 |
|---|---|---|---|---|---|
| Accounts Receivable | Revenue x 45 / 365 | $12.3M | $14.8M | $17.3M | $19.7M |
| Inventory | COGS x 60 / 365 | $9.9M | $11.8M | $13.8M | $15.8M |
| Accounts Payable | COGS x 40 / 365 | $6.6M | $7.9M | $9.2M | $10.5M |
| Operating Working Capital | AR + Inv - AP | $15.6M | $18.7M | $21.9M | $25.0M |
| OWC as % of Revenue | 15.6% | 15.6% | 15.6% | 15.6% | |
| Change in Working Capital | OWC - Prior OWC | - | $3.1M | $3.2M | $3.1M |
| Cash Conversion Cycle | DSO + DIO - DPO | 65 | 65 | 65 | 65 |
Two things stand out. First, because the days assumptions and the COGS ratio are held constant, operating working capital stays at a steady 15.6% of revenue - a useful sanity check, and the reason many quick models just forecast working capital as a flat percentage of sales. Second, growth is not free: the business must fund $3.1M–$3.2M of additional working capital every year just to stand still operationally. That cash never shows up on the income statement, which is why a profitable company can still be cash-hungry.
The cash conversion cycle holds at 65 days (45 + 60 - 40): every dollar of activity is locked up for roughly two months before it comes back as cash.
Change in Working Capital and the Cash Flow Statement
The single most important output of a working capital model is the change in working capital, because that - not the balance itself - hits cash. The rule is simple but trips people up:
- An increase in operating working capital is a use of cash (negative in the cash flow statement).
- A decrease in operating working capital is a source of cash (positive).
Why? If receivables rise, you have booked revenue but not yet collected the cash - cash is tied up. If inventory rises, you have spent cash on goods not yet sold. If payables rise, you are holding on to cash you owe suppliers - a source of cash. Netting these gives the change in working capital.
In our example, working capital rose by $3.1M in Year 1, so the cash flow statement shows negative $3.1M in the operating section:
Cash Flow from Operations (extract), Year 1
  Net Income .......................  (from income statement)
  + Depreciation & Amortisation ....  (non-cash add-back)
  - Increase in Working Capital ....  -$3.1M
  = Cash Flow from Operations
This is exactly how working capital links into an integrated model. For the full mechanics of how the three statements connect, see our guide to building a 3-statement financial model. The same change-in-working-capital line also appears in a DCF, where it reduces unlevered free cash flow.
Optimizing Working Capital: The Three Levers
Because working capital ties directly to DSO, DIO, and DPO, there are exactly three levers to pull to free up cash. Using the Year 3 base (Revenue $160M, COGS $96M), here is the cash impact of a 10-day improvement in each, holding the others constant:
| Lever | Move | Cash-flow formula | Cash freed | CCC after |
|---|---|---|---|---|
| Collect receivables faster | DSO 45 → 35 | Revenue x 10 / 365 = 160 x 10 / 365 | $4.4M | 55 days |
| Turn inventory faster | DIO 60 → 50 | COGS x 10 / 365 = 96 x 10 / 365 | $2.6M | 55 days |
| Stretch supplier terms | DPO 40 → 50 | COGS x 10 / 365 = 96 x 10 / 365 | $2.6M | 55 days |
Each 10-day lever shortens the cash conversion cycle from 65 to 55 days. The receivables lever frees the most cash because it is driven by revenue (the larger base); the inventory and payables levers are driven by the smaller COGS base, so a 10-day move is worth less.
Pull all three at once and the cycle compresses from 65 days to 35 days (35 + 50 - 50), releasing roughly $9.6M of cash (4.4 + 2.6 + 2.6) - a one-time cash windfall equal to more than a third of the entire working-capital balance. That is why treasurers obsess over collections, inventory turns, and supplier terms: working capital is often the cheapest source of cash a company has.
To see how a single lever plays out, take the receivables move on its own. Cutting DSO from 45 to 35 days in Year 3 drops accounts receivable from $19.7M to $15.3M (160 x 35 / 365), so operating working capital falls from $25.0M to $20.6M - a $4.4M cash release, with no change to revenue or margin.
Negative Working Capital: Not Always a Red Flag
Conventional wisdom says negative working capital is dangerous - current liabilities exceed current assets, so the company might not meet its obligations. For a struggling manufacturer, that is true. But for certain business models, negative operating working capital is a structural advantage.
Consider a subscription business or a cash retailer: customers pay upfront (DSO near zero), inventory turns quickly (low DIO), and suppliers are paid on 60-day terms (high DPO). The cash conversion cycle goes negative:
Cash Conversion Cycle = 5 (DSO) + 20 (DIO) - 60 (DPO) = -35 days
A negative cycle means the business collects from customers before it has to pay suppliers - customers effectively fund operations. When such a company grows, working capital releases cash instead of consuming it. This is the engine behind many high-growth retail and marketplace models. The lesson: never judge working capital in isolation. Judge it against the business model.
Common Mistakes to Avoid
- Confusing net working capital with operating working capital. Including cash and short-term debt in the forecast double-counts financing items that the model derives elsewhere. Forecast operating working capital (AR + inventory - AP) and let cash and debt fall out of the cash flow and financing sections.
- Hardcoding the balances instead of the drivers. Typing a flat AR number kills the model's ability to flex. Drive AR, inventory, and AP off DSO, DIO, and DPO so they respond automatically when revenue or COGS changes.
- Getting the cash-flow sign backwards. An increase in working capital is a use of cash (negative). This is the single most common error - an inverted sign quietly overstates or understates operating cash flow.
- Forgetting the day-count basis. Mixing a 360-day convention in one formula and 365 in another throws every balance off. Pick one (365 is standard) and reference it from the assumptions sheet.
- Assuming working capital scales perfectly with revenue forever. In reality, DSO and DIO drift with scale, seasonality, and negotiating power. A flat percentage-of-sales assumption is fine for a quick model, but a rigorous one flexes the day-count drivers over time.
- Ignoring the cash cost of growth. Fast growth consumes working capital. A model that shows soaring profit but no working-capital drag is almost always wrong - check that the change-in-working-capital line grows with revenue.

Alex Tapio
Founder of Finamodel • Professional Financial Modeller • Ex-Deloitte







