CHChiper Financial Model
Fintech Startup Financials (Free Excel Download)
B2B e-commerce platform digitizing inventory replenishment for independent corner stores (tiendas) in Latin America.



professionals from Deloitte
Used by professionals from






About this model
Chiper digitises inventory replenishment for independent corner stores across Latin America. The B2B platform lets tiendas order fast-moving consumer goods and brings procurement, delivery, and eventually financial services into one workflow.
Unlike a commission marketplace, Chiper buys and resells inventory, so merchandise sales and fulfilment economics are central. The research documents roughly $50 average order value, low double-digit gross margin, and a long-term goal of improving contribution profit per order.
The model should forecast active stores, order frequency, average order value, and gross sales, then deduct product cost and fulfilment cost per order. Credit, insurance, payments, or private-label products should be added as separate future revenue lines rather than masking the core wholesale margin.
A turnkey financial model
Live formulas, no hardcoded values
Outputs are driven by live formulas, so the workbook updates from its assumptions instead of relying on hardcoded results.
All assumptions in one tab
Inputs are clearly marked in the Assumptions tab and separated from calculations, making it clear what to change and what to leave intact.
Statements always balancing
For integrated-statement models, the balance sheet, cash flow, and supporting schedules tie through properly.
Distinct schedules for clarity
Debt, working capital, taxes, and cash flow can get messy quickly. We group calculations in clear schedules, not across disconnected tabs.
No hidden macros or external links
There are no unexplained external workbook links or macros to undermine auditability or portability.
Changes flow through the model
Update a key driver and see the impact carry through the forecast, financing, and return outputs. We never use hardcoded numbers in formulas.
About Chiper
chiper.co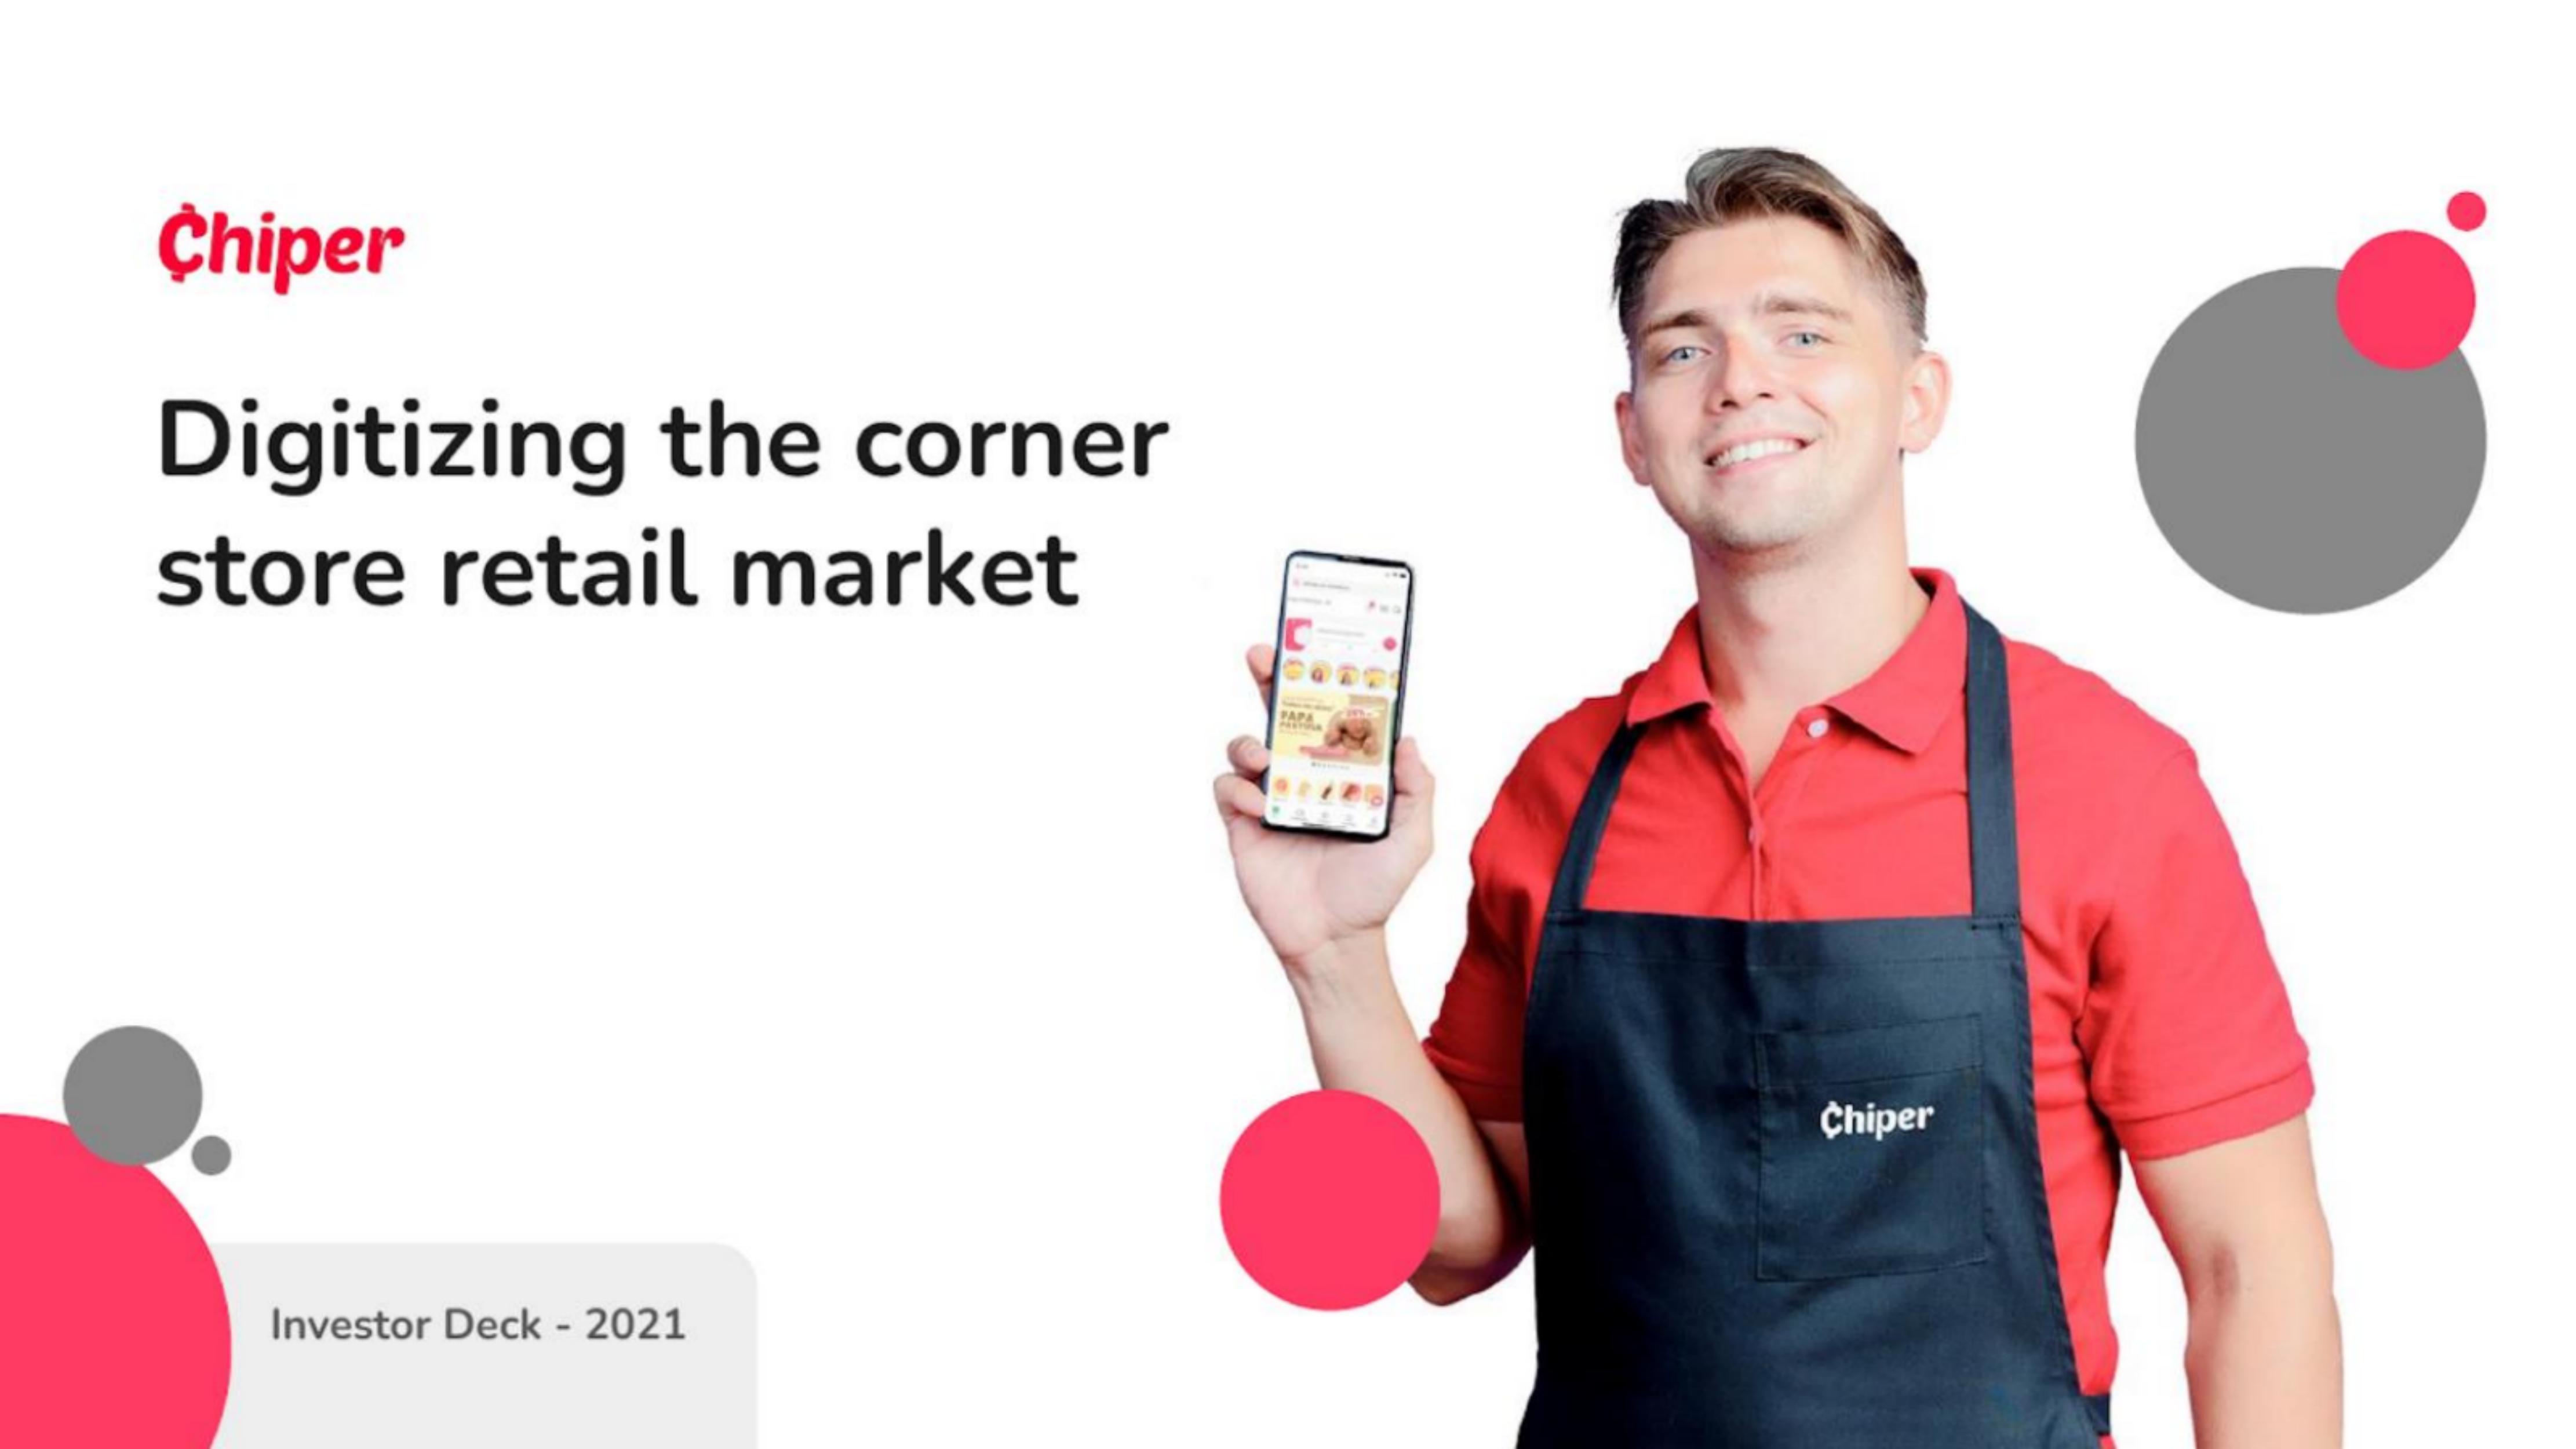
How to build a detailed financial model for Chiper
A complete walkthrough of the business, drivers, and assumptions behind the downloadable Chiper model - distilled from its pitch deck and publicly available information.
Product & value proposition
- Mobile-first ordering app for corner store owners to replenish stock digitally.
- One-stop-shop: 3,000+ FMCG products, 24h free delivery, prices 5% better than traditional wholesale channels.
- Replaces 20+ daily supplier visits and trips to wholesaler markets.
- Supply chain built with machine learning and automation to reduce fulfilment costs and increase margin.
- Future layers: private labels, new categories (consumer electronics, beauty, etc.), and financial services (credit, insurance, payments, remittances).
Market
- LatAm TAM: 3.7M corner stores, $500B total addressable market.
- Three-country sub-TAM (Colombia + Mexico + Brazil): $197B.
- Colombia: $14B, 300,000 stores.
- Mexico: $50B, 800,000 stores.
- Brazil: $133B, 1,000,000 stores.
- LatAm GDP: $6T; mobile internet penetration 67%; internet penetration 70%.
- B2B e-commerce <1% of B2B transactions online in LatAm today.
- Global B2B e-commerce CAGR expected 17.5% through 2027.
- SAM/SOM: Not explicitly stated in deck.
- Source cited: McKinsey, Euromonitor 2018; SAT Mexico; Fenalco.
Revenue model
- Primary: Product sales - buy FMCG goods from manufacturers/distributors, resell to corner stores at a markup. Revenue = GMV (each order is a direct sale, not a commission take-rate).
- AOV: $50.10 per order.
- Gross profit per order: $5.30 (~10.6% gross margin implied).
- Fulfillment costs per order: $4.30.
- Contribution profit per order: $1.00 current; $3.00 long-term target.
- Future revenue streams (not yet generating at time of deck): financial services (credit, insurance, payments), private label products, new categories.
- No commission/marketplace take-rate model mentioned - this is a reseller/distributor model.
Traction & metrics
All data as of Sep-21 unless noted.
- Revenue run rate: $65M.
- Revenue growth: 7x Sep-20 vs. Sep-21.
- Monthly active stores: 23,000; 9x Sep-20 vs. Sep-21.
- Quarterly active stores: ~33,000 in Q3-21 (chart y-axis tops ~36,000; bar reaches ~33,000).
- Quarterly active store growth: 10x over trailing 21 months.
- Quarterly sales evolution (USD M, read from bar chart):
- Q3-20: ~$2.5M
- Q4-20: ~$3.5M
- Q1-21: ~$6M
- Q2-21: ~$9.5M
- Q3-21: ~$15M
- 6x growth over last 12 months.
- Orders delivered Q3-21: 278,000.
- Orders CQGR: 91%.
- Quarterly active store series (approximate, from chart):
- Q3-20: ~4,000
- Q4-20: ~7,000
- Q1-21: ~15,000
- Q2-21: ~24,000
- Q3-21: ~33,000
Unit economics
All as of Sep-21:
- AOV (revenue per order): $50.10
- Gross profit per order: $5.30 → implied gross margin ~10.6%
- Fulfillment costs per order: ($4.30) → implied fulfillment cost as % of AOV ~8.6%
- Contribution profit per order: $1.00 (current)
- Long-term unit economics target: $3.00 contribution profit per order, via:
- Gross margin +3% (to ~13.6%) → adds $1.50/order
- Fulfillment cost -1% of AOV → adds $0.50/order
- Orders per store per period: Not explicitly stated (implied: 278,000 orders / ~23,000–33,000 stores in Q3-21 → ~8–12 orders/store/quarter).
Competition / moat
- Deck frames moat as: scale (network of bulk buyers), tech-enabled supply chain (ML/automation), and service levels (24h delivery, widest SKU selection).
- No direct competitor slide. Implicit competitors: traditional FMCG distributor networks, wholesaler markets, and regional peers (e.g., Tiendanube, Mercado Libre B2B, Fami, Justo).
- Corner stores currently manage 20+ daily supplier visits - fragmentation is the status quo.
- Stock-outs cost stores 12–15% in lost sales; price disadvantage ~10% vs. Chiper.
Team & funding ask / use of funds
- Team (47+ years combined experience):
- Jose Bonilla, Co-founder & CEO - 17+ years in tech; co-founder of Imaginamos (incubated Rappi and Chiper).
- Oscar Sarria, Co-founder & COO - 5 years at Quala (major LatAm FMCG) running corner store channel.
- Carolina García, Co-founder & CRO - 15+ years commercial experience in tech; MIT MBA.
- Ricardo Ocampo, Co-founder & CFO - 10+ years finance at Team Foods (FMCG).
- Total team: 468.
- Investors shown: monashees+, Kaszek, Nosara, Tiger Global.
- Use of funds: Not explicitly stated. Inferred from targets: geographic expansion (Brazil), financial services launch, store count growth.
- 2022 targets: $240M revenue run rate; 60,000 monthly active stores; launch Brazil; launch financial services.
- 2023 targets: $430M revenue run rate; 100,000 monthly active stores; 20% store penetration; 50% share of wallet; 1M consumers with ancillary products.
Recommended financial model
- Archetype + why: B2B marketplace / wholesale distributor GMV model with contribution margin waterfall. Revenue is gross sales (reseller, not commission), so the model must carry COGS and track gross margin separately from contribution margin. As financial services launch, a secondary SaaS/fintech revenue stream will need its own module. Best archetype: B2B e-commerce GMV + unit economics roll-up, similar to a DTC/wholesale P&L but store-count-driven rather than consumer-count-driven.
- Forecast horizon & granularity: Monthly for 2022–2023 (to hit the deck's own targets); annual summary for 2024–2025. Q3-21 actuals as the anchor period.
- Key drivers & assumptions:
| Driver | Value |
|---|---|
| Monthly active stores - Q3-21 base | 23,000–33,000 |
| Store growth rate (QoQ) | 10x over 21 months ≈ ~35–40% QoQ blended |
| 2022 MAS target | 60,000 |
| 2023 MAS target | 100,000 |
| Orders per store per quarter | ~8–12 (derived) |
| AOV | $50.10 |
| AOV growth | 2–3% p.a. |
| Gross margin per order | ~10.6% ($5.30 / $50.10) |
| Long-term gross margin target | ~13.6% (+3pp) |
| Fulfillment cost per order | $4.30 |
| Long-term fulfillment cost reduction | 1% of AOV (~$0.50) |
| Contribution margin per order - current | $1.00 |
| Contribution margin per order - long-term | $3.00 |
| Revenue run rate - Q3-21 | $65M |
| Revenue run rate - 2022 target | $240M |
| Revenue run rate - 2023 target | $430M |
| Financial services revenue contribution | $0 in 2022 |
| FX assumption | COP/USD and MXN/USD monthly average |
| Brazil launch | 2022 |
- Scenarios (Base / Bull / Bear):
- Base: Store growth hits 60K MAS by end-2022, $240M run rate. Gross margin improves 1.5pp by end-2023. Fulfillment costs flat.
- Bull: Store growth exceeds 60K (80K by end-2022); AOV expands as higher-value SKUs added; gross margin hits long-term target ($3.00/order) by 2023.
- Bear: Store growth slows to 40K MAS (execution risk on Brazil launch, competitor response); gross margin stays at ~10.6%; fulfillment costs sticky due to logistics inflation.
- Flex variables: MAS growth rate, gross margin improvement pace, fulfillment cost per order, AOV, Brazil ramp speed.
- Required sheets / outputs:
- Assumptions - all drivers in one place, scenario toggles.
- Store Roll-up - monthly active stores, new store adds, churn (implied), store count by country.
- Order Volume - orders per store per month × active stores.
- Revenue & Gross Profit - AOV × orders; gross margin waterfall.
- Contribution Margin Waterfall - gross profit minus fulfillment costs = contribution profit per order, scaled to total orders.
- Opex - G&A, S&M, tech (estimated; not in deck).
- EBITDA / Cash burn - contribution profit minus opex.
- Targets vs. Actuals tracker - 2022 and 2023 deck targets vs. model output.
- Scenario Summary - Base / Bull / Bear on revenue, MAS, contribution profit.
- *(Optional)* Financial Services Module - placeholder for credit/insurance revenue once launched.
Frequently asked
Is the Chiper financial model free?+
Yes. The Chiper model is a free Excel (.xlsx) download with live formulas. Sign up with your email and the workbook is yours to keep, review, and edit.
What's included in the model?+
A 5-year monthly forecast with P&L, cash flow and runway, valuation (exit multiple plus a DCF cross-check), MOIC/IRR returns, and unit economics, with live formulas throughout.
How was this model built?+
It was built from Chiper's pitch deck and publicly available information, then structured to investment-banking standards as a fully editable Excel model.
Can I change the assumptions?+
Yes. You can change assumptions and the live formulas will recalculate in the downloadable Excel model.
Have more financial modelling questions? Contact us

Created by ex-finance professionals
Hey, I’m Alex and I created Finamodel.
Over my years in the finance industry I kept building the same models over and over again. Same structure, same assumptions, different logo. So I started building frameworks to turn them into clean, reusable templates.
Every model here is one I’d actually use for a client, and I personally vet each one before it goes up.
I’m not an expert in every industry, but I’ve built enough models to know what belongs in one. And when something is completely foreign to me, I reach out to my network for experts to work on our models with us.
Having a template library on hand cuts a first build from hours to minutes.
Need help finding your model? You’ll find me in the Finamodel app!
Other Fintech Startup Financial Models
Browse another startup in the same category.
Acin
SaaS and data subscription network for operational risk management at Tier 1 financial institutions

Ageras Group
B2B SME ecosystem - marketplace connecting SMEs with accountants + cloud accounting/payroll software + embedded financial services (lending, factoring, banking)

Airbase
Unified non-payroll spend management platform (corporate cards, AP/bill pay, expense reimbursement, approval workflows) for mid-market companies.

Altruist
Vertically integrated all-in-one platform for registered investment advisors (RIAs) - combining custodial, portfolio management, practice management, and client acquisition tools.
Amenitiz
All-in-one hotel management SaaS platform ("Shopify for hotels") for independent hoteliers - PMS, booking engine, channel manager, website builder, payments, and AI-driven revenue management.

Anrok
SaaS sales tax compliance platform - nexus monitoring, calculation, registration, filing, and remittance - built specifically for SaaS companies.
Arrival
Arrival is an EV manufacturer of commercial vans and buses using proprietary Microfactories and vertically integrated components, going public via SPAC merger with CIIG Merger Corp.

AtoB
AtoB is building financial infrastructure for commercial fleets, starting with a no-fee Visa fleet card for fuel and expanding into payroll, BNPL, and international.


