 Lord of the Trees Financial Model
Climate/Energy Startup Financials (Free Excel Download)
Precision-planting drone operator using proprietary seedpod technology to reforest land at scale for governments, agriculture, and mining companies.



professionals from Deloitte
Used by professionals from






About this model
Lord of the Trees uses precision drones, AI mapping, and organic Seedpods to restore land at scale. It claims a 70% second-year survival rate versus 40% for manual planting, with a drone-based effective cost of about $1 per surviving tree.
The service targets governments, agriculture, and mining restoration projects, with work underway in Australia and Sumatra. Its ambitious strategy assumes two billion trees planted annually, but the stated $1.5 billion target implies $0.75 per tree and conflicts with the quoted cost figure, so contract economics require validation.
The model should bridge seedpods dropped to surviving, billable trees and price them by customer segment. Add a fleet schedule for drones, pilots, maintenance, capex, and depreciation, then model seedpod COGS and project overhead. Carbon-credit income belongs only in an upside case until a contractual monetisation route is evidenced.
A turnkey financial model
Live formulas, no hardcoded values
Outputs are driven by live formulas, so the workbook updates from its assumptions instead of relying on hardcoded results.
All assumptions in one tab
Inputs are clearly marked in the Assumptions tab and separated from calculations, making it clear what to change and what to leave intact.
Statements always balancing
For integrated-statement models, the balance sheet, cash flow, and supporting schedules tie through properly.
Distinct schedules for clarity
Debt, working capital, taxes, and cash flow can get messy quickly. We group calculations in clear schedules, not across disconnected tabs.
No hidden macros or external links
There are no unexplained external workbook links or macros to undermine auditability or portability.
Changes flow through the model
Update a key driver and see the impact carry through the forecast, financing, and return outputs. We never use hardcoded numbers in formulas.
About Lord of the Trees
lordofthetrees.com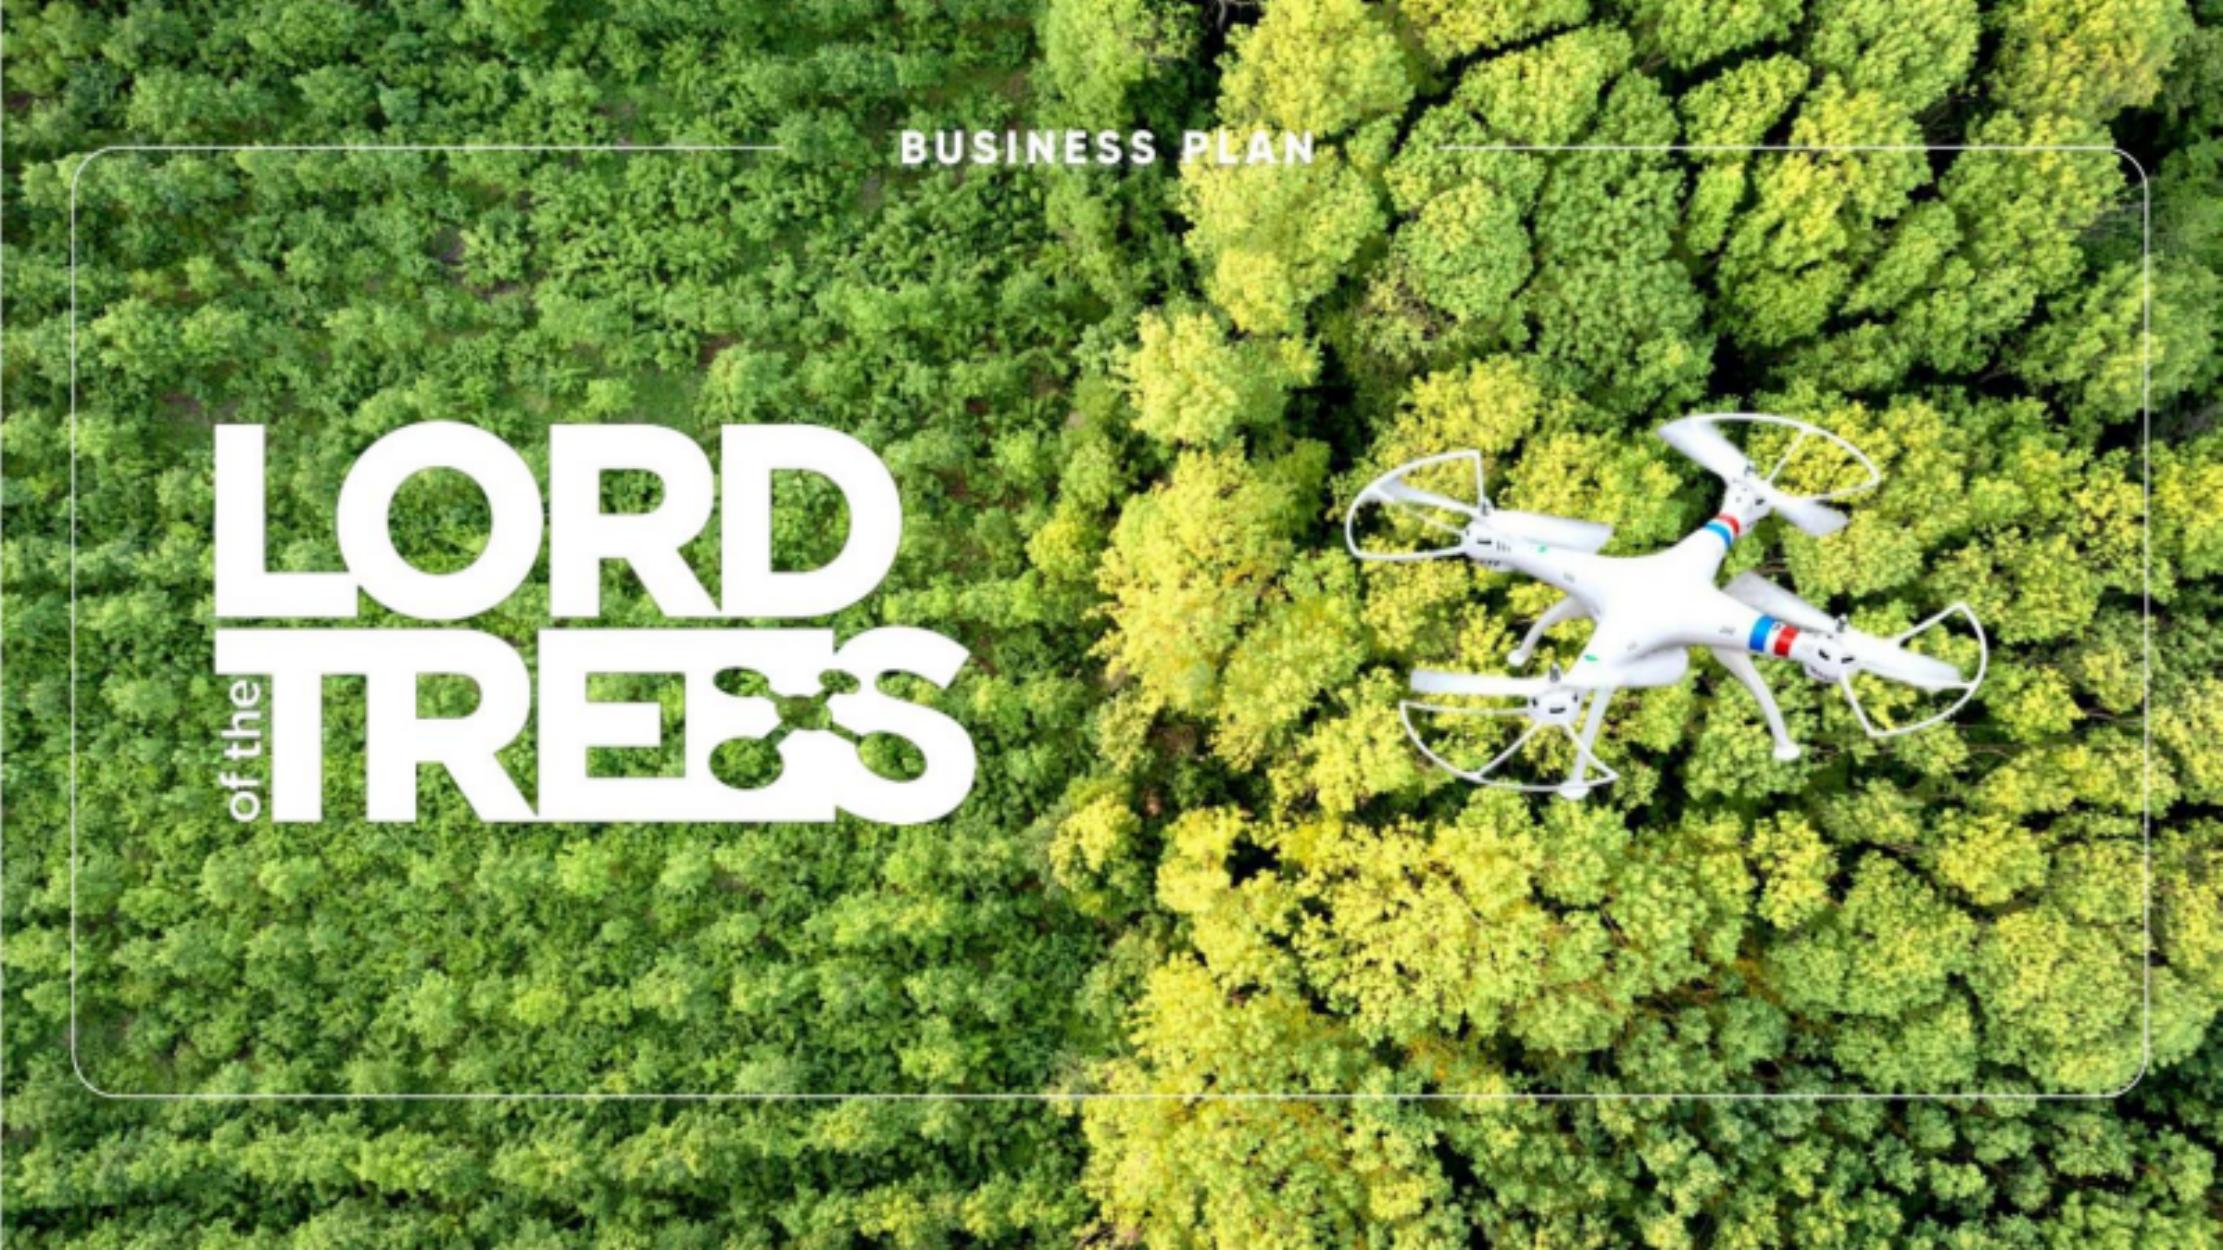
How to build a detailed financial model for Lord of the Trees
A complete walkthrough of the business, drivers, and assumptions behind the downloadable Lord of the Trees model - distilled from its pitch deck and publicly available information.
Product & value proposition
- Precision-planting drones (aviation-grade carbon fibre + magnesium aluminium alloy; 300W rotors; 4m² footprint; 43kph; 3km operating radius; up to 5 drones per pilot).
- Proprietary "Seedpod" - 100% organic capsule mimicking seed/nutrient-rich bird droppings; 18 years of forestry R&D; time-release casing protecting against animals, heat, cold.
- Drone throughput: 2 seedpods/second → 7,200/hour; 1 drone × 22-hour day = 158,400 seeds; 4 drones = 633,600 seeds/day; 4 drones × 2 days = 1,267,200 seeds.
- Seeds-to-day equivalent: 500K seedpods planted per day (multi-drone fleet).
- 14 hectares seeded per hour (vs. 100 manual labourers).
- Survival rate 70% vs. 40% manual (Year 2).
- Effective cost per surviving tree: $1.00 (drone) vs. $2.93 (manual) - 66% cheaper per tree.
- AI mapping, HD cameras, radar sensors for soil/germination analysis and autonomous obstacle avoidance.
- B Corporation certification pending.
Market
- Stated global target: 1 trillion trees to be planted worldwide over next 10 years = 100 billion/year.
- Drone share of that target assumed at 10% = 10 billion trees/year planted by drones.
- Company's target market share: 20% of drone market = 2% of global market = 2 billion trees/year.
- Government/private sector spend on forest conservation: $1B/year.
- Government/private sector spend subsidising/investing in forest-clearing for agriculture: $100B/year.
- No explicit TAM/SAM/SOM breakdown in deck. Market sizing is derived bottom-up from tree-planting volume assumptions, not a dollar addressable-market slide.
Revenue model
- Revenue is per-seedpod/per-tree planted for clients - implied service fee model. No explicit per-unit price stated in deck beyond the cost comparison.
- Implied revenue: $1.5 billion/year target at 2 billion trees/year = $0.75/tree implied revenue.
- Cost to company per surviving tree: $1.00 drone - note this is below the implied $0.75/tree revenue at maturity, suggesting the $1.00 figure is variable cost per seedpod deployed (not per surviving tree) or the revenue target requires a different pricing construct. Gap needs clarification.
- Three customer segments: (1) governments/state agencies (reforestation legacy), (2) agriculture (precision crop planting at scale), (3) mining companies (ecosystem restoration).
- Currently supporting projects in Australia and Sumatra - generating "startup cash flows".
- No subscription, carbon credit, or SaaS revenue mentioned explicitly, though carbon credit advisor is on the team (Raphael Wood, President Australian Carbon Standards Association) - carbon credit monetisation is plausible adjacency not yet modelled in deck.
Traction & metrics
- Active projects in Australia and Sumatra generating startup cash flows - no dollar figures disclosed.
- No historical revenue, customer count, growth rate, or retention figures in deck.
- Operational claim: "one operator controlling five pre-programmed drones can plant well over a million trees in just two days".
- Success rate "nearly double the industry average".
Unit economics
- Cost comparison (per hectare, 1,500 plants):
- Manual: Planting cost $1.17/plant; total cost $1,760/ha; 40% survival rate Y2; 600 trees survive; effective cost/tree $2.93.
- Drone: Planting cost $0.70/plant (seedpod); total cost $1,050/ha; 70% survival rate Y2; 1,050 trees survive; effective cost/tree $1.00.
- Drones outperform manual by 75% on cost per project.
- No CAC, LTV, gross margin %, or payback period stated.
- Implied gross profit per tree: not derivable from deck without revenue pricing per tree being stated explicitly.
Competition / moat
- Competitors not named; deck positions against "traditional/manual" planting techniques.
- Moats claimed: 18 years of seedpod R&D; proprietary seedpod formulation; AI mapping software; 70% vs 40% survival rate; 85% cost reduction vs manual; fully autonomous flight; all-weather/terrain capability.
- B Corporation certification pending as differentiation signal.
- Ecosystem restoration focus (not just trees) with indigenous community consultation.
Team & funding ask / use of funds
- Aymeric Maudous - Founder & CEO; dual Masters (International Marketing, Environmental Management); ex-Renault, Disney, Louis Vuitton.
- Monica Dodi - Co-Founder & Director; 30 years VC / streaming / digital media; ex-MTV, AOL, Warner Bros, Disney; Board Director LA River Revitalization.
- Raphael Wood - Carbon Credits Advisor; President, Australian Carbon Standards Association.
- Katherine Sainty - Lawyer; ex-partner Allens Linklaters; covers fundraising, carbon credits, drone contracting.
- Mahmood Hussein - Flight Operations; Founder, Global Drone Solutions; ex-mining/automotive.
- Jeff Lubrano - Chief Creative Officer; President, Fertile (French ecological transition agency); clients include Veolia, EDF.
- Funding ask: "Invest in Us" CTA; no round size, valuation, or use-of-funds breakdown disclosed in deck.
Recommended financial model
- Archetype + why: Volume-based services revenue model - revenue = trees planted × price/tree, with separate operating cost build (drone fleet CAPEX, seedpod COGS, pilot headcount, maintenance). This is an operations-heavy B2B service business with high CAPEX intensity (drone fleet) and a volume scale story. Best modelled as a 3-statement P&L / operating model with a CAPEX/fleet schedule and a volume bridge from current projects to the 2B-tree target. Carbon credit upside can be a separate schedule.
- Forecast horizon & granularity: 5-year annual (Y1–Y5), quarterly in Y1. The deck references a "five-year strategy" explicitly. Monthly is unnecessary given long project cycles.
- Key drivers & assumptions:
- Trees planted per year - ramp from current (unknown) to 2B by Year 5; linear ramp: Y1: 50M, Y2: 200M, Y3: 600M, Y4: 1.2B, Y5: 2B - rationale: drone fleet procurement and project pipeline build-up takes 2–3 years.
- Revenue per tree - $0.75/tree implied by $1.5B / 2B trees target; model should sensitivity-test $0.50–$1.20/tree.
- Seedpod COGS per tree - $0.30–$0.50/tree based on $1.00 effective cost/surviving tree inclusive of all drone ops; R&D amortisation excluded.
- Survival rate - 70% (drone) vs 40% (manual); pricing should be on delivered/surviving tree basis or seedpod-drop basis - clarify contract structure.
- Drones per fleet - 1 drone plants ~158,400 seeds/day; 1 year ≈ 250 operating days; 1 drone = ~40M seeds/year; to plant 2B trees/year at 70% survival from 2.86B seedpods → ~72 active drones at steady state.
- Drones per pilot: 5; pilots needed at 2B/year target: ~15 pilots.
- Drone CAPEX per unit - $20,000–$50,000 per commercial agricultural drone (industry norm); not stated in deck.
- Drone life / depreciation - 3–5 years.
- Gross margin - 40–60% at scale once fleet is deployed; early years lower due to CAPEX depreciation and setup.
- OpEx / SG&A - $2–5M/year at early stage; scales to 10–15% of revenue at maturity.
- Carbon credit revenue - $0 in base case; upside scenario adds $5–20/tonne × carbon sequestered; not modelled in deck.
- Customer mix: 3 segments (government, agriculture, mining) - 60/25/15% split in base case; affects pricing and contract length.
- Scenarios (Base / Bull / Bear - which variables flex):
- Base: 20% drone market share (2B trees/year by Y5), $0.75/tree, 40–50% gross margin.
- Bull: 30% drone market share (3B trees/year by Y5), $0.90/tree, 55% margin; carbon credit revenue layer added.
- Bear: 10% market share (1B trees/year by Y5), $0.60/tree, 30% margin; drone fleet delays.
- Required sheets / outputs:
- Assumptions - all drivers in one place.
- Volume bridge - seedpods planted → surviving trees → billable units per year.
- Fleet schedule - drones owned, CAPEX, depreciation, pilots.
- Revenue - trees × price by segment.
- COGS - seedpod cost, drone ops, maintenance.
- OpEx - headcount, SG&A, R&D.
- P&L (Income Statement).
- CAPEX schedule.
- Cash flow statement (including fleet CAPEX timing).
- (Optional) Carbon credit upside schedule.
- Scenario toggle.
Frequently asked
Is the Lord of the Trees financial model free?+
Yes. The Lord of the Trees model is a free Excel (.xlsx) download with live formulas. Sign up with your email and the workbook is yours to keep, review, and edit.
What's included in the model?+
A 5-year monthly forecast with P&L, cash flow and runway, valuation (exit multiple plus a DCF cross-check), MOIC/IRR returns, and unit economics, with live formulas throughout.
How was this model built?+
It was built from Lord of the Trees's pitch deck and publicly available information, then structured to investment-banking standards as a fully editable Excel model.
Can I change the assumptions?+
Yes. You can change assumptions and the live formulas will recalculate in the downloadable Excel model.
Have more financial modelling questions? Contact us

Created by ex-finance professionals
Hey, I’m Alex and I created Finamodel.
Over my years in the finance industry I kept building the same models over and over again. Same structure, same assumptions, different logo. So I started building frameworks to turn them into clean, reusable templates.
Every model here is one I’d actually use for a client, and I personally vet each one before it goes up.
I’m not an expert in every industry, but I’ve built enough models to know what belongs in one. And when something is completely foreign to me, I reach out to my network for experts to work on our models with us.
Having a template library on hand cuts a first build from hours to minutes.
Need help finding your model? You’ll find me in the Finamodel app!
Other Climate/Energy Startup Financial Models
Browse another startup in the same category.

Abatable
Robo-advisor platform for sourcing and managing high-quality carbon removal offsets, targeting asset managers.
Bower
Mobile app that rewards consumers for scanning and recycling consumer packaging at existing bins, monetised by CPG brand subscriptions and consumer data.
Bramble Energy
UK deep-tech company commercialising a PCB-based hydrogen fuel cell stack (PCBFC™) for portable power and mobility applications.

Cervest
AI-powered Climate Intelligence platform that quantifies physical climate risk at the asset level, delivered as a freemium SaaS product.

Clockworks Analytics
B2B SaaS platform providing automated fault-detection and diagnostics (FDD) analytics for commercial and institutional building portfolios.

Dandelion Energy
Dandelion Energy installs residential geothermal heat pump systems (ground-source HVAC) with in-house financing, targeting US homeowners on fossil-fuel heating.

Emitwise
B2B SaaS platform automating corporate carbon footprint tracking, reporting, and reduction using machine learning.
Fisker
Fisker is an asset-light, design-led EV company merging with Spartan Energy Acquisition Corp. in a SPAC transaction to fund the launch of the Fisker Ocean SUV.


