 NuScale Financial Model
Climate/Energy Startup Financials (Free Excel Download)
NuScale Power designs and sells Small Modular Reactors (SMRs) - factory-fabricated 77 MWe nuclear modules - and related plant services; going public via SPAC merger with Spring Valley Acquisition Corp.



professionals from Deloitte
Used by professionals from






About this model
NuScale designs factory-fabricated 77 MWe small modular nuclear reactors, configurable into plants of up to 12 modules. It sells modules, plant designs, and licensing while providing long-duration services including startup support, fuel, inspection, engineering, and spare parts.
The de-SPAC deck identifies a global SMR market and a first UAMPS deployment targeted for 2029, with 19 signed MOUs and a 114-opportunity pipeline. Its economics are long-cycle: module cash receipts arrive during construction and services begin years before commercial operation, continuing through the plant life.
The model must schedule each plant from design through COD, separating module sales, licensing, and services by margin and timing. Crucially, it needs a cash-versus-GAAP revenue bridge for deferred revenue and work in progress, then layers the SPAC sources, uses, redemption sensitivity, and pro forma capitalization over the operating forecast.
A turnkey financial model
Live formulas, no hardcoded values
Outputs are driven by live formulas, so the workbook updates from its assumptions instead of relying on hardcoded results.
All assumptions in one tab
Inputs are clearly marked in the Assumptions tab and separated from calculations, making it clear what to change and what to leave intact.
Statements always balancing
For integrated-statement models, the balance sheet, cash flow, and supporting schedules tie through properly.
Distinct schedules for clarity
Debt, working capital, taxes, and cash flow can get messy quickly. We group calculations in clear schedules, not across disconnected tabs.
No hidden macros or external links
There are no unexplained external workbook links or macros to undermine auditability or portability.
Changes flow through the model
Update a key driver and see the impact carry through the forecast, financing, and return outputs. We never use hardcoded numbers in formulas.
About NuScale
nuscalepower.com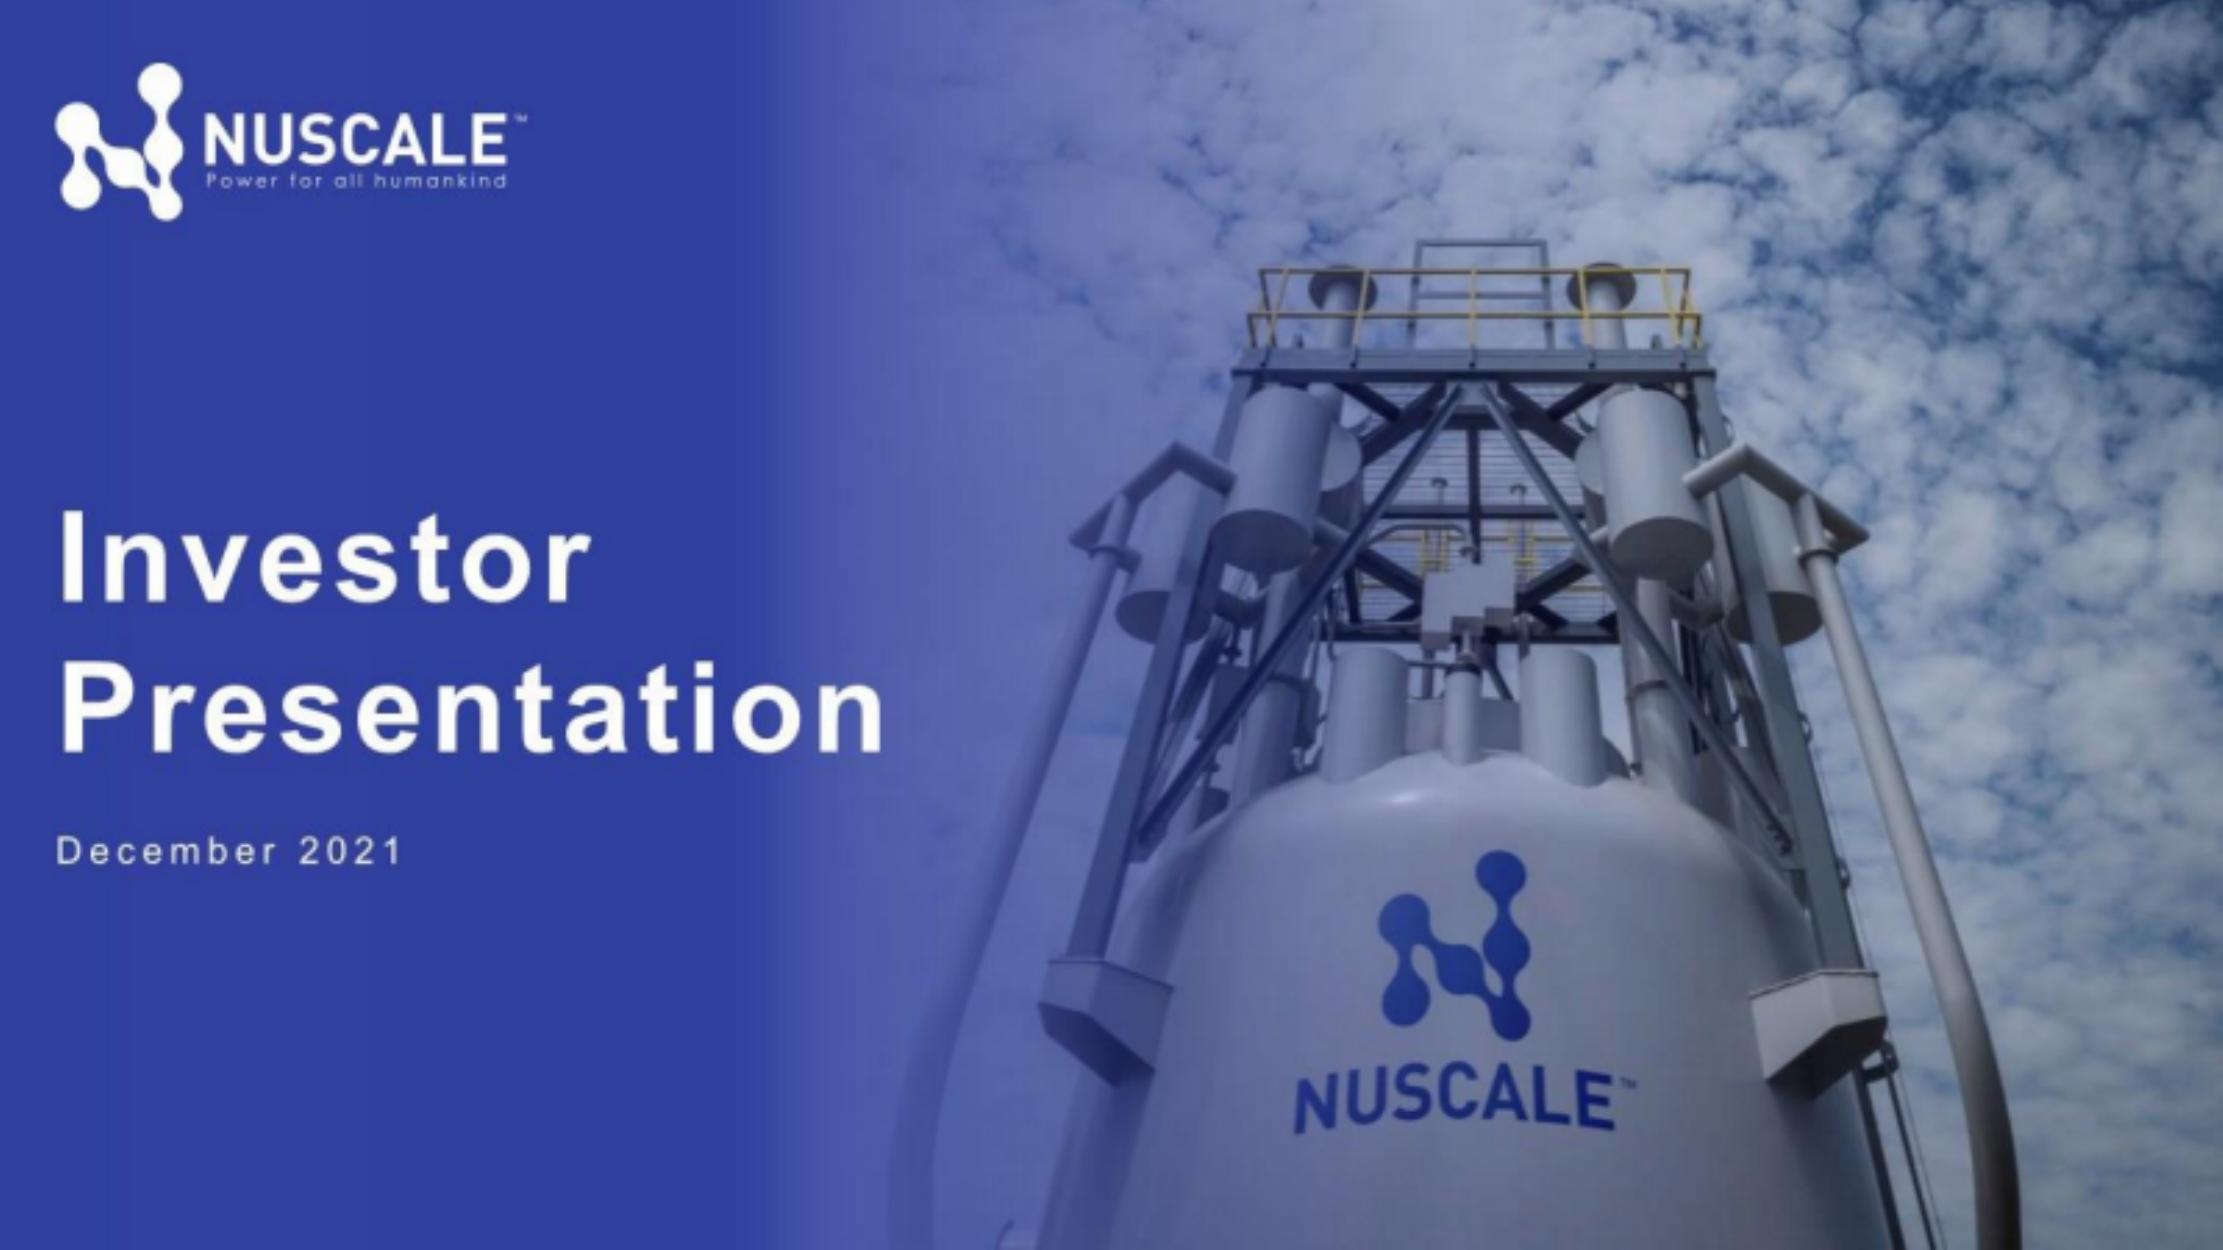
How to build a detailed financial model for NuScale
A complete walkthrough of the business, drivers, and assumptions behind the downloadable NuScale model - distilled from its pitch deck and publicly available information.
Product & value proposition
- NuScale Power Module (NPM): 77 MWe per module, up to 12 modules per plant (924 MWe), 60-year design life, walk-away safe, site-boundary Emergency Planning Zone.
- Plant configurations: 12-NPM (924 MWe, ~$3.3bn capex), 6-NPM (462 MWe), 4-NPM (308 MWe).
- Only SMR with NRC Standard Design Approval (granted Sept 11, 2020).
- Capex-light for NuScale: sells modules + IP; holds no inventory; near-zero capex.
- 628 patents (418 granted, 210 pending).
- Key differentiators vs. large-scale nuclear: modular (incremental capacity), shorter construction (~3 years vs. 6+), smaller EPZ, black-start / island-mode capable, 99.95% reliability over 60 years.
Market
- TAM: 16,407 GW of carbon-free capacity additions required globally through 2040 (BloombergNEF Net Zero Pathway "Red Scenario", August 2021).
- SAM (SMR-specific): 1,286 GW of SMR additions within the same scenario.
- NuScale implied SOM: 0.4% of 16,407 GW total, or 5.3% of 1,286 GW SMR market.
- Additional framing: 132 US coal plants (~140+ GW) planned for retirement through 2050 as coal-to-nuclear replacement opportunity.
- No dollar TAM figure given in the deck.
Revenue model
Two revenue streams:
A. NuScale Power Plants (NPM sales + plant designs)
- Sells NPMs at 77 MWe each; also sells standard plant designs and licensing basis separately.
- Cash revenue timing: Years 6–10 relative to construction (COD-4 to COD).
- Average annual cash revenue per plant (illustrative, ~9 NPM blended global average): $200mm–$250mm over years 6–10.
- Anticipated gross margin: 20–25%.
- Note: Standard Plant Design & Licensing fees charged in years 3–5 (COD-6 to COD-4).
B. Services
- Suite: licensing support, startup & testing, training, nuclear equipment inspection, fuel supply, O&M engineering, procurement & spare parts.
- Revenue begins ~8 years pre-COD and extends over 60+ year plant life.
- Early services (years 1–4, COD-9 to COD-6): $5mm–$15mm/year/plant, 10–15% gross margin.
- Mid services (years 5–10, COD-5 to COD): $10mm–$20mm/year/plant, 15–20% gross margin.
- Post-COD run-rate (year 11+): $25mm–$50mm/year/plant, 20–30% gross margin.
- Services represent <25% of typical customer non-fuel O&M budget.
Revenue recognition - critical accounting complexity:
- Cash Revenue ≠ GAAP Revenue. For NOAK (Nth-of-a-Kind) NPMs:
- Cash is collected ahead of GAAP recognition; deferred revenue and WIP build on the balance sheet.
- Cash collection: 0%/0%/31%/58%/77%/89%/100%/100% at T-6/T-5/T-4/T-3/T-2/T-1/COD/T+1.
- GAAP recognition: 1%/2%/3%/4%/5%/22%/94%/100% at T-6/T-5/T-4/T-3/T-2/T-1/COD/T+1.
- Model must track Deferred Revenue (+) and WIP (-) as balance sheet items.
Traction & metrics
- First and only SMR with NRC Standard Design Approval.
- $1.3bn cumulative capital invested to date (as of July 31, 2021, including DOE cost-share).
- $0.5bn received in DOE cost-share to date; ~$200mm additional available through 2024 (5-year award granted 2020).
- $1.4bn DOE cost-share grant awarded 2020 for UAMPS deployment.
- Customer pipeline: 114 total opportunities - Class 5 (70 leads), Class 4 (18), Class 3 (15), Class 2 (10), Class 1 (1 contract: UAMPS).
- 19 signed MOUs globally.
- First deployment: UAMPS Carbon Free Power Project (CFPP) at Idaho National Laboratory, targeting 2029 COD.
- GAAP Revenue projections (company forecast): $14mm (2022E) → $85mm (2023E) → $179mm (2024E) → $358mm (2025E) → $640mm (2026E) → $1,017mm (2027E) → $1,855mm (2028E) → $4,157mm (2029E) → $5,506mm (2030E).
- "Cash Revenue" projections: $16mm (2022E) → $145mm (2023E) → $672mm (2024E) → $1,058mm (2025E) → $1,896mm (2026E) → $3,641mm (2027E) → $6,480mm (2028E) → $10,008mm (2029E) → $13,119mm (2030E).
- "Cash EBITDA" projections: ($155mm) (2022E) → ($36mm) (2023E) → $116mm (2024E) → $191mm (2025E) → $434mm (2026E) → $896mm (2027E) → $1,610mm (2028E) → $2,457mm (2029E) → $3,171mm (2030E).
- Free Cash Flow: ($158mm) → ($42mm) → $93mm → $127mm → $304mm → $640mm → $1,173mm → $1,809mm → $2,340mm (2022E–2030E).
- Module COD Forecast (cumulative modules online): 16 (2029E), 19 (2030E), 35 (2031E), 63 (2032E), 85 (2033E), 90 (2034E), 92 (2035E), 94 (2036E), 96 (2037E), 98 (2038E), 100 (2039E).
- EBITDA (GAAP): ($155mm) → ($50mm) → ($1mm) → $26mm → $139mm → $288mm → $532mm → $1,076mm → $1,387mm (2022E–2030E).
- Revenue CAGR 2024E–2026E: 68% (Cash basis).
- EBITDA margin 2026E: 23% (Cash EBITDA).
- 430+ employees; 35 PhDs; 146 Masters; 20% veterans.
Unit economics
- Per plant (blended ~9 NPM global average):
- NPM cash revenue: $200mm–$250mm/year during construction phase (years 6–10).
- NPM gross margin: 20–25%.
- Services gross margin: 10–15% (early), 15–20% (mid), 20–30% (post-COD).
- LCOE target for UAMPS project: $58/MWh.
- 12-module plant cost: ~$3.3bn (NOAK, excluding escalation/contingencies/fees).
- vs. large-scale nuclear: $9.0+bn for ~2.2 GWe.
- Payback period (company-level): Free cash flow positive from 2024E.
Competition / moat
- Only SMR with NRC Standard Design Approval - competitors years behind.
- $1.3bn invested to date creates a high barrier to entry.
- 628 patents (418 granted, 210 pending) + in-house NRC-approved software + extensive trade secrets.
- First-to-market in a massive untapped market; proprietary technology controls design and licensing basis of core NPM technology.
- Deep talent pool: 430+ employees with nuclear experience.
- Strategic investor and supply chain lock-in: Fluor, Doosan, JGC, GS Energy, Sarens, IHI, Samsung C&T, BWXT, Framatome, Honeywell among partners/investors.
- Competitive benchmarking (EV/EBITDA 2026E): NuScale at 4.3x vs. Energy Transition median 29.9x, Nuclear median 25.0x.
- Competitive benchmarking (EV/Revenue 2026E): NuScale at 1.0x vs. Energy Transition median 6.0x, Nuclear median 4.4x.
Team & funding ask / use of funds
Team:
- John Hopkins, CEO (since 2012; ex-Fluor, I Squared Capital)
- Chris Colbert, CFO (since 2011; ex-GE, Bechtel, UniStar)
- Jose Reyes PhD, CTO & Co-Founder (since 2007; ex-Oregon State, IAEA, NRC)
- Dale Atkinson, COO & CNO (since 2014; ex-Energy Northwest, GE, US Navy)
- Tom Mundy, CCO (since 2012; ex-Exelon, GPU Nuclear)
- Robert Temple, General Counsel (since 2016; ex-Toshiba, BWX, US Navy, GE)
- Average 9 years tenure at NuScale; 36 years industry experience.
SPAC Transaction Structure:
- Spring Valley Acquisition Corp. (Nasdaq: SV); Placement Agents: Guggenheim Securities + Cowen & Company.
- Transaction size: $232mm SVAC cash in trust + $181mm PIPE = $413mm gross; ~$373mm net to balance sheet (after ~$40mm transaction fees).
- Pro-forma EV (post-money): $1,866mm (~$1.9bn).
- Post-money equity value: $2,328mm (232.8mm shares at $10.00).
- Valuation multiples at deal price: 1.0x 2026E Cash Revenue; 4.3x 2026E Cash EBITDA.
- Ownership at closing: Existing NuScale shareholders 80.5%, SVAC IPO shares 9.9%, PIPE 7.9%, Sponsor shares 1.7%.
- Use of proceeds: Fund commercialisation and accelerate growth. No additional capital expected before free cash flow.
- Net cash (post-transaction): $462mm.
Recommended financial model
This is a SPAC / de-SPAC deck. The primary financial model should be a Project-Revenue / Long-Cycle Operating Forecast with SPAC Pro Forma Cap Table, not a standard SaaS or DTC model.
- Archetype: Long-cycle capital equipment operating forecast + SPAC pro forma. NuScale's revenue is driven by plant deployments (# NPMs reaching COD each year), each with a multi-year construction revenue schedule - more analogous to a project-finance or defence/aerospace OEM model than a traditional recurring-revenue business. Cash vs. GAAP divergence is a structural feature requiring a dedicated bridge. The SPAC structure adds a separate pro forma equity/EV waterfall.
- Forecast horizon & granularity: 2022E–2030E annually (matches deck); extend to 2035E for illustrative post-ramp steady-state. Annual, not quarterly (limited quarterly data in deck).
- Key drivers & assumptions:
| Driver | Value | Source |
|---|---|---|
| NPMs reaching COD per year | 16 (2029E) → 100 (2039E) cumulative | - |
| Average plant size (global blended) | ~9 NPMs per plant | - |
| NPM cash revenue per plant (construction phase) | $200mm–$250mm/year (yrs 6–10) | - |
| NPM gross margin | 20–25% | - |
| Services revenue per plant - early (COD-9 to COD-6) | $5mm–$15mm/year | - |
| Services revenue per plant - mid (COD-5 to COD) | $10mm–$20mm/year | - |
| Services revenue per plant - post-COD | $25mm–$50mm/year | - |
| Services gross margin (early / mid / post-COD) | 10-15% / 15-20% / 20-30% | - |
| Cash collection schedule (cumulative % of NPM value) | 0/0/31/58/77/89/100/100% (T-6→T+1) | - |
| GAAP recognition schedule | 1/2/3/4/5/22/94/100% (T-6→T+1) | - |
| UAMPS COD | 2029 | - |
| LCOE target (UAMPS) | $58/MWh | - |
| SPAC net cash to balance sheet | $373mm | - |
| Transaction fees | $40mm | - |
| Pro-forma shares outstanding | 232.8mm at $10.00 | - |
- Scenarios (Base / Bull / Bear):
- Base: Company-provided COD schedule (16 modules 2029E, ramp to 100 by 2039E). Per-plant economics at midpoint of illustrative ranges.
- Bull: Faster pipeline conversion (Class 2 → Class 1 acceleration), 2–3 additional CODs by 2031E; per-plant margins at high end (25% NPM, 30% services post-COD). Possible European deployment by 2028 (Romania).
- Bear: UAMPS delays by 1–2 years (precedent: nuclear projects routinely slip); pipeline conversion at 50% of base case; per-plant margins at low end. DOE funding risks if political environment changes.
- Flex variables: # CODs per year, NPM revenue per module, gross margin %, services penetration rate, capex/opex for SG&A.
- Required sheets / outputs:
- Assumptions - all drivers above, flagged DECK vs. ASSUMED.
- Module COD Schedule - annual modules going COD per plant; cumulative plant count by vintage year.
- Per-Plant Revenue Build - cash and GAAP revenue by plant, by year (construction phase + post-COD services), with collection/recognition waterfall.
- Consolidated P&L (GAAP) - GAAP revenue, COGS, gross profit, SG&A, R&D, EBITDA, D&A, EBIT, tax, net income. 2022E–2030E.
- Cash Metrics Bridge - EBITDA → Cash EBITDA reconciliation (+Deferred Revenue, -WIP); GAAP Revenue → Cash Revenue.
- Balance Sheet - Deferred Revenue and WIP as key line items; cash position post-SPAC.
- Free Cash Flow - Cash EBITDA less capex and working capital movements; matches deck FCF series.
- SPAC Pro Forma Cap Table - Sources & Uses; pre- and post-money equity bridge; share count (SVAC + PIPE + rollover + sponsor + warrants); EV bridge (equity value minus net cash).
- Valuation Comps - EV/Revenue and EV/EBITDA benchmarking vs. energy transition and nuclear peers (as per slides 40–41).
- Scenario Toggle - Base / Bull / Bear revenue, EBITDA and FCF outputs in a single summary table.
Frequently asked
Is the NuScale financial model free?+
Yes. The NuScale model is a free Excel (.xlsx) download with live formulas. Sign up with your email and the workbook is yours to keep, review, and edit.
What's included in the model?+
A 5-year monthly forecast with P&L, cash flow and runway, valuation (exit multiple plus a DCF cross-check), MOIC/IRR returns, and unit economics, with live formulas throughout.
How was this model built?+
It was built from NuScale's pitch deck and publicly available information, then structured to investment-banking standards as a fully editable Excel model.
Can I change the assumptions?+
Yes. You can change assumptions and the live formulas will recalculate in the downloadable Excel model.
Have more financial modelling questions? Contact us

Created by ex-finance professionals
Hey, I’m Alex and I created Finamodel.
Over my years in the finance industry I kept building the same models over and over again. Same structure, same assumptions, different logo. So I started building frameworks to turn them into clean, reusable templates.
Every model here is one I’d actually use for a client, and I personally vet each one before it goes up.
I’m not an expert in every industry, but I’ve built enough models to know what belongs in one. And when something is completely foreign to me, I reach out to my network for experts to work on our models with us.
Having a template library on hand cuts a first build from hours to minutes.
Need help finding your model? You’ll find me in the Finamodel app!
Other Climate/Energy Startup Financial Models
Browse another startup in the same category.

Abatable
Robo-advisor platform for sourcing and managing high-quality carbon removal offsets, targeting asset managers.
Bower
Mobile app that rewards consumers for scanning and recycling consumer packaging at existing bins, monetised by CPG brand subscriptions and consumer data.
Bramble Energy
UK deep-tech company commercialising a PCB-based hydrogen fuel cell stack (PCBFC™) for portable power and mobility applications.

Cervest
AI-powered Climate Intelligence platform that quantifies physical climate risk at the asset level, delivered as a freemium SaaS product.

Clockworks Analytics
B2B SaaS platform providing automated fault-detection and diagnostics (FDD) analytics for commercial and institutional building portfolios.

Dandelion Energy
Dandelion Energy installs residential geothermal heat pump systems (ground-source HVAC) with in-house financing, targeting US homeowners on fossil-fuel heating.

Emitwise
B2B SaaS platform automating corporate carbon footprint tracking, reporting, and reduction using machine learning.
Fisker
Fisker is an asset-light, design-led EV company merging with Spartan Energy Acquisition Corp. in a SPAC transaction to fund the launch of the Fisker Ocean SUV.


