 Oklo SPAC Financial Model
Climate/Energy Startup Financials (Free Excel Download)
Oklo Inc. is a pre-revenue advanced nuclear fission company merging with AltC Acquisition Corp. (NYSE: ALCC) via SPAC to fund first commercial deployment of its Aurora small modular reactor powerhouse.



professionals from Deloitte
Used by professionals from






About this model
Oklo is developing 15 and 50 MWe Aurora advanced fission powerhouses that it intends to own and operate. The reactors are designed to sell electricity and heat under long-term PPAs to data centres, industrial users, defence, utilities, and off-grid customers without upfront customer capex.
The company was pre-revenue at its SPAC presentation, with more than 700 MWe of non-binding interest and an Idaho first-deployment target of 2026 or 2027. It also identifies future fuel recycling, but this remains upside rather than a current operating revenue source.
Model the transaction separately from plant operations. At plant level, forecast deployment count, capacity factor, PPA price, construction and fuel capex, refuelling, opex, and forty-year cash flows for both reactor sizes; then consolidate corporate burn and financing. SPAC redemptions, regulatory delay, and construction timing are decisive sensitivities.
A turnkey financial model
Live formulas, no hardcoded values
Outputs are driven by live formulas, so the workbook updates from its assumptions instead of relying on hardcoded results.
All assumptions in one tab
Inputs are clearly marked in the Assumptions tab and separated from calculations, making it clear what to change and what to leave intact.
Statements always balancing
For integrated-statement models, the balance sheet, cash flow, and supporting schedules tie through properly.
Distinct schedules for clarity
Debt, working capital, taxes, and cash flow can get messy quickly. We group calculations in clear schedules, not across disconnected tabs.
No hidden macros or external links
There are no unexplained external workbook links or macros to undermine auditability or portability.
Changes flow through the model
Update a key driver and see the impact carry through the forecast, financing, and return outputs. We never use hardcoded numbers in formulas.
About Oklo SPAC
oklo.com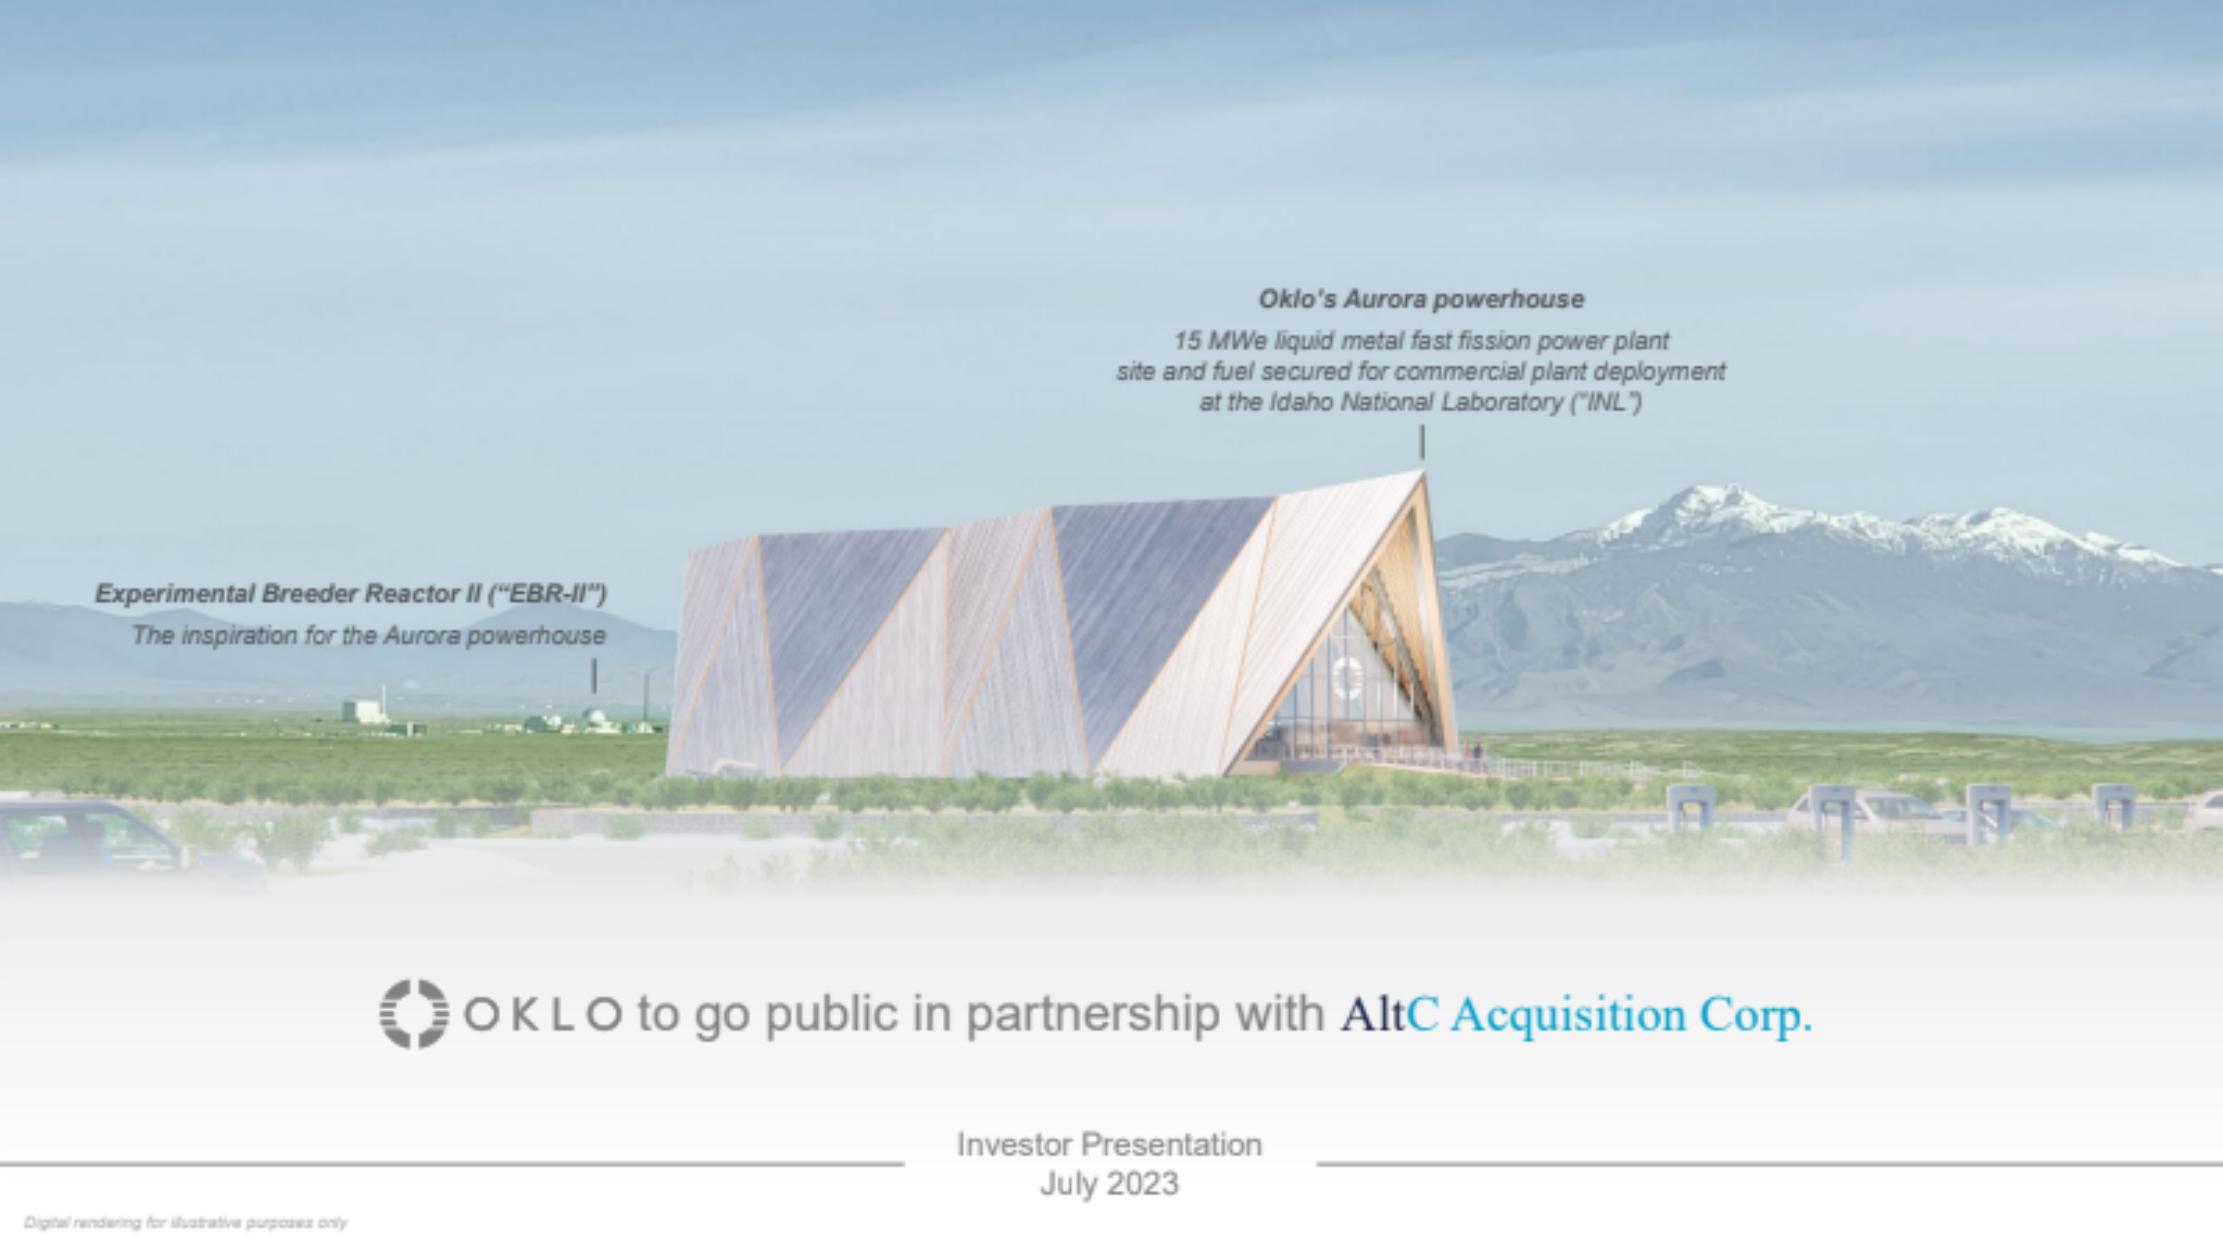
How to build a detailed financial model for Oklo SPAC
A complete walkthrough of the business, drivers, and assumptions behind the downloadable Oklo SPAC model - distilled from its pitch deck and publicly available information.
Product & value proposition
- Aurora powerhouse: liquid metal fast fission reactor. Two sizes: 15 MWe and 50 MWe (scalable).
- Design life: 40 years. Estimated construction time: <1 year. Footprint: <2 acres.
- Key differentiators vs. conventional nuclear: smaller scale, simpler design, passive safety, factory fabrication, no upfront customer capex, quick build.
- Fuel flexibility: operates on fresh HALEU or recycled spent nuclear fuel. EBR-II (1964–1994) is the demonstrated ancestor.
- Second business line (upside): fuel recycling - reprocess spent nuclear fuel for resale and internal supply; target commercial-scale facility by early 2030s.
- Target customers: data centers, defense, factories, industrial, off-grid/rural, utilities.
Market
- U.S. nuclear capacity stagnant for 30+ years at ~100 GW while U.S. electricity consumption grew >40% (2.8T kWh in 1990 → 4.1T kWh in 2022).
- To achieve net-zero U.S. grid by 2050: up to 770 GW of new clean baseload required; nuclear could supply ~200 GW of that, implying a ~3x increase from current ~100 GW operating fleet to ~300 GW by 2050.
- Deck does not provide explicit TAM/SAM/SOM dollar figures for Oklo's addressable slice.
- Policy tailwinds: IRA investment and production tax credits for nuclear; $700M for advanced nuclear fuel; $250B DOE Loan Program Office; FY23/FY24 Appropriations providing $3B for nuclear support; ADVANCE Act.
- Customer pipeline: >700 MWe under non-binding indications of interest.
Revenue model
- Primary: owner-operator - Oklo builds, owns, and operates Aurora powerhouses and sells electricity/heat directly to customers under long-term PPAs. No upfront capital cost to customer. Revenue is recurring and contracted.
- Pricing (NOAK illustrative):
- 15 MWe: ~$105/MWh average real power price → ~$13M annual revenue per plant
- 50 MWe: ~$90/MWh average real power price → ~$36M annual revenue per plant
- Capacity factor assumed: 92% (generating ~121,000 MWh/yr for 15 MWe; ~403,000 MWh/yr for 50 MWe).
- Secondary (future, not modeled at close): fuel recycling services, byproduct sales, specialty isotopes.
- No revenue or signed contracts in place at time of presentation.
Traction & metrics
- $0 revenue - pre-commercial, no binding customer contracts.
- Customer interest: >700 MWe under non-binding indications of interest (not binding LOIs).
- Projects in pipeline: 3 sites
- 1 × 15 MWe at Idaho National Laboratory (site + fuel secured; first electricity target 2026/27)
- 2 × 15 MWe in Southern Ohio via SODI partnership (non-binding, announced May 2023)
- Team: 51 employees including 8 PhDs (16%) and 20 Masters in Engineering/Science (39%). ~10% are former NRC staff.
- Regulatory: first-ever advanced reactor Combined License Application (COLA) submitted in March 2020; NRC denied in 2022 (requested more info); new application targeted late 2024/early 2025. 9 formal pre-application meetings, 70+ coordination meetings, 50+ licensing documents shared.
- DOE awards: 4 cost-share awards for fuel recycling R&D.
- Seed funding from Y Combinator (2014), Series A led by Data Collective & Mithril (2015). Sam Altman lead investor and Chairman since 2015.
Unit economics
15 MWe Aurora (NOAK)
- Revenue from power sales (40 yr): $508M
- Operating expenses (40 yr): $120M
- Plant profit (40 yr): $388M (75% life-of-plant margin)
- Capital costs (40 yr total): $107M
- Initial plant construction: $24M
- Initial fuel load: $33M (4,750 kg HALEU @ $7,000/kg)
- Refueling (3× over 40 yr, 2,375 kg each): $50M
- Plant cash flow (40 yr): $281M (2.5x capital costs)
- Annual plant cash flow (steady state): $10M/yr
- Annual cash margin (steady state): 76.4%
- FOAK variant: plant cost ~$34M, annual opex fixed $3.8M, variable $6/MWh
50 MWe Aurora (NOAK)
- Revenue from power sales (40 yr): $1,452M
- Operating expenses (40 yr): $288M
- Plant profit (40 yr): $1,163M (80% life-of-plant margin)
- Capital costs (40 yr total): $198M
- Initial plant construction: $61M
- Initial fuel load: $55M (7,800 kg HALEU @ $7,000/kg)
- Refueling (3× over 40 yr, 3,900 kg each): $82M
- Plant cash flow (40 yr): $966M (5.0x capital costs)
- Annual plant cash flow (steady state): $29M/yr
- Annual cash margin (steady state): 80.1%
- FOAK variant: plant cost ~$86M, annual opex fixed $7.2M, variable $5/MWh
Corporate-level costs
- G&A: ~$19.5M in 2024, scaling to ~$34.5M by 2027 (pre-deployment); long-term ~20% of power revenue
- Manufacturing facility capex: ~$40M by 2030
- Maintenance capex: ~10% of initial plant capital cost every 10 years
- Occupancy expense: ~5% of power revenue
- Working capital: ~4% of power revenue
Competition / moat
- Comparable SMR/advanced nuclear peers (all larger/more expensive): X-energy (320 MWe, pre-money $1.8B at announcement), NuScale (924 MWe), NetPower (natural gas, 300 MWe). Oklo prices at $0.85B pre-money.
- Moat claims: smaller/cheaper design prevents incumbents from replicating model; owner-operator model eliminates customer capex barrier; fuel recycling capability is unique in U.S.
- Risk: no commercial fast reactor in operation today; regulatory precedent does not yet exist; technology not NRC-licensed.
- Nuclear energy analogs used for revenue model comparables: Orsted (~$40B market cap), Brookfield (~$14B), Northland Power (~$5B), Neoen (~$5B).
Team & funding ask / use of funds
Team
- Jacob DeWitte: Co-Founder & CEO; PhD nuclear engineering, MIT; 15+ years nuclear; prior GE, Sandia, Urenco, US Naval Nuclear Lab.
- Caroline Cochran: Co-Founder & COO; MS nuclear engineering, MIT; 15+ years nuclear; prior Office of Secretary of Defense, DOE Nuclear Energy Advisory Committee.
- Sam Altman: Chairman since 2015; Co-Founder & CEO OpenAI; Former President Y Combinator.
- Michael Klein: Co-Founder & Chairman, Churchill Capital / M. Klein & Company.
SPAC transaction structure
- AltC (NYSE: ALCC) combines with Oklo at $850M pre-money equity value
- AltC cash-in-trust: $515.8M (as of June 30, 2023)
- Estimated cash to balance sheet after fees: ~$478M
- Total pro forma equity: $1,366M; 143M shares outstanding
- Existing Oklo shareholders: 85M shares (60%); AltC shareholders: 58M shares (40%)
- Earnout: up to 15M additional shares for Oklo shareholders vesting at $12/$14/$16 within 5 years
- No cash distributed to Oklo shareholders; 100% of net proceeds to Oklo balance sheet
- Sponsor: 100% of founder shares subject to performance vesting; 3-year staggered lock-up
- Use of proceeds: fund first Aurora deployment, manufacturing ramp, regulatory work, G&A
Recommended financial model
Archetype + why: This is a SPAC/de-SPAC deal model combined with a project-finance / infrastructure operating forecast. It is NOT a standard operating startup model. The entity has no revenue; the investment thesis is a long-dated capital deployment into a regulated utility-like asset base. The appropriate model has two layers:
- Transaction layer (SPAC model): sources & uses, pro forma cap table, earnout waterfall, sponsor promote economics, redemption sensitivity, cash-to-balance-sheet under various redemption scenarios.
- Operating layer (infrastructure / project-finance): unit-level plant P&L × deployment count, corporate P&L overlay, funding runway model. Mirrors how renewable energy IPP (independent power producer) models work.
Forecast horizon & granularity:
- Quarterly through 2027 (pre-revenue; tracks burn, regulatory milestones, first deployment)
- Annual 2028–2040 (ramp of plant fleet, cash flow build-up)
- Per-plant unit economics run at both 15 MWe and 50 MWe simultaneously
Key drivers & assumptions:
*Transaction / cap table:*
- Pre-money equity value: $850M
- AltC trust: $516M; shares at $10.00
- Redemption rate: 0% base case, 50% / 100% for bear/stress
- Fees & expenses: ~$38M
- Earnout thresholds: $12, $14, $16/share within 5 years of close
*Plant unit economics (15 MWe NOAK):*
- Plant capex: $24M (NOAK); $34M (FOAK)
- Initial fuel: $33M / 4,750 kg; HALEU price $7,000/kg
- Refueling: $50M total over 40 yr (2,375 kg every 10 yr)
- Annual revenue: ~$13M @ $105/MWh, 92% capacity factor
- Annual fixed opex: $2.4M (NOAK); $3.8M (FOAK)
- Annual variable opex: $5.00/MWh (NOAK); $6.00/MWh (FOAK)
- Maintenance capex: 10% of initial plant cost every 10 yr
- Cash margin (steady state): 76.4%
*Plant unit economics (50 MWe NOAK):*
- Plant capex: $61M (NOAK); $86M (FOAK)
- Initial fuel: $55M / 7,800 kg
- Refueling: $82M total over 40 yr (3,900 kg every 10 yr)
- Annual revenue: ~$36M @ $90/MWh, 92% capacity factor
- Annual fixed opex: $5.6M (NOAK); $7.2M (FOAK)
- Annual variable opex: $4.00/MWh (NOAK); $5.00/MWh (FOAK)
- Cash margin (steady state): 80.1%
*Fleet ramp (deployment count):*
- 2026: 1 plant (15 MWe, FOAK at INL)
- 2027: potential 2 additional (Southern Ohio)
- Year 2–10 ramp: deck shows illustrative Low/High deployment scenarios (charts show 0–150 units per year by Year 10, axes unlabeled precisely)
- NOAK status assumed at run-rate of ~20 units
- Ramp shape:
*Corporate cost structure:*
- G&A: $19.5M (2024) → $34.5M (2027) pre-deployment; then ~20% of power revenue
- Manufacturing facility capex: ~$40M cumulative by 2030
- Occupancy: 5% of power revenue
- Working capital: 4% of power revenue
*Fuel recycling:*
- Commercial-scale facility targeted early 2030s
- Revenue/cost impact: not quantified in deck; modeled as upside optionality toggle
*Discount rate / WACC:*
*Power price:*
Scenarios:
| Variable | Bear | Base | Bull |
|---|---|---|---|
| SPAC redemption rate | 80% | 0% | 0% |
| First deployment year | 2028 | 2026/27 | 2026 |
| Fleet ramp (plants/yr by 2035) | Low curve | Mid curve | High curve |
| HALEU price ($/kg) | $9,000 | $7,000 | $5,500 |
| Power price ($/MWh, 15MWe) | $85 | $105 | $120 |
| NOAK plant capex (15 MWe) | $35M | $24M | $22M |
| Fuel recycling contribution | None | None | Meaningful from 2032 |
Required sheets / outputs:
- Transaction summary: sources & uses, pro forma cap table, redemption sensitivity table (0/25/50/75/100% redemption → cash to balance sheet, ownership %)
- Earnout waterfall: shares vesting at $12/$14/$16 per trigger
- Unit economics - 15 MWe: single-plant 40-year P&L and cash flow (FOAK and NOAK versions)
- Unit economics - 50 MWe: single-plant 40-year P&L and cash flow (FOAK and NOAK versions)
- Fleet model: cumulative plant count by year (Low/High ramp); aggregate revenue, opex, plant capex, plant cash flow
- Corporate P&L: fleet revenue less G&A, occupancy, working capital, manufacturing capex → corporate EBITDA and net cash flow
- Funding runway: starting balance sheet cash post-close (~$478M), quarterly burn through first deployment, time-to-next-raise sensitivity
- Scenario dashboard: Base / Bear / Bull toggle with key output KPIs (cash runway end date, breakeven year, NPV of fleet, IRR per plant)
- Comps table: Oklo EV vs. NuScale, X-energy, NetPower, renewable IPPs (Orsted, Northland, Neoen) on EV/MW, EV/projected revenue
Frequently asked
Is the Oklo SPAC financial model free?+
Yes. The Oklo SPAC model is a free Excel (.xlsx) download with live formulas. Sign up with your email and the workbook is yours to keep, review, and edit.
What's included in the model?+
A 5-year monthly forecast with P&L, cash flow and runway, valuation (exit multiple plus a DCF cross-check), MOIC/IRR returns, and unit economics, with live formulas throughout.
How was this model built?+
It was built from Oklo SPAC's pitch deck and publicly available information, then structured to investment-banking standards as a fully editable Excel model.
Can I change the assumptions?+
Yes. You can change assumptions and the live formulas will recalculate in the downloadable Excel model.
Have more financial modelling questions? Contact us

Created by ex-finance professionals
Hey, I’m Alex and I created Finamodel.
Over my years in the finance industry I kept building the same models over and over again. Same structure, same assumptions, different logo. So I started building frameworks to turn them into clean, reusable templates.
Every model here is one I’d actually use for a client, and I personally vet each one before it goes up.
I’m not an expert in every industry, but I’ve built enough models to know what belongs in one. And when something is completely foreign to me, I reach out to my network for experts to work on our models with us.
Having a template library on hand cuts a first build from hours to minutes.
Need help finding your model? You’ll find me in the Finamodel app!
Other Climate/Energy Startup Financial Models
Browse another startup in the same category.

Abatable
Robo-advisor platform for sourcing and managing high-quality carbon removal offsets, targeting asset managers.
Bower
Mobile app that rewards consumers for scanning and recycling consumer packaging at existing bins, monetised by CPG brand subscriptions and consumer data.
Bramble Energy
UK deep-tech company commercialising a PCB-based hydrogen fuel cell stack (PCBFC™) for portable power and mobility applications.

Cervest
AI-powered Climate Intelligence platform that quantifies physical climate risk at the asset level, delivered as a freemium SaaS product.

Clockworks Analytics
B2B SaaS platform providing automated fault-detection and diagnostics (FDD) analytics for commercial and institutional building portfolios.

Dandelion Energy
Dandelion Energy installs residential geothermal heat pump systems (ground-source HVAC) with in-house financing, targeting US homeowners on fossil-fuel heating.

Emitwise
B2B SaaS platform automating corporate carbon footprint tracking, reporting, and reduction using machine learning.
Fisker
Fisker is an asset-light, design-led EV company merging with Spartan Energy Acquisition Corp. in a SPAC transaction to fund the launch of the Fisker Ocean SUV.


