 Orange Financial Model
Climate/Energy Startup Financials (Free Excel Download)
Affordable EV charging hardware + software platform for multi-unit residential properties (apartments, condos).



professionals from Deloitte
Used by professionals from






About this model
Orange provides EV charging outlets for multifamily properties, combining low-cost hardware with driver payment software and property energy dashboards. Its cable-free outlets are designed to use existing electrical infrastructure, cutting installation cost versus conventional Level 2 charging.
Each installation generates hardware and warranty revenue upfront, then annual network fees and a 5% energy-revenue fee. The company had installed at 24 properties and was selling directly to apartment owners and operators such as Greystar, AvalonBay, and Irvine Company.
The model should use property cohorts rather than a pure SaaS ARR build. Forecast properties won, outlets per property, hardware ASP and COGS, warranty attachment, active drivers, network fees, charging revenue, and property-level CAC. Recurring revenue compounds as the installed base grows, while installation pace and utilisation determine cash break-even.
A turnkey financial model
Live formulas, no hardcoded values
Outputs are driven by live formulas, so the workbook updates from its assumptions instead of relying on hardcoded results.
All assumptions in one tab
Inputs are clearly marked in the Assumptions tab and separated from calculations, making it clear what to change and what to leave intact.
Statements always balancing
For integrated-statement models, the balance sheet, cash flow, and supporting schedules tie through properly.
Distinct schedules for clarity
Debt, working capital, taxes, and cash flow can get messy quickly. We group calculations in clear schedules, not across disconnected tabs.
No hidden macros or external links
There are no unexplained external workbook links or macros to undermine auditability or portability.
Changes flow through the model
Update a key driver and see the impact carry through the forecast, financing, and return outputs. We never use hardcoded numbers in formulas.
About Orange
orangecharger.com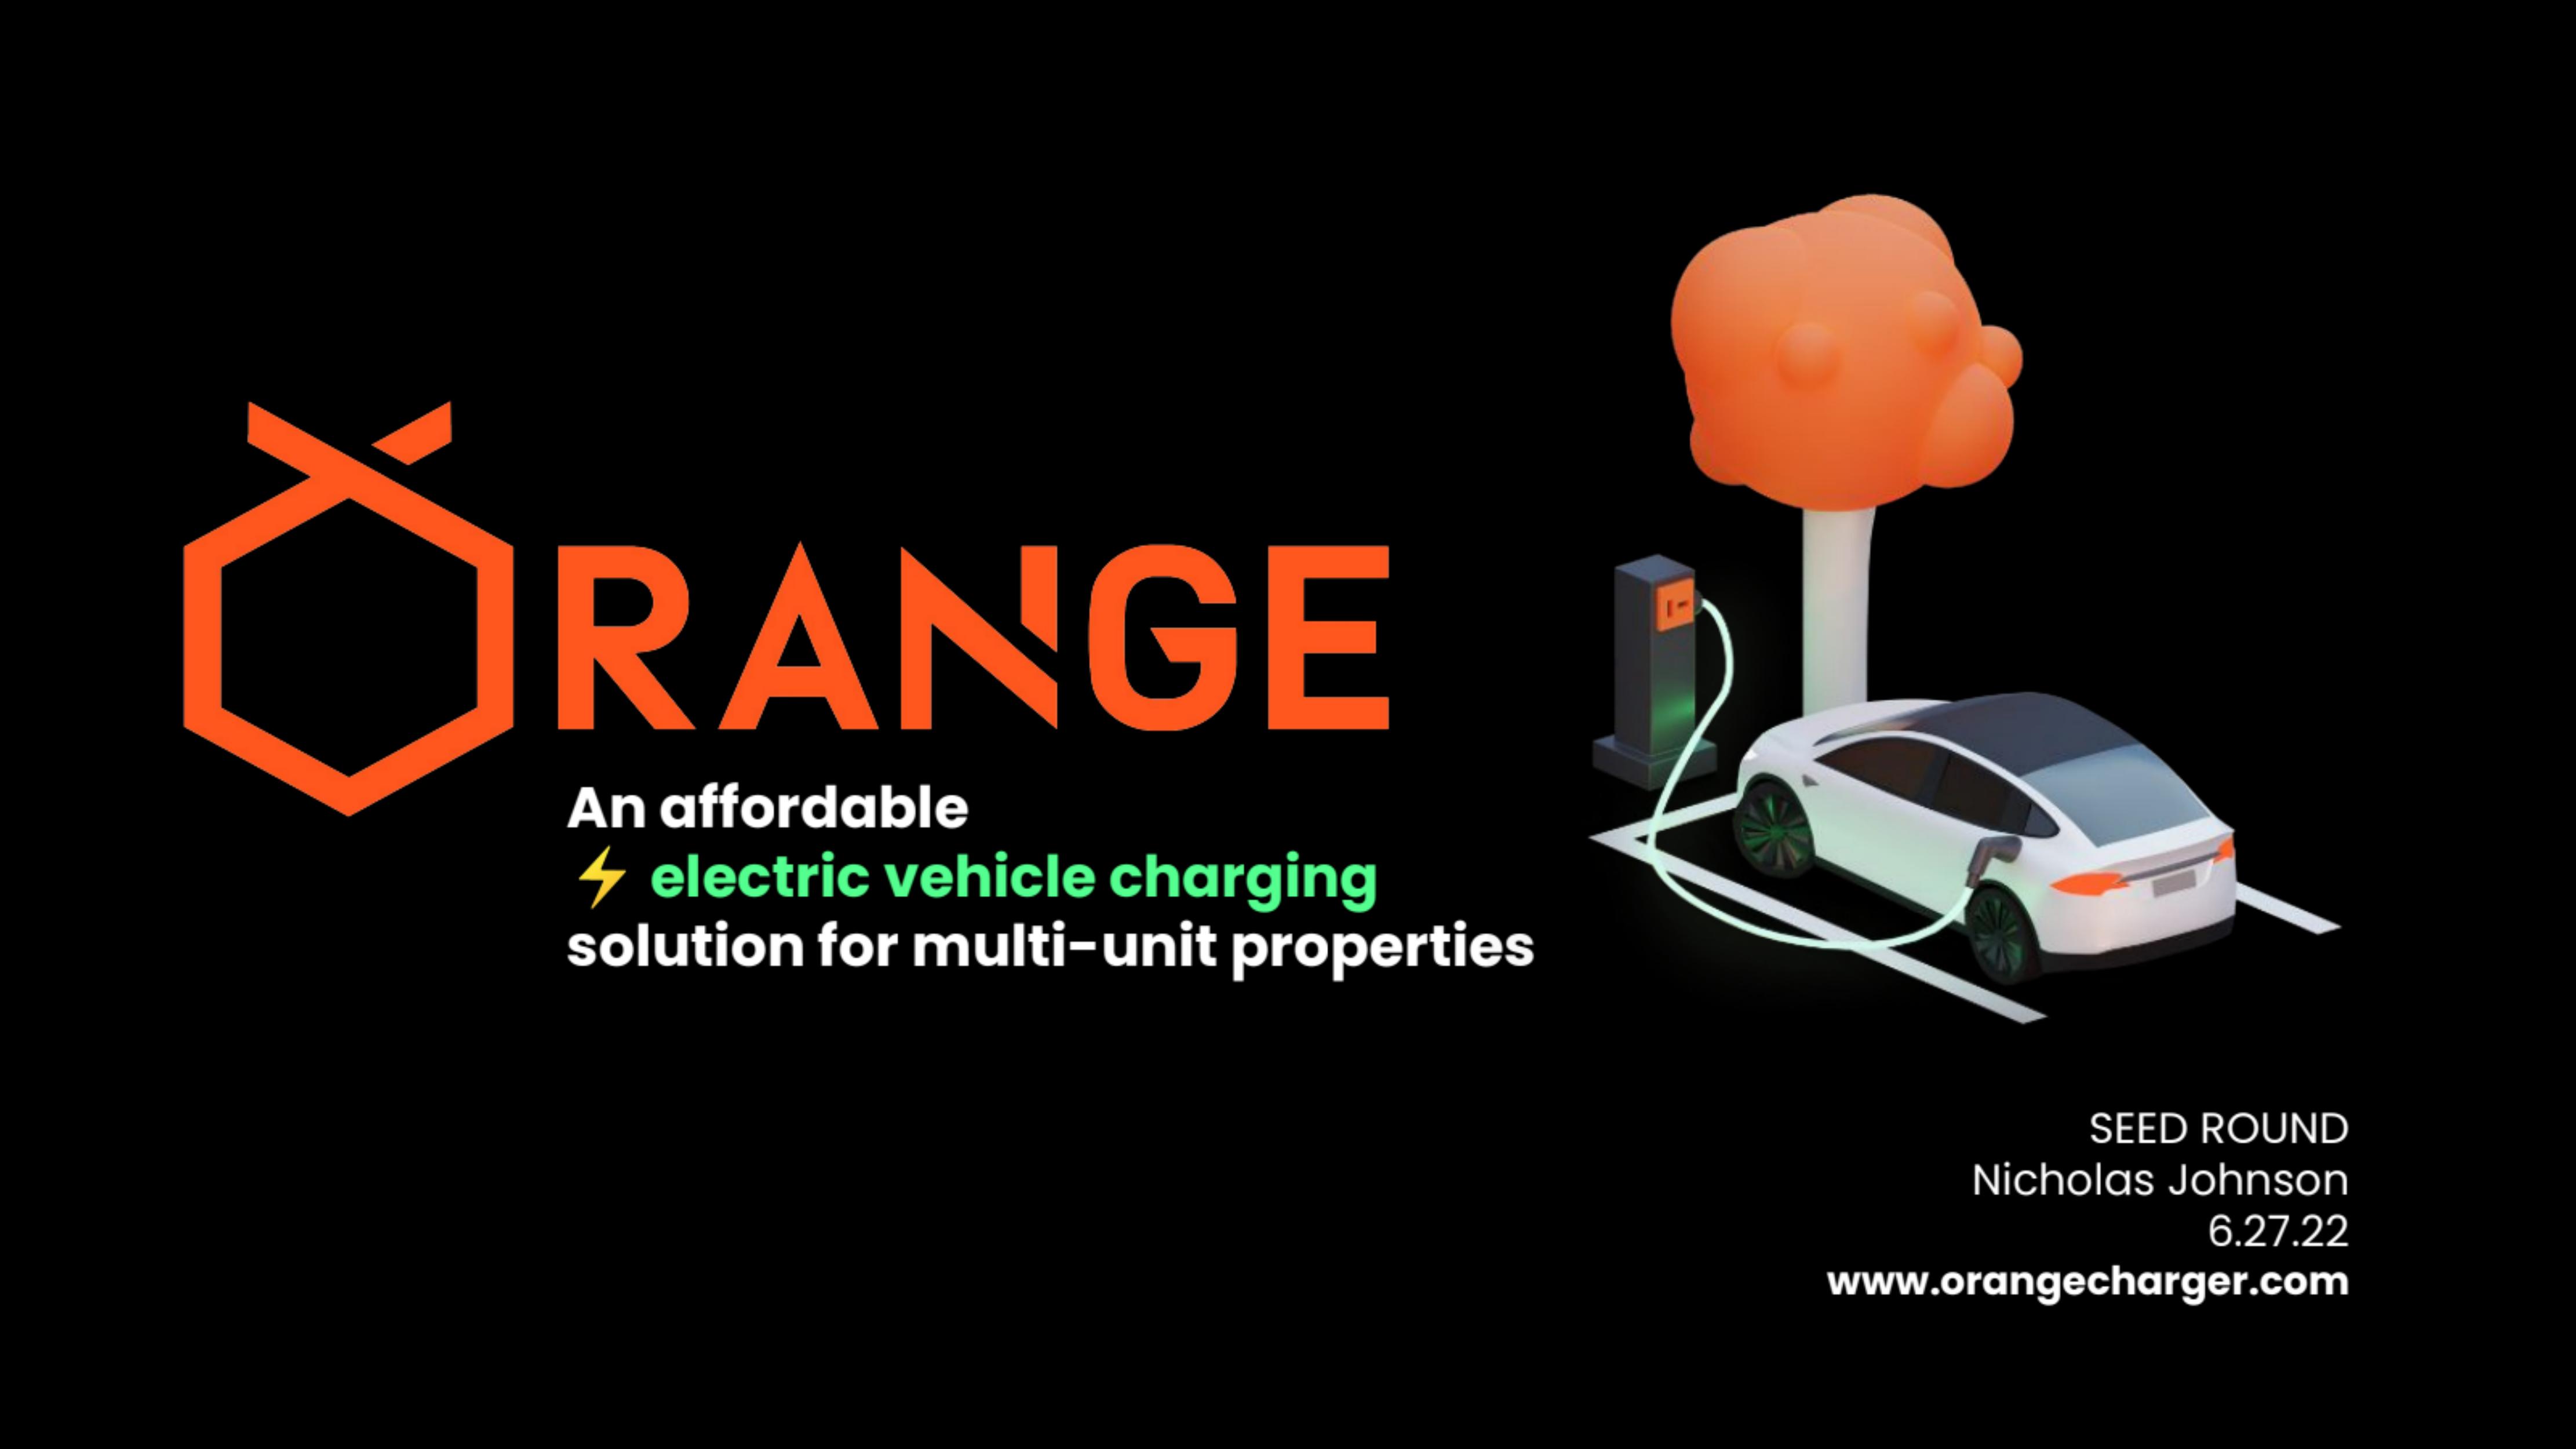
How to build a detailed financial model for Orange
A complete walkthrough of the business, drivers, and assumptions behind the downloadable Orange model - distilled from its pitch deck and publicly available information.
Product & value proposition
- Hardware: Orange Outlet NEMA 5-20 (120V, 1.92 kWh, 16A, 5 mph added/hr) and NEMA 6-20 (240V, 3.84 kWh, 16A, 15 mph added/hr). Cable-free design removes main failure point.
- Software: Mobile app for EV drivers (payment, charging history). Property-owner dashboard (statement history, energy data). Proprietary software to source clean energy.
- Value to property: 60% lower installation cost vs. other Level 2 solutions; $1,100 all-in fixed cost vs. $5,600–$6,200 for competitors; 5-year break-even vs. 33–36 years for competitors.
- Compliant with CDFA code to sell $/kWh and tracks utility energy cost - differentiators no competitor offers simultaneously.
Market
- US TAM: $8.4B; calculation: 52.6M people in multi-family housing × 32% EV adoption (2032) = 16.8M EV drivers × $504 blended revenue per driver.
- Underlying population: 276M total US vehicles; 96.6M projected EVs by 2032.
- EV adoption trajectory: Bloomberg projects EVs reach 35% of all vehicles by ~2033; cost parity with ICE by 2025 as catalyst.
- SOM target (internal): $100M ARR = 170k active EV drivers at $590 blended revenue per install.
- SAM: Not explicitly broken out separately from TAM in deck.
- Regulatory tailwind: EV charging becoming required for new construction and renovation in a growing number of states.
Revenue model
Three revenue streams per installation:
| Stream | Unit Price | Frequency |
|---|---|---|
| Hardware sale (NEMA 6-20 Cellular) | $350 | One-time per outlet |
| Orange Care (5-year warranty) | $75 | One-time per outlet |
| Yearly Network / SaaS fee | $240 per driver | Annual recurring |
| Energy fee (5% of property energy revenue) | ~$157 per driver | Annual recurring |
- Total yearly revenue per 10-outlet install: $8,224
- Property pays $216/yr annual service fees + 5% commission on energy revenue
- Sales channel: B2B direct to apartment complex owners/operators; working with Sares Regis, Greystar, BLVD Residential, AvalonBay, Irvine Company
- Hardware COGS implied: $350 × (1 − 77% margin) ≈ $80/unit
Traction & metrics
- Properties installed: 24 properties and counting
- Active B2B pipeline: 5 named large multifamily operators (Greystar, AvalonBay, Irvine Company, Sares Regis, BLVD Residential)
- Projected cash flow to EBITDA positive: ~Oct 2023 at 10k installations; total revenue reaching ~$1M and EBITDA ~$750k by end of 2023 trajectory on that chart.
- No historical revenue figures stated in deck (pre-revenue or very early).
Unit economics
All from unless noted:
- Hardware ASP: $350 (NEMA 6-20 Cellular) + $75 warranty = $425 upfront per unit
- Annual recurring per EV driver: $240 (network fee) + $157 (energy fee) = $397/driver/yr
- Blended first-year revenue per install (10 units): $8,224
- Profit margin on sales: 77%
- CAC: $3,000 per property (implied per 10-unit install)
- LTV (5-year): $10,211
- LTV:CAC ratio: 3×
- Property-level CAPEX (20 Orange outlets): $22,000 installed; competitor Level 2 is $70,000 for 10 units
- Annual OPEX per property (20 outlets): $1,440 vs. $2,400–$3,000 for competitors
- 10-year property profit (Orange, 20 outlets): $31,118 vs. losses of $(67,963)–$(70,102) for competitors
- Electricity charged to driver: $0.39/kWh
Competition / moat
Competitors named: Plugzio, ChargePoint, Xeal, EverCharge.
Orange's advantages:
- Lowest hardware cost ($350 vs. $400–$2,000) and lowest total install cost ($1,100 vs. $2,000–$6,200)
- Only solution that both meets CDFA code (sell $/kWh) AND tracks utility energy cost
- 5-year property break-even vs. 33–36 years for alternatives
- Cable-free design reduces maintenance failure points
- Moat: proprietary energy management software; regulatory compliance advantage; team with deep Tesla/EverCharge pedigree
Team & funding ask / use of funds
Team:
- Nicholas Johnson (CEO): Tesla thermal electrical engineer (Model 3); CTO/co-founder LYT.ai
- Neil Joseph (Head of Ops): CEO & founder Stack Lighting (acquired by Philips); Tesla head of delivery (Model S)
- Joseph Nagle (Head of Corporate Strategy & Marketing): 6 years corporate strategy at EverCharge (acquired by S&K)
- Volker Schönefeld (Fullstack Software Engineer): serial entrepreneur, mobile games
- Don MacNeil (Head of Sales): ex-Tesla, Juice Bar, Semaconnect
Advisors: Martin Eberhard (Tesla co-founder), Marc Tarpenning (Tesla co-founder), Mike Harrigan (original VP Sales Tesla), Sven Thesen (EverCharge EV policy, Nobel Prize climate research), Jonathan Crowder (Intelis Capital, EV/clean energy investor)
Funding ask: $2M Seed Round
Use of funds:
- Deploy 5k units → $1.4M ARR within 12 months
- Grow sales, engineering, and customer support teams
- Increase supply chain capacity to reach 10k units sold
- Expand to 4 large multifamily property company partnerships
Recommended financial model
Archetype + why: Hardware + recurring-revenue (SaaS/usage hybrid) P&L with unit cohort buildup. Orange is not pure SaaS nor pure hardware - the right model is a unit-economics cohort model where each property/install generates one-time hardware revenue upfront plus annuity recurring streams. This is closest to an IoT/hardware-as-a-platform model (think Samsara, SmartRent), best modelled as a cohort ARR build rather than pure ARR SaaS.
Forecast horizon & granularity: Monthly for 2022–2023 (given slide 13 shows monthly cash flow targets); annual summary for 2024–2026. Three years total operating forecast.
Key drivers & assumptions:
| Driver | Value | Source |
|---|---|---|
| Hardware ASP (NEMA 6-20 Cellular) | $350/unit | - |
| Warranty attach (Orange Care) | $75/unit | - |
| Warranty attach rate | 100% | deck shows it in every 10-unit example |
| Annual network fee per driver | $240 | - |
| Annual energy fee per driver | $157 | - |
| Energy commission rate | 5% of property energy revenue | - |
| Hardware COGS per unit | ~$80 (implied by 77% GM) | - |
| Gross margin on hardware | 77% | - |
| CAC per property (10-unit install) | $3,000 | - |
| Units deployed (k): 2022 / 2023 / 2024 | 3k / 18k / 26k | - |
| Bookings ($M): 2022 / 2023 / 2024 | $1.20M / $8.75M / $17.50M | - |
| COGS ($M): 2022 / 2023 / 2024 | $0.63M / $4.59M / $9.19M | - |
| Gross margin ($M): 2022 / 2023 / 2024 | $0.70M / $3.50M / $7.00M | - |
| GM%: 2022 / 2023 / 2024 | 58% / 60% / 60% | - |
| Opex ($M): 2022 / 2023 / 2024 | $3.20M / $10.40M / $20.00M | - |
| Net income ($M): 2022 / 2023 / 2024 | $(2.0M) / $(1.65M) / $(2.5M) | - |
| Headcount EOY: 2022 / 2023 / 2024 | 8 / 41 / 94 | - |
| MMR goals ($k): 2022 / 2023 / 2024 | $120k / $250k / $400k | - |
| Cash at end of period ($M): 2022 / 2023 / 2024 | $2.2M / $4.8M / $8.2M | - |
| Avg units per property | ~20 | based on slide 11 example; deck uses 10 in unit econ table |
| Driver utilization rate (drivers / outlet) | 1:1 | each outlet serves 1 primary EV driver for recurring revenue |
| Electricity price to driver | $0.39/kWh | - |
| Blended install cost (hardware + labor, to property) | ~$1,100 for 10 units | - |
| Seed round raised | $2.0M | - |
| Average commute distance | 50 miles/day → 3.3 hrs/charge on 6-20 | - |
| Avg salary per FTE | ~$120k blended; implied by opex ÷ headcount |
Scenarios (Base / Bull / Bear - which variables flex):
- Base: Deck projections - 3k / 18k / 26k units deployed 2022–2024; 60% GM; $2M seed.
- Bull: Faster B2B pipeline conversion with named partners (Greystar, AvalonBay); 20k / 30k / 50k units; energy fee growth as EV adoption accelerates; additional funding round in 2023.
- Bear: Slower property owner adoption; 2k / 8k / 15k units; hardware COGS pressure from supply chain; GM compresses to 50%; cash burn exhausts seed before break-even.
- Flex variables: units deployed per quarter, CAC, hardware ASP, energy fee $/driver, headcount growth pace, GM%.
Required sheets / outputs:
- Assumptions - all drivers above, centralized, colour-coded
- Unit Cohort Build - monthly new installs × units/property; cumulative active outlets and active EV drivers; cohort-level recurring revenue by vintage
- Revenue Build - hardware + warranty (one-time), network fee + energy fee (recurring), split by month/year
- P&L (Income Statement) - Bookings, COGS, Gross Profit, GM%, Opex by department (R&D, S&M, G&A, Ops), EBITDA, Net Income
- Headcount Plan - by department (Eng, G&A, Mktg, Ops, Sales); EOY totals matching deck
- Cash Flow - operating, investing (capex / inventory), financing (seed inflow); ending cash balance (validates slide 21: $2.2M / $4.8M / $8.2M)
- Unit Economics Summary - CAC, LTV (5-yr), LTV:CAC, payback period, per-property ROI vs. competitors
- Market Sizing - TAM/SAM/SOM build from population → EV adoption → multifamily penetration
- Scenario Toggle - Base / Bull / Bear switch driving key outputs
Frequently asked
Is the Orange financial model free?+
Yes. The Orange model is a free Excel (.xlsx) download with live formulas. Sign up with your email and the workbook is yours to keep, review, and edit.
What's included in the model?+
A 5-year monthly forecast with P&L, cash flow and runway, valuation (exit multiple plus a DCF cross-check), MOIC/IRR returns, and unit economics, with live formulas throughout.
How was this model built?+
It was built from Orange's pitch deck and publicly available information, then structured to investment-banking standards as a fully editable Excel model.
Can I change the assumptions?+
Yes. You can change assumptions and the live formulas will recalculate in the downloadable Excel model.
Have more financial modelling questions? Contact us

Created by ex-finance professionals
Hey, I’m Alex and I created Finamodel.
Over my years in the finance industry I kept building the same models over and over again. Same structure, same assumptions, different logo. So I started building frameworks to turn them into clean, reusable templates.
Every model here is one I’d actually use for a client, and I personally vet each one before it goes up.
I’m not an expert in every industry, but I’ve built enough models to know what belongs in one. And when something is completely foreign to me, I reach out to my network for experts to work on our models with us.
Having a template library on hand cuts a first build from hours to minutes.
Need help finding your model? You’ll find me in the Finamodel app!
Other Climate/Energy Startup Financial Models
Browse another startup in the same category.

Abatable
Robo-advisor platform for sourcing and managing high-quality carbon removal offsets, targeting asset managers.
Bower
Mobile app that rewards consumers for scanning and recycling consumer packaging at existing bins, monetised by CPG brand subscriptions and consumer data.
Bramble Energy
UK deep-tech company commercialising a PCB-based hydrogen fuel cell stack (PCBFC™) for portable power and mobility applications.

Cervest
AI-powered Climate Intelligence platform that quantifies physical climate risk at the asset level, delivered as a freemium SaaS product.

Clockworks Analytics
B2B SaaS platform providing automated fault-detection and diagnostics (FDD) analytics for commercial and institutional building portfolios.

Dandelion Energy
Dandelion Energy installs residential geothermal heat pump systems (ground-source HVAC) with in-house financing, targeting US homeowners on fossil-fuel heating.

Emitwise
B2B SaaS platform automating corporate carbon footprint tracking, reporting, and reduction using machine learning.
Fisker
Fisker is an asset-light, design-led EV company merging with Spartan Energy Acquisition Corp. in a SPAC transaction to fund the launch of the Fisker Ocean SUV.


