 Picnic Financial Model
Marketplace Startup Financials (Free Excel Download)
Picnic Media Limited is a digital advertising network operating a "Social Display" marketplace - bringing social-media-style ad formats (Stories, Posts, Swipe Right) to mobile web publishers via Google AMP inventory.



professionals from Deloitte
Used by professionals from






About this model
Picnic is a digital advertising network that brings social-media-style ad formats to mobile web publishers through Google AMP inventory. Its Stories, Posts, and Swipe Right units give advertisers a more interactive format while helping publishers monetize inventory more effectively.
The business reported a $2 million annual run rate by the end of its second year, 150% annual revenue growth for three successive years, and profitability since launch. It earns a share of advertiser spend and passes the balance to publishers, through managed-service and self-serve buying channels.
The model is an AdTech gross-to-net revenue build. Advertiser accounts, campaign spend, impression supply, fill rate, CPM, and take rate determine net revenue, while publisher payouts create the primary cost of revenue. Self-serve adoption, publisher yield, sales productivity, and geography mix drive margin and operating leverage.
A turnkey financial model
Live formulas, no hardcoded values
Outputs are driven by live formulas, so the workbook updates from its assumptions instead of relying on hardcoded results.
All assumptions in one tab
Inputs are clearly marked in the Assumptions tab and separated from calculations, making it clear what to change and what to leave intact.
Statements always balancing
For integrated-statement models, the balance sheet, cash flow, and supporting schedules tie through properly.
Distinct schedules for clarity
Debt, working capital, taxes, and cash flow can get messy quickly. We group calculations in clear schedules, not across disconnected tabs.
No hidden macros or external links
There are no unexplained external workbook links or macros to undermine auditability or portability.
Changes flow through the model
Update a key driver and see the impact carry through the forecast, financing, and return outputs. We never use hardcoded numbers in formulas.
About Picnic
picnic.app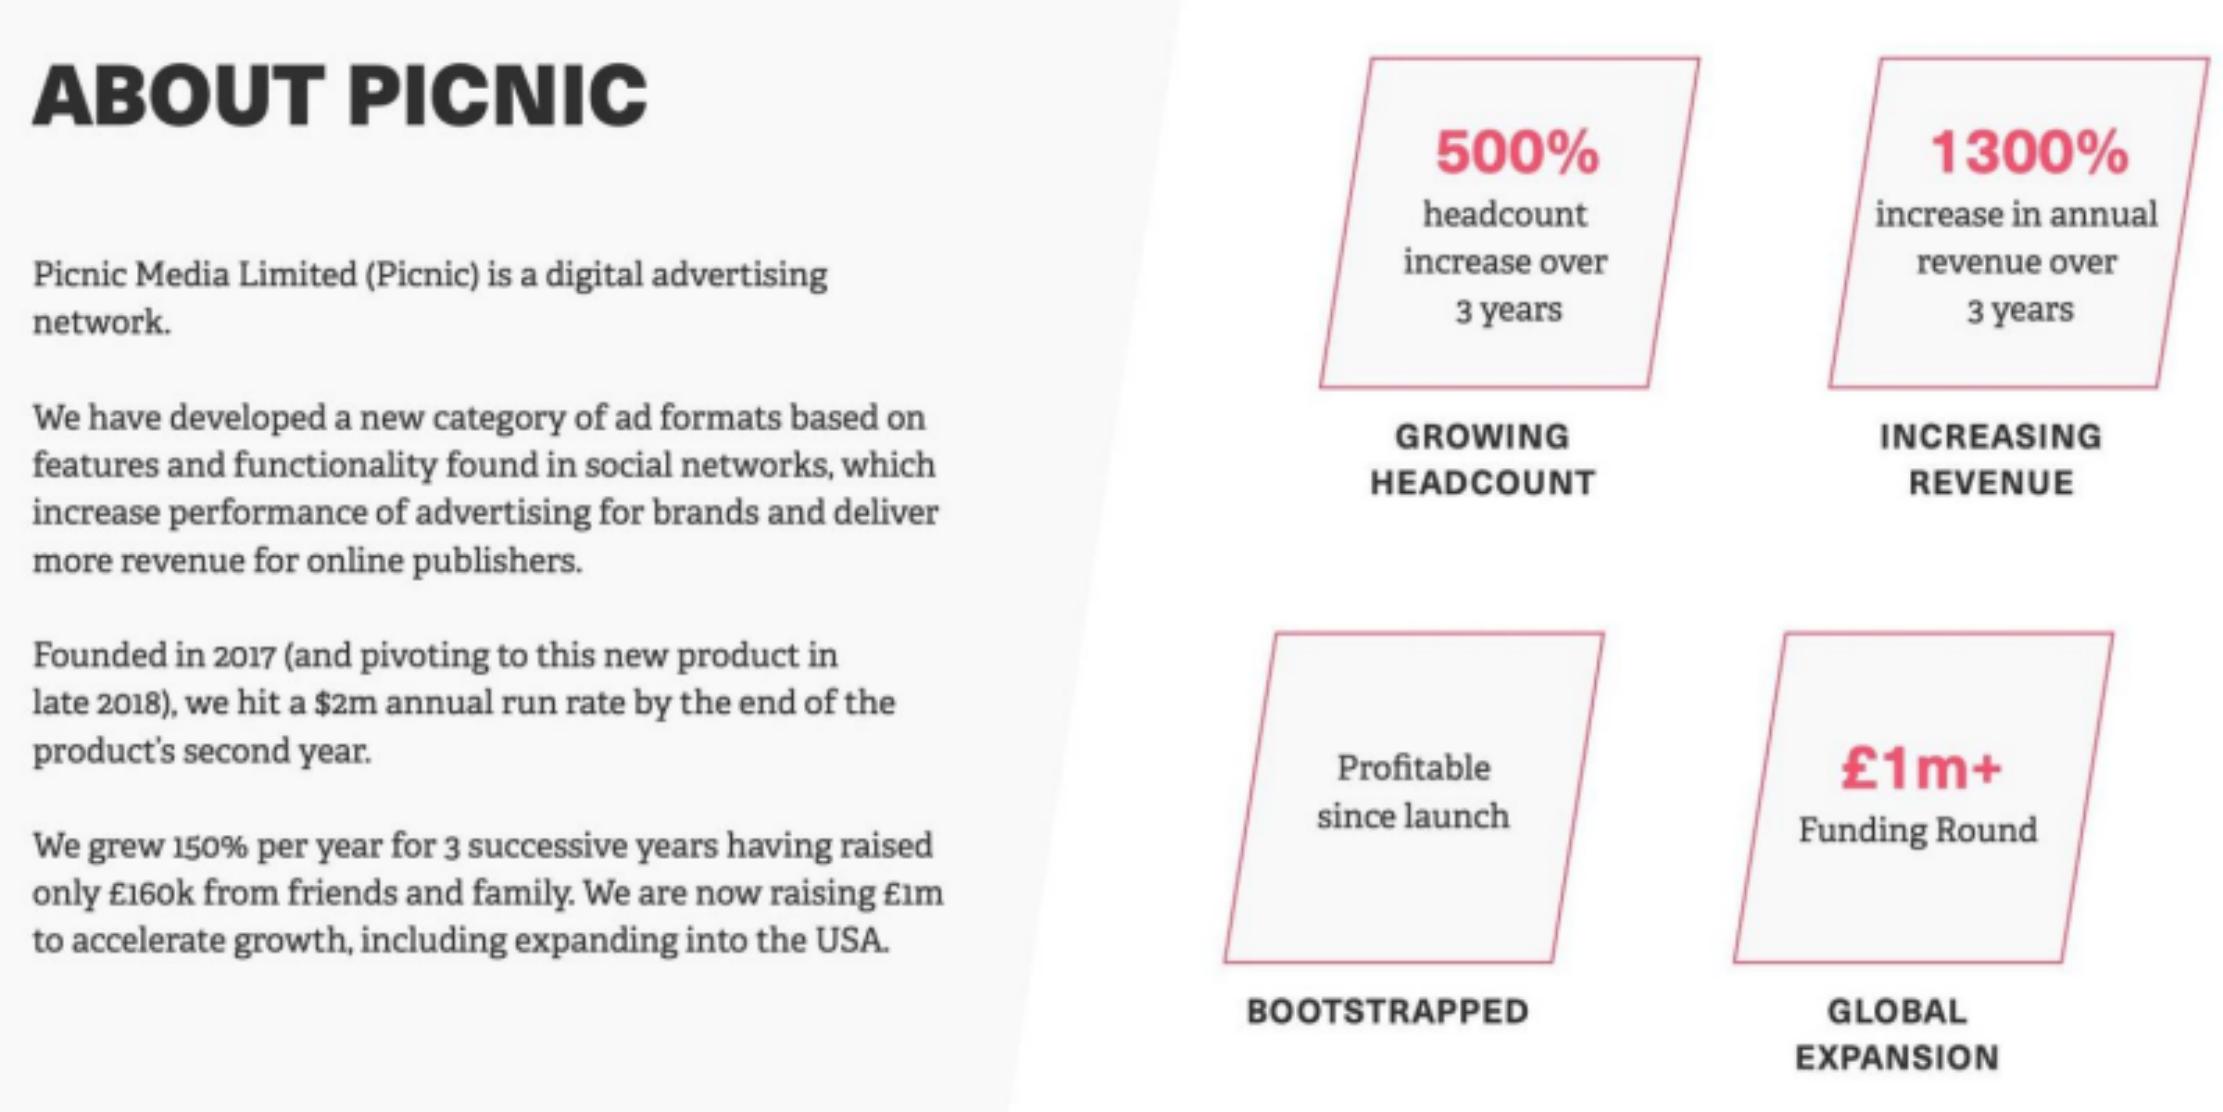
How to build a detailed financial model for Picnic
A complete walkthrough of the business, drivers, and assumptions behind the downloadable Picnic model - distilled from its pitch deck and publicly available information.
Product & value proposition
- "Social Display" ad formats (Stories, Posts, Swipe Right) served mid-article on mobile web pages running Google AMP - targeting the gap between Facebook/Instagram ads and standard display.
- Three-sided marketplace: advertisers get higher ROI (5x ROI case study cited); agencies get a new margin-accretive channel; publishers get higher yield on hard-to-monetise inventory.
- Key technical moat: all inventory is served exclusively on Google AMP pages, guaranteeing fast/smooth UX comparable to Instagram.
- Self-serve buying technology launched (date visible on traction chart as approx. mid-2020).
- Awards: Digiday Best Digital Product Innovation; TheWires Best New Product.
Market
Source: Worldwide Digital Ad Spending 2021, eMarketer.
| Layer | UK | USA |
|---|---|---|
| TAM - Mobile Digital Display | £10B (12% 5yr CAGR) | £78B (13% 5yr CAGR) |
| SAM - Non-Facebook Mobile Digital Display | £3.1B | £31B |
| SOM - Picnic target (3% of SAM) | £93M | £930M |
Revenue model
- Marketplace model: Picnic takes a percentage of advertiser spend placed through its platform; publishers receive a revenue share of the remaining amount.
- Formats sold: Stories, Posts, Swipe Right (interactive social display units).
- Buying channels: managed service (agency/brand direct) + self-serve platform launched ~2020.
- Currency: GBP (UK base); USD for US expansion.
Traction & metrics
- $2m annual run rate achieved by end of product's second year (i.e. ~end of 2020).
- 1,300% increase in annual revenue over 3 years (2018–2021).
- 500% headcount increase over 3 years.
- 150% YoY revenue growth for 3 successive years.
- Profitable since launch; 2019 = first profitable year; 2020 = second profitable year.
- Traction chart (slide 6) shows Gross Profit on a quarterly basis from Q1 2017 through Q2 2021; the trajectory is sharply upward into 2021 with the highest GP quarter visible at the right edge (post-Digiday award). No absolute GP values labelled on the y-axis.
- Total external funding prior to this raise: £160k SEIS (friends & family, Jan 2017).
- Clients: named on traction chart image but not legible at resolution reviewed.
Unit economics
- 5x ROI case study cited for advertisers.
- 97% increase in brand message association cited.
- No CAC, LTV, payback period, gross margin %, or take-rate disclosed in deck.
Competition / moat
Three competitive clusters:
- High-impact display advertising marketplaces with similar business models but different niches (Native, Rich Media): JustPremium, TripleLift, Kargo, Teads - comp set for exits/multiples.
- Social Display format-only creative platforms (not full marketplace): Spaceback, Polar.
- Picnic's claimed unique position: only product where every ad is served on Google AMP, delivering Instagram-speed UX - cited as "substantial moat".
Exit comps cited:
- TripleLift + Vista Equity Partners: £1.4B acquisition; TripleLift had previously raised only $16.6m.
- Liftoff + Blackstone: £400m investment for majority stake; Liftoff had previously raised only $6.8m.
Team & funding ask / use of funds
- Funding ask: £1m.
- Use of funds (% allocation):
- 50% International Expansion (US: NYC launch 6 months, West Coast 18 months, RoW 24 months)
- 35% R&D
- 15% Publisher Solution relaunch (9 months)
- "Social Context" Targeting product: 12-month milestone.
- Prior raise: £160k SEIS only.
Recommended financial model
Archetype + why: AdTech marketplace revenue model - specifically a Gross Revenue / Net Revenue (take-rate) P&L combined with a headcount-driven opex build. Picnic sits at the intersection of a managed-service ad network and a self-serve marketplace; the right model tracks Gross Ad Spend → Gross Revenue (publisher payout subtracted) → Net Revenue → GP → EBITDA. This is analogous to the TripleLift/Teads comp set, not a SaaS ARR model. A lightweight 3-statement output (IS + CF) is sufficient; balance sheet is thin given asset-light model.
Forecast horizon & granularity:
- Quarterly actuals: Q1 2017 – Q2 2021 (to anchor on traction chart shape).
- Monthly forecast: H2 2021 – Dec 2023 (18-month post-raise operating plan horizon).
- Annual summary: 2021–2025.
Key drivers & assumptions:
| Driver | Value |
|---|---|
| Annual run-rate revenue at raise date | ~$2m (~£1.5m at ~0.75 $/£) |
| Historical revenue CAGR (2018–2021) | ~150% YoY |
| Forecast YoY revenue growth - Base | 80% (deceleration post-raise, US ramp) |
| Forecast YoY revenue growth - Bull | 130% |
| Forecast YoY revenue growth - Bear | 40% |
| Marketplace take-rate (net revenue / gross spend) | 30% |
| Publisher revenue share | 70% of gross |
| Cost of revenue (hosting, ad serving, CDN) | 10% of net revenue |
| Gross margin on net revenue | ~90% |
| Headcount at raise | ~6 FTE (500% growth over 3 years from implied 1-2) |
| Post-raise hiring plan | +4 FTE in 6 months (US sales/ops), +3 FTE in 12 months (R&D) |
| Average fully loaded cost per FTE | £60k/yr UK; £90k/yr US |
| S&M spend | 20% of net revenue |
| G&A | £150k/yr base + 5% of revenue |
| Use-of-funds burn (£1m over 18 months) | ~£55k/month |
| Break-even maintained | Yes (profitable prior to raise) |
| FX rate GBP/USD | 1.35 |
| US revenue contribution (Year 1 post-raise) | 15% of total |
| US revenue contribution (Year 2) | 35% |
Scenarios (Base / Bull / Bear - which variables flex):
- Primary flex variable: revenue growth rate (UK retention + US ramp speed).
- Secondary: take-rate (could compress under publisher negotiation pressure or programmatic shift).
- Tertiary: US hiring pace and cost (£500k of raise earmarked for international).
- Bear case: US launch delayed to month 12; UK growth slows to 40% YoY.
- Bull case: US NYC launch on schedule; US contributes 25% of revenue by month 12.
Required sheets / outputs:
- Assumptions - all drivers above, clearly labelled, one input per cell.
- Revenue Build - Gross Ad Spend → Publisher Payout → Net Revenue, by geography (UK / US / RoW), quarterly.
- P&L (IS) - Net Revenue → Gross Profit → EBITDA → Net Income, monthly then annual summary.
- Headcount Plan - FTE by department (Sales, R&D, Ops/Publisher, G&A) with hire dates and cost.
- Use of Funds - £1m allocation tracked against actuals over 18 months.
- Cash Flow - simplified operating CF; validate profitability claim and runway post-raise.
- Scenario Toggle - Base / Bull / Bear switcher on assumptions sheet.
- Comps Reference - static table: TripleLift and Liftoff exit multiples for context (EV/Revenue at exit).
Frequently asked
Is the Picnic financial model free?+
Yes. The Picnic model is a free Excel (.xlsx) download with live formulas. Sign up with your email and the workbook is yours to keep, review, and edit.
What's included in the model?+
A 5-year monthly forecast with P&L, cash flow and runway, valuation (exit multiple plus a DCF cross-check), MOIC/IRR returns, and unit economics, with live formulas throughout.
How was this model built?+
It was built from Picnic's pitch deck and publicly available information, then structured to investment-banking standards as a fully editable Excel model.
Can I change the assumptions?+
Yes. You can change assumptions and the live formulas will recalculate in the downloadable Excel model.
Have more financial modelling questions? Contact us

Created by ex-finance professionals
Hey, I’m Alex and I created Finamodel.
Over my years in the finance industry I kept building the same models over and over again. Same structure, same assumptions, different logo. So I started building frameworks to turn them into clean, reusable templates.
Every model here is one I’d actually use for a client, and I personally vet each one before it goes up.
I’m not an expert in every industry, but I’ve built enough models to know what belongs in one. And when something is completely foreign to me, I reach out to my network for experts to work on our models with us.
Having a template library on hand cuts a first build from hours to minutes.
Need help finding your model? You’ll find me in the Finamodel app!
Other Marketplace Startup Financial Models
Browse another startup in the same category.

Acquco
Amazon brand aggregator - acquires third-party Amazon seller businesses at attractive multiples, then scales them via proprietary growth playbooks and technology.
Arive
Premium q-commerce app delivering lifestyle and branded products in under 30 minutes across German cities.

Audience Town
Vertical data and advertising platform targeting home movers across the entire home journey - pre-move through post-move.

AudioMob
Non-intrusive in-game audio ad platform bridging music/brand advertisers to mobile game publishers.

Authoritive
Two-way messaging platform that turns creator expertise into scalable, push-delivered learning experiences via SMS/WhatsApp.

Avo
Building amenity and office perk platform delivering same-day grocery/pantry/goods to residential and commercial tenants via a white-label marketplace.
beehiiv
Newsletter platform for creators to build, grow, and monetize email audiences - SaaS subscription + native ad network revenue.
Borzo
Global same-day logistics marketplace connecting B2B merchants with crowdsourced couriers for last-mile delivery


