RIRiogrande Financial Model
Marketplace Startup Financials (Free Excel Download)
LatAm e-commerce brand aggregator - acquires, incubates, and scales third-party marketplace brands on Amazon and Mercado Libre.



professionals from Deloitte
Used by professionals from






About this model
RioGrande acquires, incubates, and scales third-party e-commerce brands across Amazon and Mercado Libre in Latin America. It uses supply-chain renegotiation, growth marketing, channel expansion, and its own API linking marketplaces, ERP, and warehouse systems to improve brand operations.
The company reported $9 million of revenue and $1.7 million of EBITDA in November 2021, with revenue growing more than 50% month over month in the preceding three months. It earns direct product sales from brands it owns rather than charging a marketplace commission.
The model is a multi-brand inventory portfolio P&L. Acquisitions, brand cohorts, SKU sales, pricing, marketplace fees, COGS, inventory, and channel mix roll into consolidated revenue and EBITDA. Deal cadence, post-acquisition growth, supply-chain savings, working capital, and regional expansion determine returns.
A turnkey financial model
Live formulas, no hardcoded values
Outputs are driven by live formulas, so the workbook updates from its assumptions instead of relying on hardcoded results.
All assumptions in one tab
Inputs are clearly marked in the Assumptions tab and separated from calculations, making it clear what to change and what to leave intact.
Statements always balancing
For integrated-statement models, the balance sheet, cash flow, and supporting schedules tie through properly.
Distinct schedules for clarity
Debt, working capital, taxes, and cash flow can get messy quickly. We group calculations in clear schedules, not across disconnected tabs.
No hidden macros or external links
There are no unexplained external workbook links or macros to undermine auditability or portability.
Changes flow through the model
Update a key driver and see the impact carry through the forecast, financing, and return outputs. We never use hardcoded numbers in formulas.
About Riogrande
riogrande.io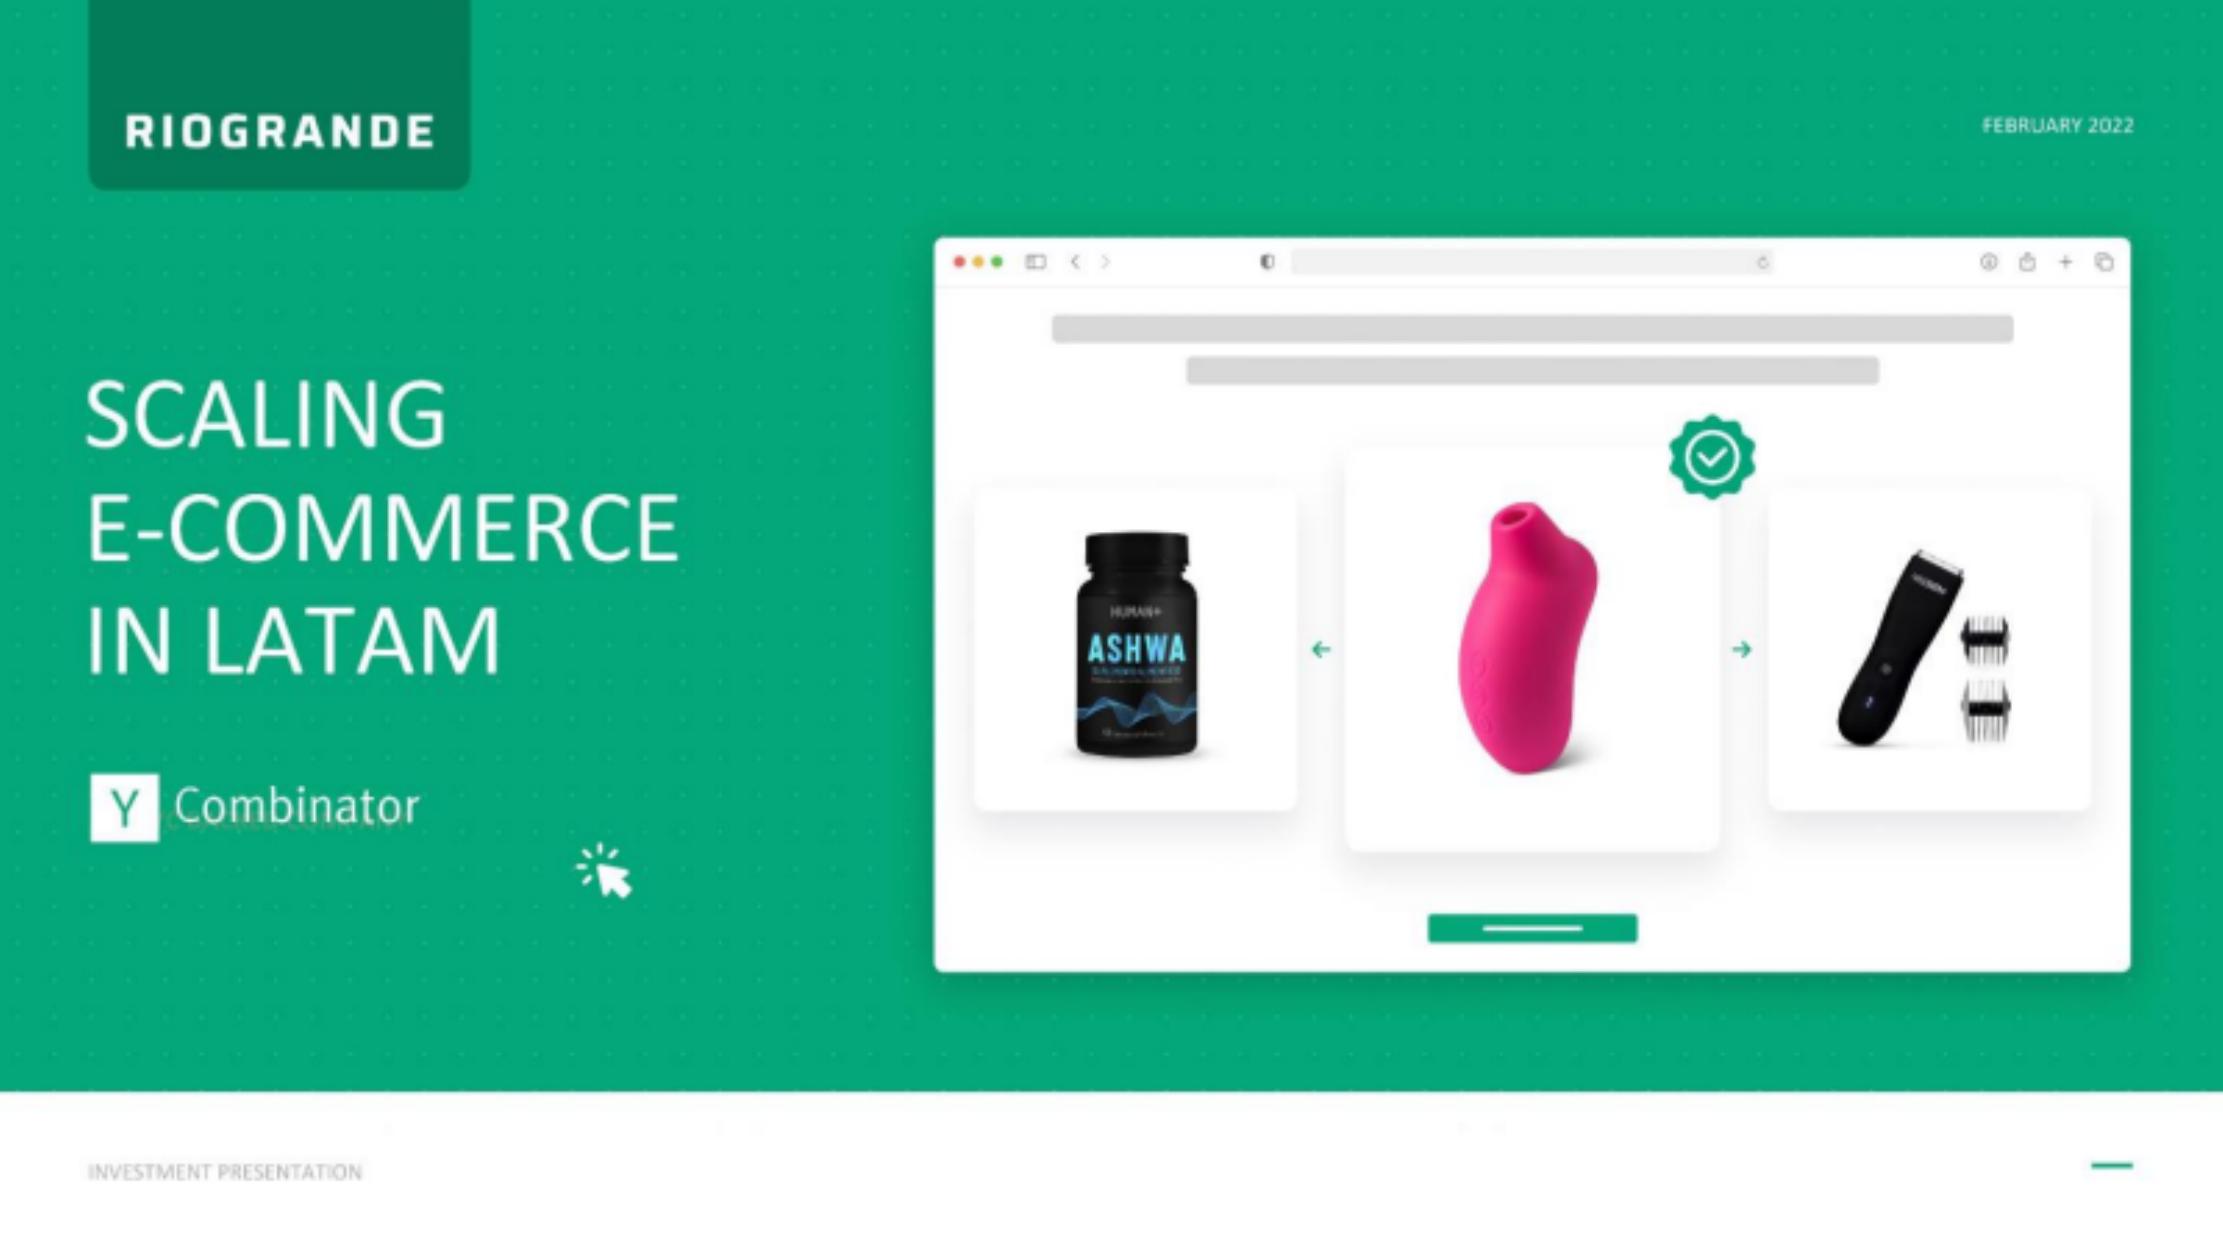
How to build a detailed financial model for Riogrande
A complete walkthrough of the business, drivers, and assumptions behind the downloadable Riogrande model - distilled from its pitch deck and publicly available information.
Product & value proposition
- Acquires underperforming or nascent marketplace brands on Amazon and Mercado Libre that lack capital, technology, data, and management expertise.
- Injects growth marketing, supply-chain renegotiation, channel expansion, and proprietary tech to unlock scale.
- Operates a proprietary tech platform (RioGrande API) connecting marketplace data feeds → ERP → WMS for real-time inventory, order, and product management.
- Current brand portfolio: I Love Shape (shapewear/underwear), Lust (sex toys), Yayos (footwear), Vigorem (men's shaver).
- Target categories: Women, Home, Shapewear, Sexual Wellness, Beauty & Personal Care, Nutrition.
Market
- LatAm e-commerce described as a "+$100B market".
- Total LatAm e-commerce revenue trajectory (US$B): $85B (2020) → $98B (2021E) → $109B (2022E) → $120B (2023E).
- LatAm e-commerce CAGR 2020–2024: avg 13.4%; by country - USA 6.2%, Colombia 10.7%, Brazil 11.7%, Chile 15.0%, Mexico 16.3%.
- Comparable brand analogs cited (US market): Spanx $1B company, Manscaped $1B company, Bountiful Company $1.85B sales (acquired by Nestlé for $5.75B), Lovehoney $75M sales, Shapermint $150M sales.
Revenue model
- Direct product sales through Amazon and Mercado Libre marketplace listings (owned brands).
- Plans for omni-channel expansion: other marketplaces/platforms, B2B sales channel.
- No pricing detail, AOV, or SKU-level data disclosed.
- Revenue model is inventory-based: buy/manufacture product, list on marketplace, earn GMV net of marketplace fees.
- Gross margin lever: renegotiate supply-chain/COGS agreements.
Traction & metrics
- Revenue (Nov-21): $9M.
- EBITDA (Nov-21): $1.7M.
- Revenue (Oct-21): $4.5M.
- EBITDA (Oct-21): $1.2M.
- MoM revenue growth last 3 months: 50%+.
- Revenue growth since Jul-21: 40x.
- Series started: Jun-21; curve near-zero through Jul-21, then exponential through Dec-21.
- 4M+ Amazon & Mercado Libre brands identified as unable to unlock exponential growth (addressable acquisition pipeline).
Unit economics
- EBITDA margin (Nov-21): ~18.9% ($1.7M EBITDA / $9M revenue).
- EBITDA margin (Oct-21): ~26.7% ($1.2M / $4.5M) - note: margin compression at Nov-21 may reflect reinvestment or scale.
Competition / moat
- Differentiated from pure 3P sellers by: tech platform (proprietary API/ERP/WMS stack), growth marketing expertise, data analytics, supply-chain leverage.
- Compares LatAm market to "US market 15 years ago - inefficient and fragmented" as a structural moat narrative.
- No named direct competitors (other LatAm brand aggregators) mentioned.
- Moat claims: first-mover brand aggregator in LatAm, operational synergies across brand portfolio, ML-powered automation roadmap (Phase 3, 2023+).
Team & funding ask / use of funds
- Co-Founder Ivan Amelong: 15+ yrs GM/CFO expertise LatAm; interim CFO Grow Mobility (YC), helped raise $210M equity; Finance/Ops Director at Dafiti (Rocket Internet).
- Co-Founder Tono Mandly: Exited e-commerce brand at age 16 (+400% revenue yr 2); expanded Grow Mobility to 10 countries/30 cities in 1 year.
- Co-Founder Fede Naides: 15+ yrs Ops/Supply Chain; Ops Director at Grow Mobility, Delivery Hero, Dafiti; managed $70M annual budget, led 3k+ FTE workforce.
- M&A Director Miguel de la Garza: $5B+ M&A/equity/debt transactions; Director at Televisa VC fund ($60M+ deployed).
- Growth Director Elena Manna: former Rappi Head of e-Commerce (10x sales in 12 months); Sephora Head of e-Commerce Mexico (300% YoY, #1 cosmetics marketplace).
- New Business Director Oscar Austria: Frubana Mexico Growth (250-person team, 9x GMV in 12 months); BCG consultant.
- Head of Engineering Marcos Lopez: former Ibushak CTO (grew backend from $10M to $40M+ revenue); Kavak senior engineer.
- Investors: Y Combinator, Harvard Management Company, L2 Ventures, Streamlined Ventures, JAM Fund, Pioneer Fund, Italic, Eight Sleep, Tinder (US); Mercado Libre, Jaguar Ventures, Rappi, Investo, Kavak, Clara (LatAm).
- Strategic goal stated: $250M run-rate revenue by 2023.
Recommended financial model
- Archetype + why: Multi-brand e-commerce portfolio / brand aggregator P&L. Revenue is product GMV across owned brands; the model must track acquisition pipeline + per-brand growth trajectories + consolidated P&L with EBITDA. Closest analog is a DTC/marketplace inventory P&L but with a portfolio roll-up layer and M&A acquisition mechanics. Not a SaaS or marketplace-take-rate model.
- Forecast horizon & granularity: Monthly, 2022–2024 (3 years). Monthly is essential given 50%+ MoM growth and rapid brand-level compounding. Annual summary sheet for board view.
- Key drivers & assumptions:
*Portfolio / M&A layer:*
- Number of brands acquired per quarter: 2–3/quarter in 2022, scaling to 4–5/quarter by 2023; rationale: Phase 2 GTM calls for rapid portfolio expansion.
- Average acquisition price per brand: $100K–$500K (revenue multiple of 1–2x trailing 3-month GMV); rationale: early-stage LatAm brands with thin access to capital; no deck data.
- Capital deployed per brand acquisition: includes purchase price + working capital injection ($50K–$200K inventory top-up).
*Per-brand revenue model:*
- Pre-acquisition monthly GMV baseline: $30K–$100K; rationale: these are "stuck" brands not yet growing exponentially.
- Post-acquisition MoM revenue growth: 50%+ MoM in first 3 months post-intervention; model uses 50% for first 3 months, decelerating to 20% months 4–6, then 10–15% steady-state.
- Brand revenue ramp duration: 12–18 months to peak growth rate, then maturation.
- Channel mix: Amazon / Mercado Libre split: 60% / 40% initially; shifts to broader channel mix in Phase 2.
*Margin structure:*
- Gross margin: 35–45%; rationale: typical branded DTC on marketplace, allowing for COGS improvement from supply-chain renegotiation; no gross margin disclosed in deck.
- Marketplace fees (Amazon/MeLi): 15–20% of GMV; built into COGS or as a line item.
- EBITDA margin: ~19% at Nov-21 (early stage, high growth); model targets 20–25% at scale.
- Fulfillment / logistics as % of revenue: 8–12%; rationale: LatAm logistics complexity; no data in deck.
- Marketing / growth spend as % of revenue per brand: 15–20% during scale phase; rationale: growth marketing is a core lever.
- G&A / central platform costs: flat cost base scaling sub-linearly (operating leverage thesis per deck slide 5).
*Top-line targets:*
- Run-rate revenue by end-2023: $250M stated target (slide 12); back-solve: implies ~$20M/month by Dec-23.
- Nov-21 run-rate (actual): $9M/month = ~$108M annualised.
*Working capital:*
- Inventory days: 45–60 days; rationale: marketplace fulfilment model with local warehousing (WMS referenced).
- Payables days: 30 days to suppliers.
- Receivables days: 7–14 days (marketplace remittance cycles).
- Scenarios (Base / Bull / Bear - which variables flex):
- Base: 2–3 brand acquisitions/quarter, 50% MoM growth for 3 months post-acquisition, 40% gross margin, $250M run-rate by end-2023.
- Bull: 4–5 acquisitions/quarter, 60%+ MoM growth sustained for 4 months, 45% gross margin (faster supply-chain wins), $350M+ run-rate.
- Bear: 1–2 acquisitions/quarter, 30% MoM growth (slower brand integration), 35% gross margin, $100–130M run-rate by 2023.
- Required sheets / outputs:
- Assumptions - all drivers, acquisition pace, per-brand growth curve, margin targets.
- Brand Portfolio - one row per brand; month-by-month revenue, acquisition date, EBITDA contribution.
- Consolidated P&L - GMV → net revenue → gross profit → EBITDA → EBIT → net income (monthly + annual).
- Working Capital & Cash Flow - inventory build, AP/AR, capex (tech platform), acquisition spend.
- Balance Sheet (simplified) - to track equity/debt capacity for brand acquisitions.
- Funding & M&A - acquisition pipeline, capital deployed, implied valuation (revenue multiple on exit).
- Dashboard - portfolio KPIs: total brands, revenue run-rate, blended EBITDA margin, cash runway.
Frequently asked
Is the Riogrande financial model free?+
Yes. The Riogrande model is a free Excel (.xlsx) download with live formulas. Sign up with your email and the workbook is yours to keep, review, and edit.
What's included in the model?+
A 5-year monthly forecast with P&L, cash flow and runway, valuation (exit multiple plus a DCF cross-check), MOIC/IRR returns, and unit economics, with live formulas throughout.
How was this model built?+
It was built from Riogrande's pitch deck and publicly available information, then structured to investment-banking standards as a fully editable Excel model.
Can I change the assumptions?+
Yes. You can change assumptions and the live formulas will recalculate in the downloadable Excel model.
Have more financial modelling questions? Contact us

Created by ex-finance professionals
Hey, I’m Alex and I created Finamodel.
Over my years in the finance industry I kept building the same models over and over again. Same structure, same assumptions, different logo. So I started building frameworks to turn them into clean, reusable templates.
Every model here is one I’d actually use for a client, and I personally vet each one before it goes up.
I’m not an expert in every industry, but I’ve built enough models to know what belongs in one. And when something is completely foreign to me, I reach out to my network for experts to work on our models with us.
Having a template library on hand cuts a first build from hours to minutes.
Need help finding your model? You’ll find me in the Finamodel app!
Other Marketplace Startup Financial Models
Browse another startup in the same category.

Acquco
Amazon brand aggregator - acquires third-party Amazon seller businesses at attractive multiples, then scales them via proprietary growth playbooks and technology.
Arive
Premium q-commerce app delivering lifestyle and branded products in under 30 minutes across German cities.

Audience Town
Vertical data and advertising platform targeting home movers across the entire home journey - pre-move through post-move.

AudioMob
Non-intrusive in-game audio ad platform bridging music/brand advertisers to mobile game publishers.

Authoritive
Two-way messaging platform that turns creator expertise into scalable, push-delivered learning experiences via SMS/WhatsApp.

Avo
Building amenity and office perk platform delivering same-day grocery/pantry/goods to residential and commercial tenants via a white-label marketplace.
beehiiv
Newsletter platform for creators to build, grow, and monetize email audiences - SaaS subscription + native ad network revenue.
Borzo
Global same-day logistics marketplace connecting B2B merchants with crowdsourced couriers for last-mile delivery


