 TBH Skincare Financial Model
Media/Gaming Startup Financials (Free Excel Download)
Australian DTC acne skincare brand using patented biofilm-breaking technology, selling via own Shopify store



professionals from Deloitte
Used by professionals from






About this model
TBH Skincare is an Australian direct-to-consumer acne brand built around patented biofilm-disrupting technology licensed from Next Science. Its core acne hack cream sells for $55, alongside $30 cleansers and a $42 SPF product; bundles increase basket size and repeat purchasing potential.
At the offer date, sales came solely through the Shopify site, with wholesale discussions underway but not live. The business pays licensing royalties for the formulation and uses local manufacturing, overseas packaging, and a planned 3PL transition. Retail, male customers, and international markets are expansion levers, not current revenue.
Since launching in March 2020, TBH had received more than 10,000 orders from 6,800-plus customers in 31 countries and over $750,000 of net revenue. Repeat purchasing, a 40-day reorder interval, 4.17% site conversion, $140-plus CLV, and $56.11 blended CPA should drive the model alongside COGS, inventory, marketing, and cash burn.
A turnkey financial model
Live formulas, no hardcoded values
Outputs are driven by live formulas, so the workbook updates from its assumptions instead of relying on hardcoded results.
All assumptions in one tab
Inputs are clearly marked in the Assumptions tab and separated from calculations, making it clear what to change and what to leave intact.
Statements always balancing
For integrated-statement models, the balance sheet, cash flow, and supporting schedules tie through properly.
Distinct schedules for clarity
Debt, working capital, taxes, and cash flow can get messy quickly. We group calculations in clear schedules, not across disconnected tabs.
No hidden macros or external links
There are no unexplained external workbook links or macros to undermine auditability or portability.
Changes flow through the model
Update a key driver and see the impact carry through the forecast, financing, and return outputs. We never use hardcoded numbers in formulas.
About TBH Skincare
tbhskincare.com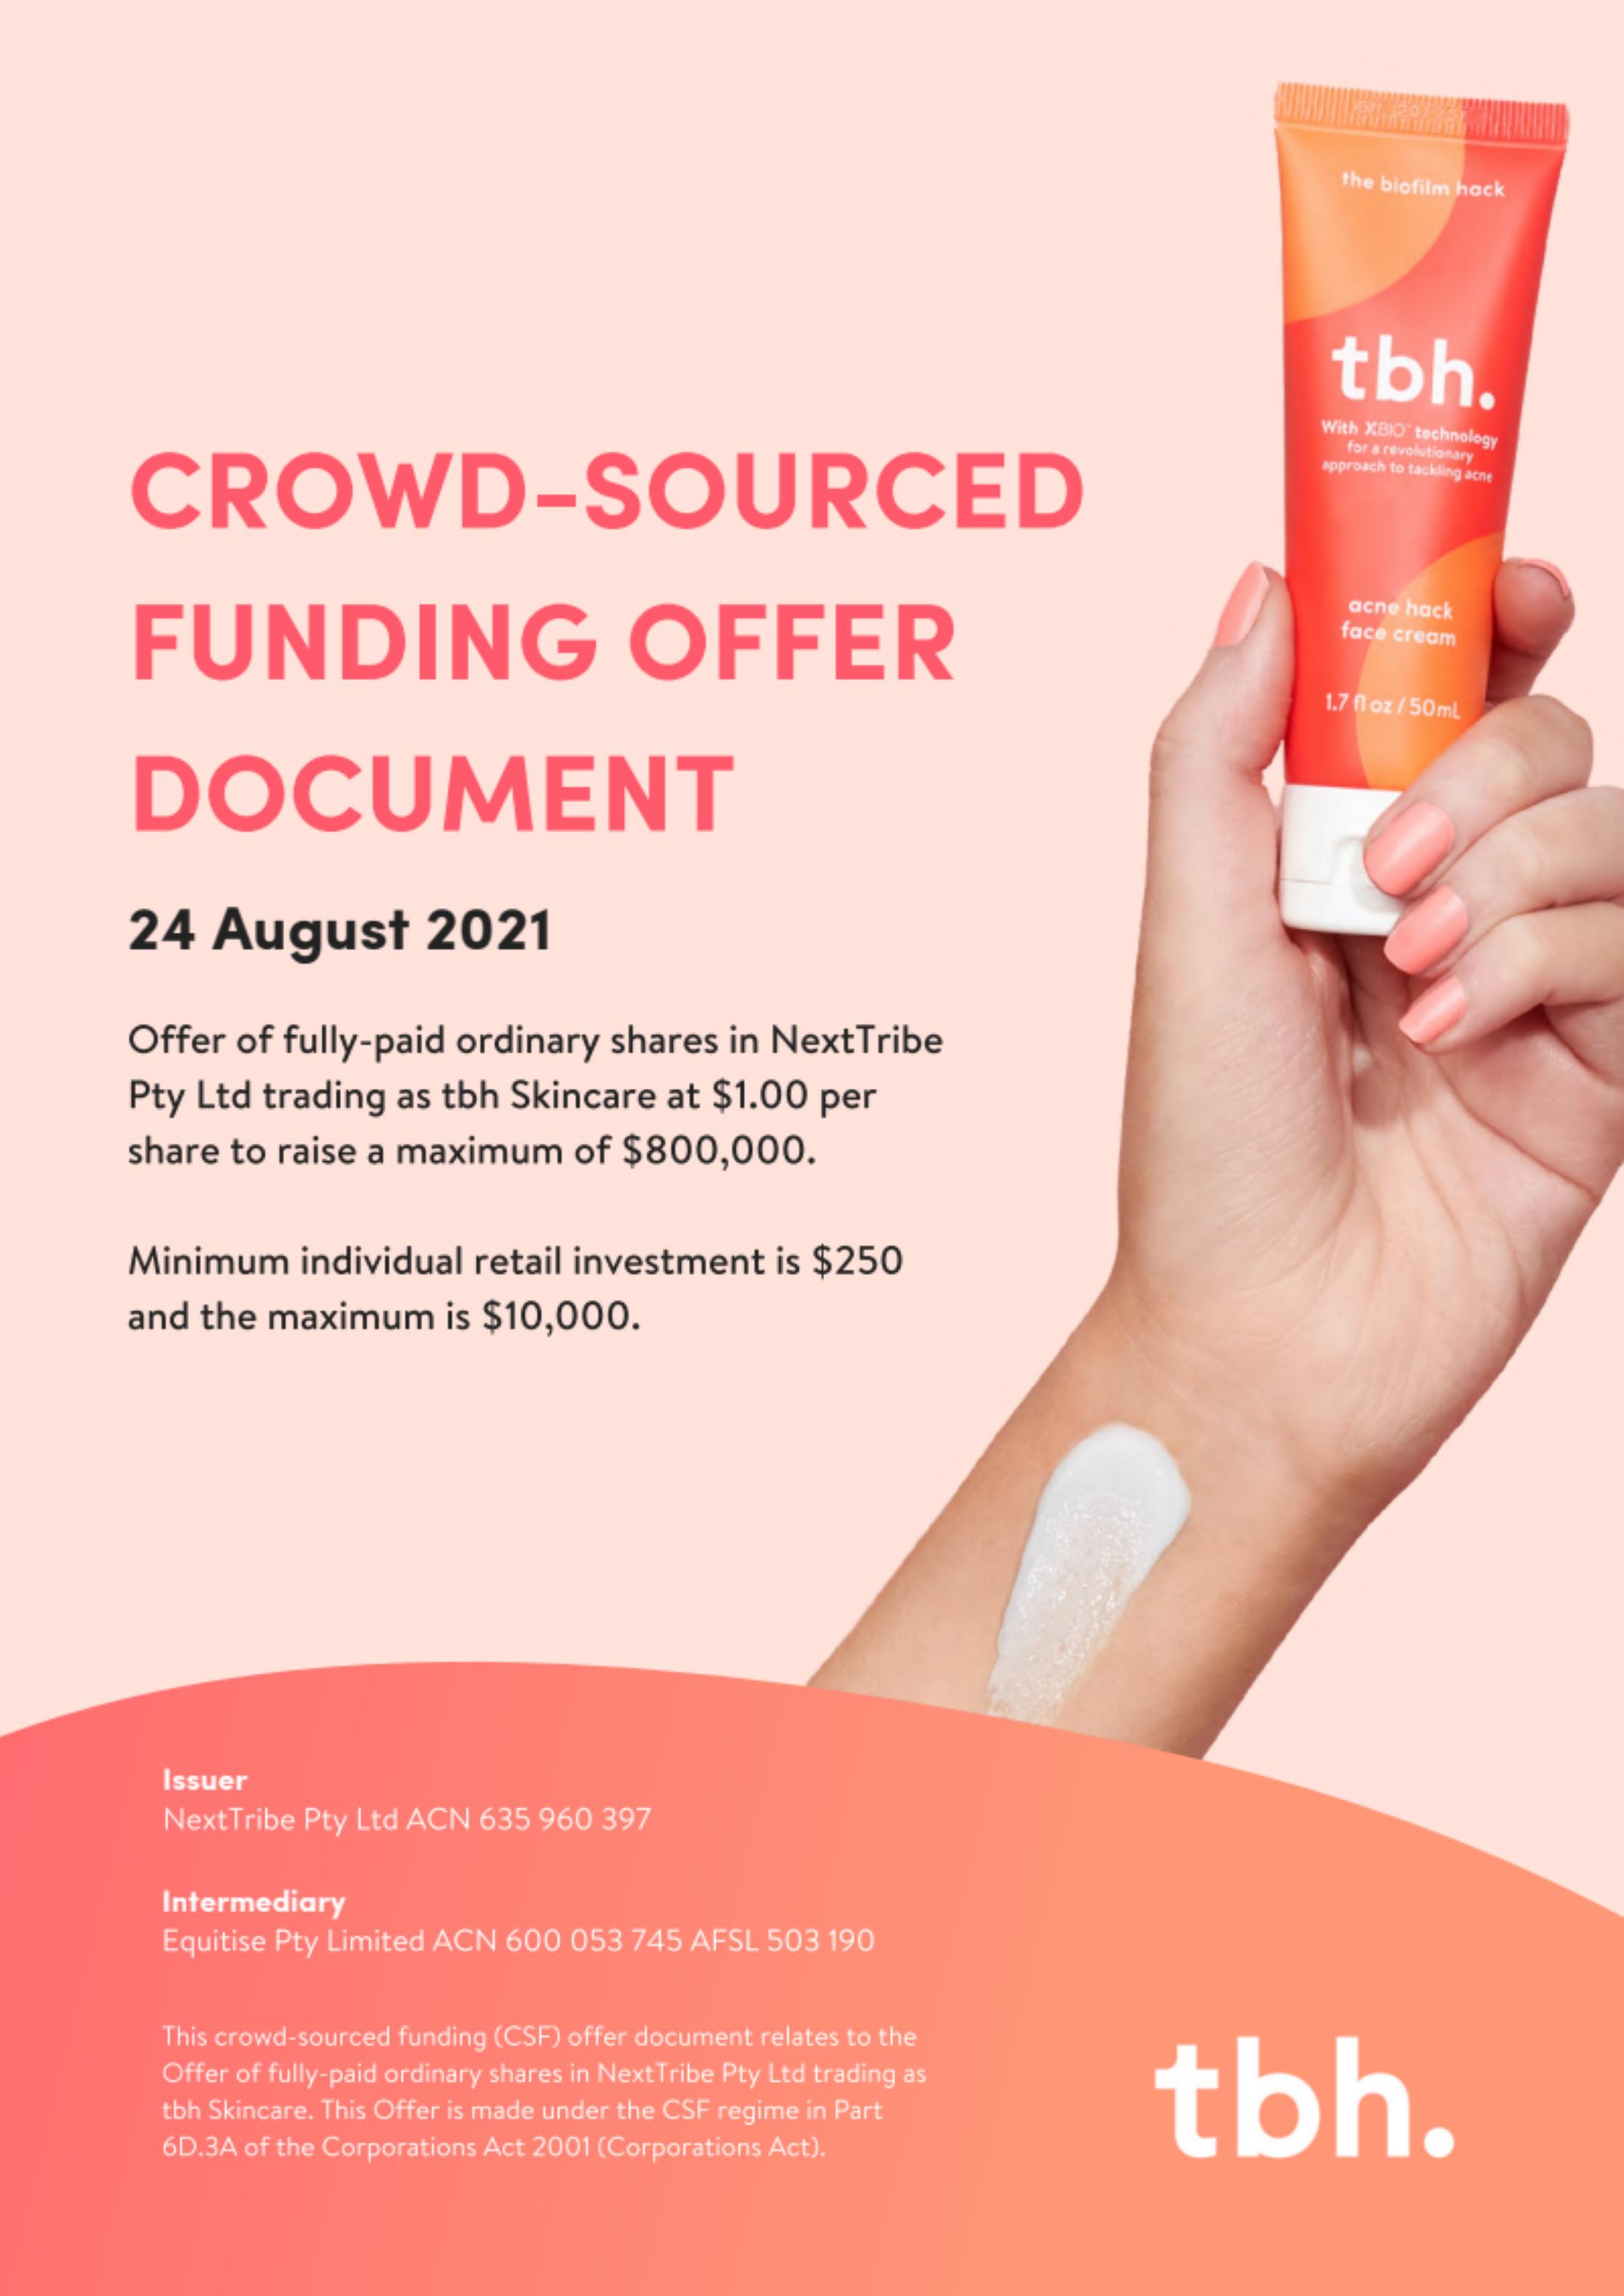
How to build a detailed financial model for TBH Skincare
A complete walkthrough of the business, drivers, and assumptions behind the downloadable TBH Skincare model - distilled from its pitch deck and publicly available information.
Product & value proposition
- Core product: "acne hack cream" ($55.00 RRP / 50mL) - patented biofilm-disrupting technology licensed from ASX-listed Next Science (NXS)
- Secondary products: anti-bacterial cleanser ($30.00 / 125mL), gentle cleanser ($30.00 / 125mL), skin shady SPF50+ ($42.00 / 100mL)
- Bundles offered as upsell / routine sets
- IP: Two products use patented Next Science XBC formulation; tbh holds exclusive licence for AU/NZ and online globally
- Moat: pharmaceutical-grade efficacy (biofilm disruption; in-vitro data from Montana State University showing ~7x log reduction vs market leaders) combined with consumer-brand voice and community
- Brand name double meaning: "the biofilm hack" (science) + "to be honest" (customer voice)
Market
- Global anti-acne cosmetics market: US$2.3bn in 2020; forecast CAGR 9.1% through 2028
- ~85% of people aged 12–24 experience acne; occurs at some point in 90%+ of world population
- tbh's initial addressable AU market estimated at 2.5m people
- Australia: beauty industry $6bn; only ~11% online penetration vs UK's 28% - cited as growth tailwind
- Australia "dermocosmetics" segment was the only beauty segment with positive growth (+2%) during COVID 2020
- M&A comps shown (slide 37): Paula's Choice acquired by Unilever at EV $2,000m (9.1x LFY / 6.7x FY+1); Frank Body at EV $100m (3.0x / 1.5x); tbh self-valued at EV $4m (5.7x LFY / 2.0x FY+1)
Revenue model
- Sole revenue channel at time of offer: DTC via tbhskincare.com (Shopify)
- Wholesale / retail discussions underway with major AU retailers but not yet live
- Product pricing (RRP): acne hack cream $55, anti-bacterial cleanser $30, gentle cleanser $30, SPF50+ $42
- Bundles offered for multi-product routines at a discount to drive basket size
- No subscription / replenishment mechanic explicitly described; repeat purchase driven by product efficacy and community
- Licensing royalty is an input cost (outflow), not a revenue line - tbh pays Next Science for IP use
- Expansion revenue levers: retail channel entry, male market, international (UK/EU, USA)
- Manufacturing: local AU manufacturer (TGA-accredited); some overseas packaging
- Logistics: moving to 3PL
Traction & metrics
| Metric | Value | Slide |
|---|---|---|
| Cumulative orders (launch Mar-20 to ~Aug-21) | 10,000+ | 9 |
| Unique customers | 6,800+ | 9 |
| Countries shipping to | 31 | 9 |
| Net revenue (FY20 + FY21 cumulative to offer date) | "over $750K" | 9 |
| FY22 sales run-rate target | $1.3M (stretch: $1.9M) | 9 |
| $500K cumulative sales milestone | Reached Dec 2020 | 20 |
| 5,000 customers milestone | Reached Feb 2021 | 20 |
| Instagram followers (June 2021) | 17K | 20 |
| Social media followers (total) | 20,000+ | 9 |
| Social following by gender | 98.1% female | 34 |
| Avg new customers/month (FY21 actuals) | 424/month | 25 |
| Avg new customers/month target (FY22) | 673/month | 25 |
| Repeat purchase rate | 30% purchase >2x; 15% purchase 3+ times | 25 |
| Days between orders (avg) | 40 days | 9 |
| Site add-to-cart rate | 8.8% of visitors | 31 |
| Checkout initiation (of add-to-cart) | 77.8% | 31 |
| Purchase follow-through (of checkout initiated) | 61.0% | 31 |
| Overall conversion rate | 4.17% (2%+ above industry) | 31 |
| CLV (cohorts with 12+ months lifetime) | $140+ | 25 |
| CPA (blended across all marketing) | $56.11 | 25 |
| FY22 CPA goal | $52.00 | 25 |
| Marketing as % of revenue (FY21) | 34% | 25 |
Historical P&L (slide 48):
| AUD | FY20 (Mar–Jun 2020) | FY21 |
|---|---|---|
| Total Sales | 81,417 | 644,812 |
| Cost of Sales | 33,225 | 316,311 |
| Gross Profit | 48,192 | 328,501 |
| Gross Margin % | 59.2% | 51.0% |
| Marketing & Advertising | 108,410 | 316,131 |
| Wages, Salaries & Contractors | 86,710 | 197,490 |
| Reg. & Subscription Fees | 9,958 | 41,378 |
| Bank & Merchant Fees | 4,884 | 29,712 |
| Professional Service Fees | 3,025 | 19,320 |
| Other Expenses | 16,403 | 38,706 |
| Total Expenses | 229,390 | 642,737 |
| Net Profit (Loss) | (181,198) | (314,236) |
Balance sheet highlights (slide 49, Jun-21):
- Cash: $5,100 (Jun-21) vs $17,571 (Jun-20)
- Inventory: $131,645 (Jun-21)
- Total Assets: $177,982
- Bank overdraft (liability): $67,616
- Director loans (non-current): $174,872
- Total Equity: ($184,436) - net liabilities position
- Accumulated losses: ($495,434)
Cash flow (slide 50):
- Operating cash outflow FY21: ($248,196)
- Financing inflows FY21: $255,872 ($51K equity + $174,872 director loans)
- Net cash at year-end FY21: ($62,515) - reflects overdraft position
Unit economics
- CPA (blended): $56.11 across all marketing (FB ads, Google, influencer, PR, agency fees)
- FY22 CPA target: $52.00
- CLV: $140+ (cohorts with 12+ months lifetime)
- Net GP per customer: $16.69 on average (CLV $140 x ~52% gross margin less merchant fees / shipping = "Net GP at 52% on average")
- Note: slide 25 defines "Net GP" as gross profit minus cost of product, merchant fees, and shipping - effectively contribution margin
- Gross margin: 59.2% FY20, 51.0% FY21
- Payback period: Not explicitly stated; implied ~8–12 months given CPA $56 vs net GP per customer ~$16–17 on first order
- Marketing as % of revenue: 49% FY21 (316K on 645K sales); deck cites 34% as spend relative to some base
Competition / moat
- Market split: large pharma incumbents (strong science, weak brand) vs digitally native brands (strong brand, weak science)
- tbh positions at intersection: patented science + modern consumer brand
- Key named competitors not disclosed in deck - anonymised as Brand 1–12
- Competitive advantages:
- Patented Next Science XBC biofilm-disrupting technology (in-vitro data vs salicylic acid and benzoyl peroxide competitors)
- Exclusive AU/NZ + online global distribution licence
- Community/brand: 20K+ followers, Abbie Chatfield (reality TV) ambassador, extensive earned media (Body & Soul, SMH, Buzzfeed, Broadsheet, PopSugar, Daily Mail)
- Customer experience: TGA-accredited formulation + Shopify custom build with GRIN influencer stack
- Loyal cohort: 30% repeat rate, 40-day reorder cycle, 5-star reviews
Team & funding ask / use of funds
Team:
- Bridget Mitchell - Co-Founder & Managing Director; 25+ years finance/consulting; handles finance, ops, legal, product development
- Rachael Tyers - Co-Founder, Head of Marketing; medtech marketing / digital / branding background
- Taylor Bradford - Brand Specialist (contractor, joined 2021)
- Ad buyer contractor (joined April 2021)
- Advisors: Gary Mitchell (30 yrs medical devices/MD Synthes/VP J&J); Jessy Marshall (business advisor)
Shareholders:
- Gary & Bridget Mitchell Trust: 35.7%
- Bridget Mitchell: 26.2%
- Rachael Tyers: 21.9%
Funding history (pre-offer):
- Oct 2019: $134,211 initial investors
- Dec 2019: $35,790 family investors
- Feb–Jun 2020: $90,000 family & friends
- Jun 2021: $51,000 director share issue
- Nov 2020–Jun 2021: $152,000 director loans (interest-free)
- Total equity raised pre-offer: ~$311,000
This offer:
- Issuer: NextTribe Pty Ltd (holding company of tbh Skincare Pty Ltd)
- Price: $1.00/share; 4M existing shares + up to 800K new = 4.9M fully diluted
- Raise: $300,000 minimum / $800,000 maximum
- Implied pre-money valuation at offer price: $4M (4M shares x $1.00)
- Co-founder salary: $80,000 each (funded from operations)
Use of funds (maximum $800K):
| Category | Min ($300K) | Max ($800K) |
|---|---|---|
| Product Pipeline | $45,000 | $100,000 |
| Sales and marketing | $95,000 | $240,000 |
| Operating costs | $90,000 | $172,000 |
| Staff | $0 | $80,000 |
| Working capital | $50,000 | $160,000 |
| Offer costs | $20,000 | $48,000 |
| Total | $300,000 | $800,000 |
Recommended financial model
Archetype + why: DTC Consumer P&L (inventory + marketing spend) with cohort-based revenue build. tbh is a single-channel Shopify DTC brand with identifiable unit economics (CPA, CLV, repeat rate, reorder cadence), a known product mix, and clear gross margin structure. The right model is a customer cohort waterfall feeding a monthly P&L with COGS, marketing, and opex - not a SaaS ARR or marketplace GMV model. A simple 3-statement model (IS, BS, CF) should underpin the forecast given the company has auditable historicals.
Forecast horizon & granularity:
- Monthly for FY22 (Jul 2021 – Jun 2022) - captures post-raise ramp
- Quarterly for FY23 - aligns with company's own base/stretch forecast horizon
- FY21 actuals as anchor; FY22 and FY23 forecasts provided in deck (use as base case)
Key drivers & assumptions:
| Driver | Value | Source |
|---|---|---|
| FY21 revenue | $644,812 | - |
| FY21 gross margin | 51.0% | - |
| FY22 base revenue | $1,372,253 | - |
| FY22 base net profit | ($122,852) | - |
| FY23 base revenue | $2,636,315 | - |
| FY23 base net profit | $63,123 | - |
| FY22 stretch revenue | $1,886,983 | - |
| FY23 stretch revenue | $7,466,017 | - |
| New customers/month (FY21 avg) | 424 | - |
| New customers/month target (FY22) | 673 | - |
| CPA (blended, FY21) | $56.11 | - |
| CPA target (FY22) | $52.00 | - |
| Repeat rate (30-day+ cohort) | 30% purchase >2x | - |
| Avg days between orders | 40 days | - |
| CLV (12+ month cohorts) | $140+ | - |
| Gross margin going forward | 51–55% | : FY21 was 51%; FY20 was 59% (launch mix); likely stabilises 52–54% at scale as COGS normalise with 3PL and volume |
| Marketing as % of revenue | 34–40% in FY22 declining to 28–32% in FY23 | : FY21 was 49%; deck targets 34%; efficiency expected to improve with CPA reduction and growing organic base |
| Wages & contractors growth | +30% YOY | : headcount additions (ad buyer, brand specialist) already on payroll by Aug-21; retail channel and intl will require 1–2 more FTEs in FY23 |
| Average order value (AOV) | ~$70–80 | : no explicit AOV stated; derived from customer count 6,800 and revenue $750K cumulative → ~$110 per customer lifetime to Aug-21; with 30% repeaters and 40-day reorder, first-order AOV estimated ~$60–75; bundles push higher |
| SKU count | 4 active + 2 new in FY22 (base) / 3 additional (stretch) | - |
| Inventory days | 120–150 days | : Jun-21 inventory $131K vs FY21 CoS $316K → ~150 days; reduce to 120 days with 3PL in FY22 |
| Capex | Minimal (<$10K/year) | : asset-light D2C; FY21 capex was $9,025; no physical retail |
| Tax | Not modelled for FY22 (loss-making) | : losses carried forward; first taxable year FY23 base case; Australian corp tax rate 25% for small business |
| Director loans repayment | Ongoing from operations over extended period | - |
| CSF raise proceeds (model at max) | $800,000 | ; model sensitivity at $300K minimum also |
Scenarios (Base / Bull / Bear):
| Variable | Bear | Base | Bull |
|---|---|---|---|
| Monthly new customer growth | 450/mo, CPA stays $56 | 673/mo, CPA $52 | 900/mo, CPA $48 (increased paid spend) |
| Gross margin | 49% (CoS pressure, intl shipping) | 52% | 55% (volume + bundle mix) |
| Repeat rate | 25% | 30% | 40% |
| Retail channel launch | Not in FY22/23 | Not in model scope | Contributing 10% of revenue by FY23 |
| FY22 raise | $300K (minimum) | $800K (maximum) | $800K + bridge |
| International expansion | Deferred beyond FY23 | Limited online FY23 | UK/US launch FY23 |
Required sheets / outputs:
- Assumptions - all input dials; colour-coded inputs vs formulas
- Cohort Model - monthly new customer additions, repeat cohort waterfall, total active customers
- Revenue Build - units by SKU, AOV, total revenue; bundle vs single-product split
- P&L - monthly (FY22) + quarterly (FY23); mirrors deck structure (Sales, CoS, GP, Marketing, Wages, Subscriptions, Merchant fees, Prof fees, Other, Net Profit)
- Balance Sheet - simplified (cash, inventory, receivables, payables, equity, director loans)
- Cash Flow - operating, investing, financing; cash runway vs raise scenarios
- Unit Economics - CPA, LTV, payback, LTV/CAC ratio; auto-updates from cohort model
- Scenario Toggle - Base / Bull / Bear switch on single assumptions sheet
- Dashboard - KPI summary: revenue, GP%, marketing efficiency, customer count, cash runway
Frequently asked
Is the TBH Skincare financial model free?+
Yes. The TBH Skincare model is a free Excel (.xlsx) download with live formulas. Sign up with your email and the workbook is yours to keep, review, and edit.
What's included in the model?+
A 5-year monthly forecast with P&L, cash flow and runway, valuation (exit multiple plus a DCF cross-check), MOIC/IRR returns, and unit economics, with live formulas throughout.
How was this model built?+
It was built from TBH Skincare's pitch deck and publicly available information, then structured to investment-banking standards as a fully editable Excel model.
Can I change the assumptions?+
Yes. You can change assumptions and the live formulas will recalculate in the downloadable Excel model.
Have more financial modelling questions? Contact us

Created by ex-finance professionals
Hey, I’m Alex and I created Finamodel.
Over my years in the finance industry I kept building the same models over and over again. Same structure, same assumptions, different logo. So I started building frameworks to turn them into clean, reusable templates.
Every model here is one I’d actually use for a client, and I personally vet each one before it goes up.
I’m not an expert in every industry, but I’ve built enough models to know what belongs in one. And when something is completely foreign to me, I reach out to my network for experts to work on our models with us.
Having a template library on hand cuts a first build from hours to minutes.
Need help finding your model? You’ll find me in the Finamodel app!
Other Media/Gaming Startup Financial Models
Browse another startup in the same category.

Almost Friday
Almost Friday is a multi-platform comedy/lifestyle media brand built around the "Friday Beers" universe, monetising through apparel, brand partnerships, events, podcasts, and music.

Amagi
Cloud-native SaaS platform for TV/OTT channel creation, distribution, and ad monetization (FAST-focused)

Audoo
IoT + SaaS platform that captures real-time public music performance data and reports it to Performing Rights Organisations (PROs) to enable accurate royalty distribution.
Backbone
Backbone makes a mobile gaming controller (hardware) + unified software platform (Backbone app) that aggregates all game streaming services in one place.
Beacon Pines
Beacon Pines is a cute-and-creepy narrative adventure game set inside a magical storybook, developed by indie studio Hiding Spot Games.
Bear and Breakfast
A management/adventure video game where you play as a bear running a B&B cabin in the woods.
Bioshock
BioShock is a first-person action horror game pitched to a publisher for development funding - a game-development studio deal, not an operating startup.

Button City 2018
Indie narrative adventure game about cute animal kids saving their local arcade, targeting console and PC.


