TITwitter IPO Pitch Deck Financial Model
Marketplace Startup Financials (Free Excel Download)
Twitter is a real-time public social network enabling users to create, distribute, and discover short-form content globally.



professionals from Deloitte
Used by professionals from






About this model
Twitter's IPO model describes a real-time public communication network built around short messages, live events, platform partners, and advertisers. Users generate and distribute content, while brands use promoted tweets, accounts, and trends to reach audiences across mobile and desktop.
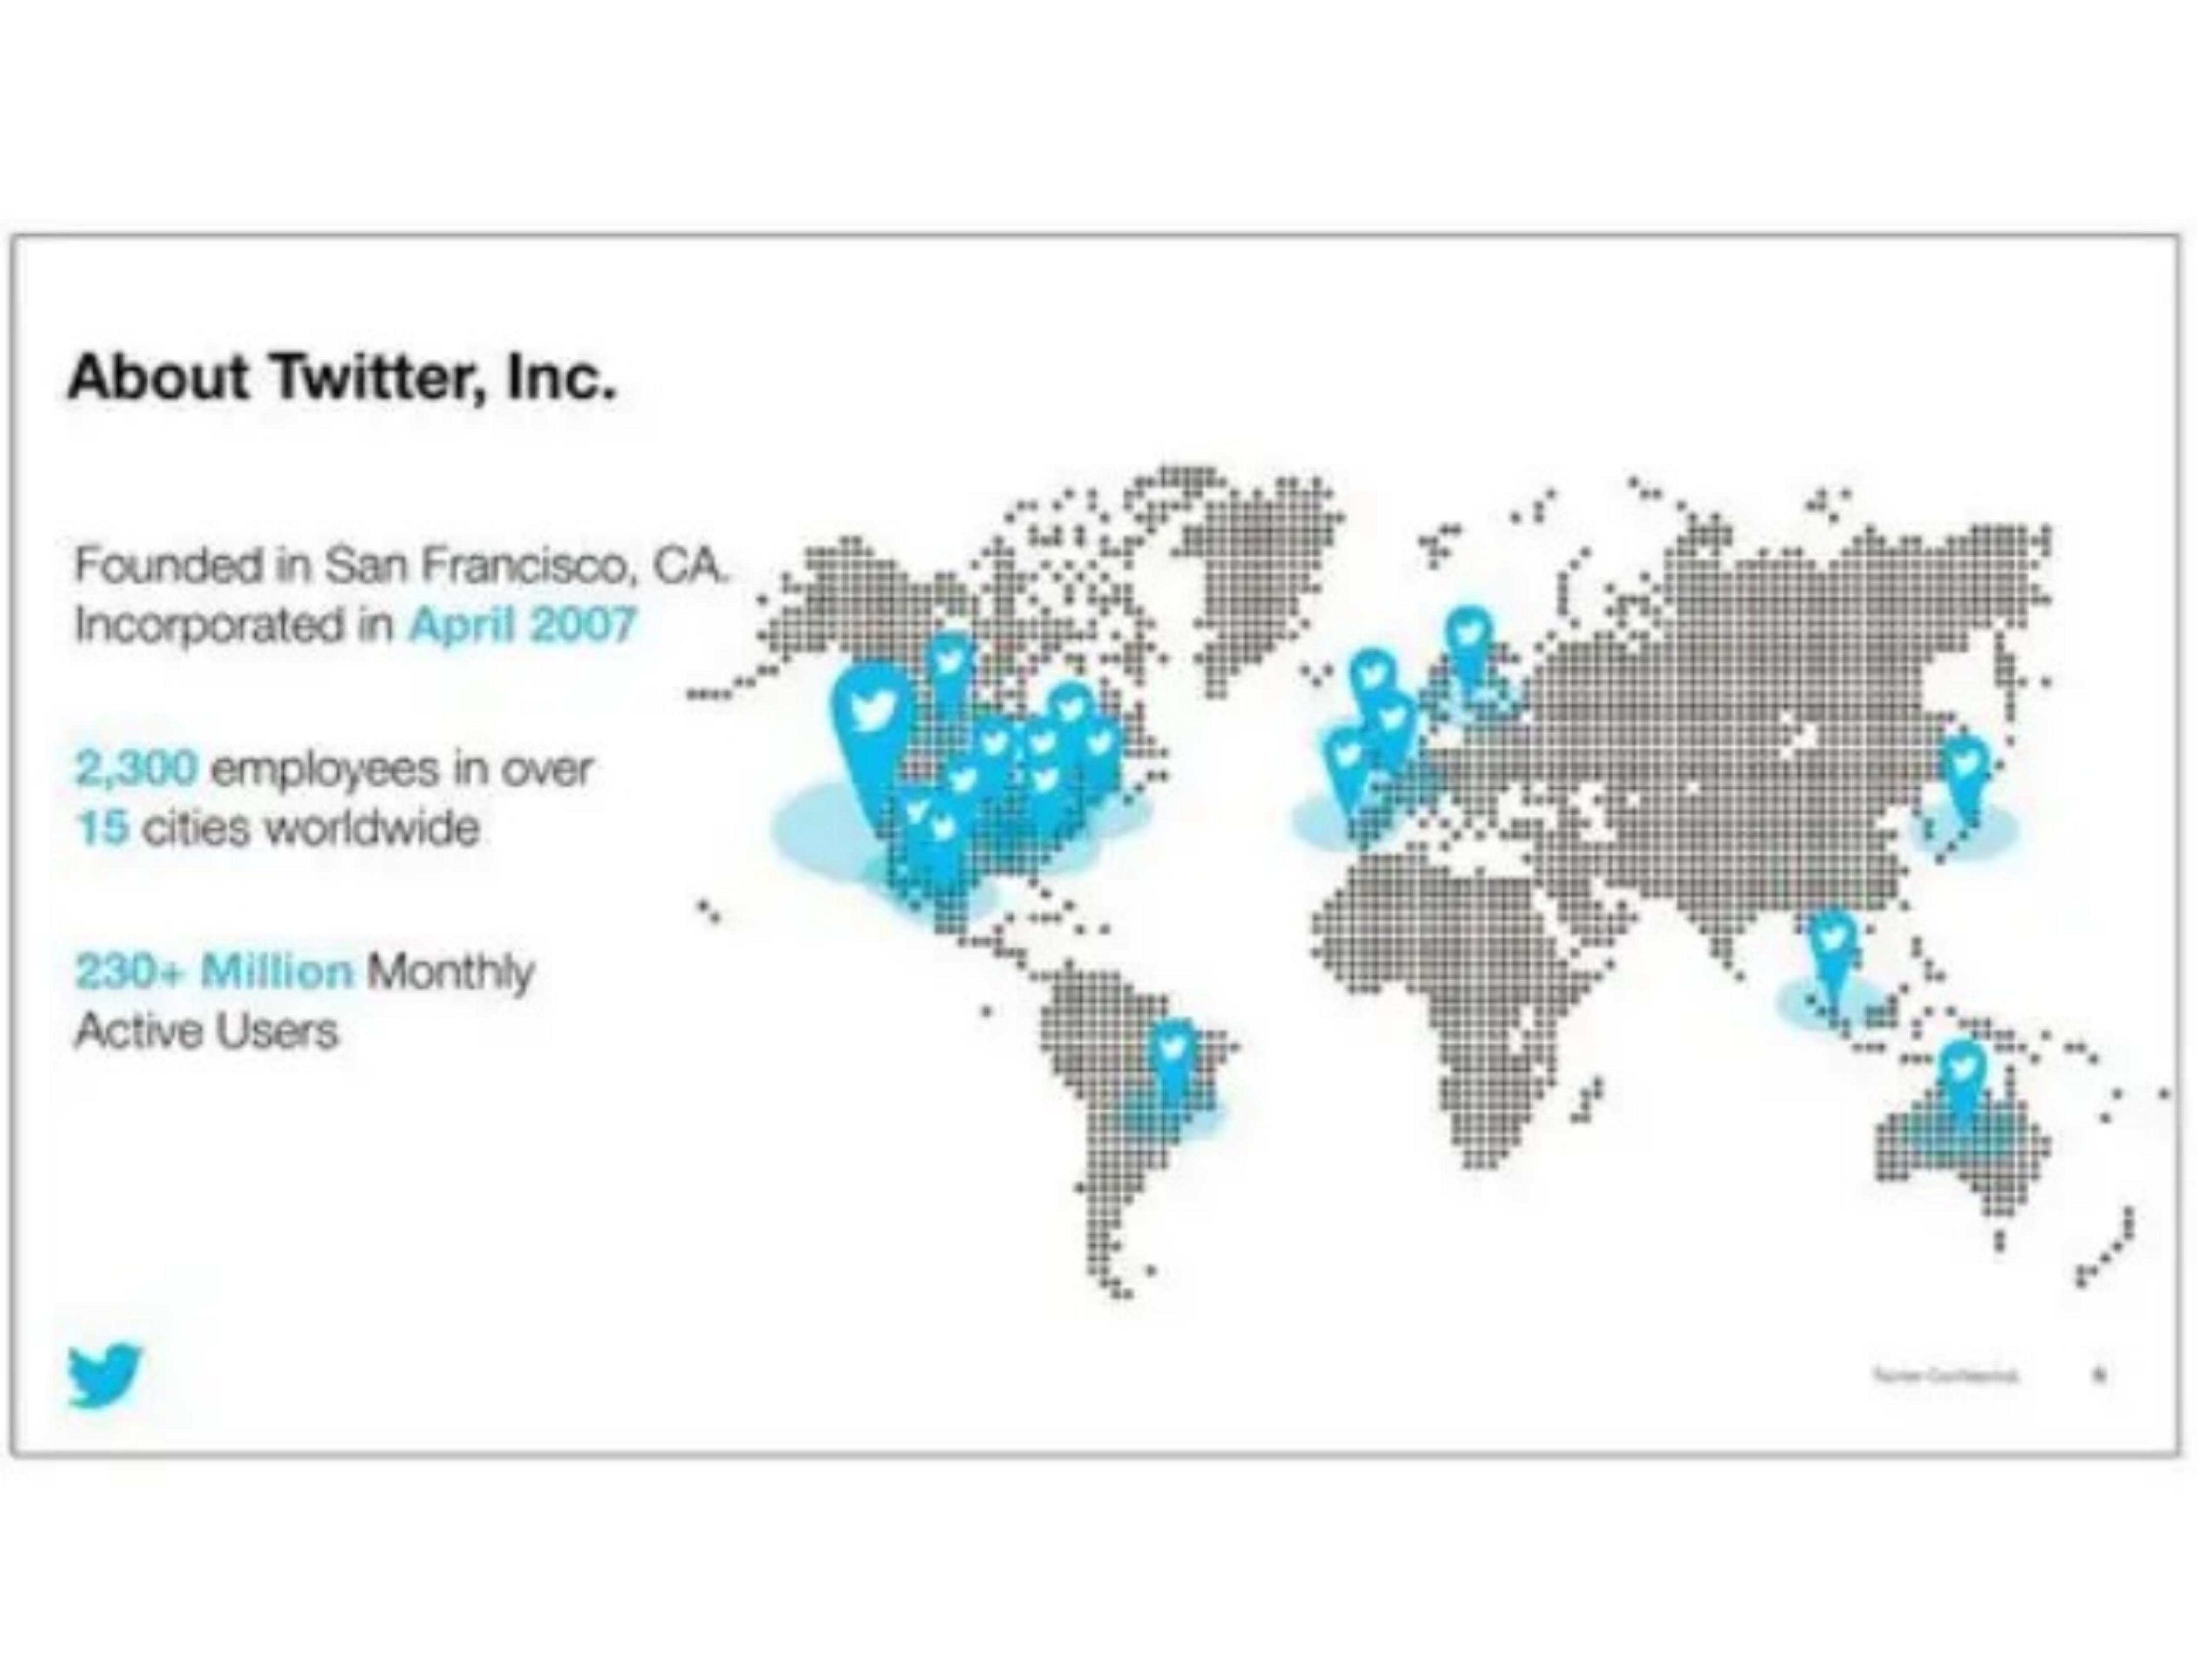
At the time of the IPO deck, Twitter had more than 230 million monthly active users and generated roughly 85% of revenue from advertising, with data licensing providing the balance. Management measured the advertising engine through monthly users, timeline views per user, and ad revenue per thousand timeline views.
The model is a public-company advertising platform forecast. MAUs, engagement, timeline views, ad load, fill rate, and RPM build advertising revenue, while data licensing is modeled separately. Mobile mix, international growth, sales capacity, infrastructure, and content-safety costs determine margin and cash generation.
A turnkey financial model
Live formulas, no hardcoded values
Outputs are driven by live formulas, so the workbook updates from its assumptions instead of relying on hardcoded results.
All assumptions in one tab
Inputs are clearly marked in the Assumptions tab and separated from calculations, making it clear what to change and what to leave intact.
Statements always balancing
For integrated-statement models, the balance sheet, cash flow, and supporting schedules tie through properly.
Distinct schedules for clarity
Debt, working capital, taxes, and cash flow can get messy quickly. We group calculations in clear schedules, not across disconnected tabs.
No hidden macros or external links
There are no unexplained external workbook links or macros to undermine auditability or portability.
Changes flow through the model
Update a key driver and see the impact carry through the forecast, financing, and return outputs. We never use hardcoded numbers in formulas.
About Twitter IPO Pitch Deck
How to build a detailed financial model for Twitter IPO Pitch Deck
A complete walkthrough of the business, drivers, and assumptions behind the downloadable Twitter IPO Pitch Deck model - distilled from its pitch deck and publicly available information.
Product & value proposition
- 140-character constraint makes Twitter uniquely "live" and high-velocity.
- Four product pillars: Public (personal broadcast network), Real-time (live eyewitness content), Conversational (user-to-user and brand-to-user), Distributed (tweets syndicated across third-party properties).
- Three stakeholder constituencies: Users, Platform Partners, Advertisers.
- Platform partners get distribution into Twitter and embed Twitter content on their own properties (TV integrations, websites, apps). TV x Twitter is a featured product: 60% of primetime TV shows included a Twitter hashtag/handle as of June 2013.
- Advertising products: Promoted Tweets, Promoted Accounts, Promoted Trends - all pay-for-performance and native to the feed.
- MoPub acquisition cited as enabling real-time bidding.
- Interest graph (follow graph) drives targeting: keywords, interests, TV ads, device, followers, look-alikes, search, location, gender.
Market
- Total smartphone users projected 3.7B by 2017.
- Total internet users projected 3.5B by 2017 vs. 2.4B in 2012.
- Twitter MAU at time of deck: 232M - implies ~6–7% penetration of 2012 internet users, and ~6% of projected 2017 smartphone base. Deck frames this as large whitespace.
- No explicit TAM/SAM dollar figure stated for the advertising market.
Revenue model
- Advertising (~85% of revenue): Promoted Tweets, Promoted Accounts, Promoted Trends. Pay-for-performance model (CPE / cost-per-engagement). Sold via direct sales (brand advertisers) and self-serve (SMB). International advertising expansion is a named growth vector.
- Data licensing (~15% of revenue): Licensing the Twitter firehose and derivative data products to third parties.
- Core monetization metric: Ad Revenue per 1,000 Timeline Views (RPM analog). Worldwide $0.97 Q3 2013.
- 71% of advertising revenue generated from mobile devices.
Traction & metrics
Users
- 230+ million MAUs (as of Sept 2013)
- 77% average MAUs international
- 76% average MAUs access Twitter on mobile
- MAU growth: 167M Q3 2012 → 232M Q3 2013, +39% Y/Y worldwide
- U.S.: 40M → 53M, +30% Y/Y
- International: 127M → 179M, +41% Y/Y
Engagement
- 685 timeline views per MAU, Q3 2013 (up from 635 in Q3 2012, +8% Y/Y)
- Timeline views: 106B Q3 2012 → 159B Q3 2013, +50% Y/Y
- U.S.: 33B → 43B; International: 74B → 116B
- 350B tweets published since founding
- 1B tweets created every two days
- 48B online impressions of tweets off Twitter's own properties
- 44% of Americans hear about tweets through other media channels almost every day (Edison Research)
Revenue
- Annual revenue: $28M (2010), $106M (2011, +276% Y/Y), $317M (2012, +199% Y/Y)
- 2010: Advertising $7M, Data Licensing $21M
- 2011: Advertising $78M, Data Licensing $29M
- 2012: Advertising $269M, Data Licensing $48M
- 9-month revenue (Jan–Sept): $205M (2012) → $422M (2013), +106% Y/Y
- 2012 9M: Advertising $170M, Data Licensing $35M
- 2013 9M: Advertising $375M, Data Licensing $47M
- Advertising revenue growth: 9M 2012 $170M → 9M 2013 $375M, +121% Y/Y
Monetization efficiency
- Ad Revenue / 1,000 Timeline Views, Q3 2013:
- Worldwide: $0.65 (Q3'12) → $0.97 (Q3'13), +49% Y/Y
- U.S.: $1.72 (Q3'12) → $2.58 (Q3'13), +50% Y/Y
- International: $0.17 (Q3'12) → $0.36 (Q3'13), +112% Y/Y
Unit economics
Margins (Non-GAAP, % of revenue)
| Line item | Annual 2012 | 9M Sept-2013 | Target Model |
|---|---|---|---|
| Cost of Revenue | 34% | 33% | 21%–23% |
| R&D | 34% | 35% | 19%–21% |
| S&M | 27% | 30% | 20%–22% |
| G&A | 15% | 11% | 10% |
| D&A | 17% | 16% | 10% |
| Adj. EBITDA Margin | 7% | 7% | 35%–40% |
Adjusted EBITDA (Non-GAAP, in millions)
- Quarterly: -$1 (1Q'12), $2 (2Q'12), $3 (3Q'12), $18 (4Q'12), $12 (1Q'13), $10 (2Q'13), $9 (3Q'13)
- 9-month: $4M (2012, 1.8% margin) → $31M (2013, 7.3% margin)
GAAP Net Loss (9 months):
- 2012: -$70.7M; 2013: -$133.9M (loss widening due to stock-based comp and D&A)
OpEx (Non-GAAP, 9M): $161M (2012) → $320M (2013), +99% Y/Y CapEx (9M): $120M (2012) → $142M (2013)
- 2012: PP&E cash $40M + capital leases $79M
- 2013: PP&E cash $47M + capital leases $96M
GAAP OpEx reconciliation (9M):
- GAAP Opex: $181M (2012) → $394M (2013); SBC: $20M → $74M
Competition / moat
- Moat framed as: the Interest Graph (unique follow-graph generating real-time targeting signal); the "live" nature of the platform (140-char constraint); embedded distribution through media partner ecosystem (TV x Twitter, Twitter for Websites, Twitter Cards).
- Competitive set: Not explicitly named. Deck positions Twitter as unique real-time public network; Facebook referenced implicitly via Super Bowl stat (Twitter in 50% of ads vs. Facebook in 8%).
- 35+ major media partnerships across broadcast, sports, music, print.
- Nielsen Twitter TV Ratings launched as new industry standard - creates measurement moat for TV advertising dollars.
Team & funding ask / use of funds
Management team:
- Dick Costolo, CEO (prev. Google, Feedburner)
- Ali Rowghani, COO (prev. Pixar, McKinsey)
- Mike Gupta, CFO (prev. Yahoo, Zynga, Merrill Lynch)
- Chris Fry, SVP Engineering (prev. Salesforce)
- Adam Bain, President Global Revenue (prev. News Corp)
- Vijaya Gadde, General Counsel (prev. WSGR, Juniper Networks)
IPO / Funding ask: This is an IPO roadshow deck. Specific share price, proceeds size, and use of funds are not stated in the slides provided.
Recommended financial model
- Archetype + why: Ad-platform operating model (analogous to social media/digital advertising P&L). Revenue decomposed as: MAU × Timeline Views/MAU × Ad Revenue/1,000 TLV + Data Licensing revenue. Twitter explicitly uses this MAU × TLV/MAU × RPM framework as its management KPI stack. A 3-statement model is appropriate given this is a public-company IPO with GAAP and Non-GAAP financials disclosed.
- Forecast horizon & granularity: Quarterly for Year 1 (FY2014) + annual FY2015–FY2016, stepping toward the target model margin structure. Historical base: FY2010–FY2012 annual + 9M 2013 actuals.
- Key drivers & assumptions:
*User growth*
- Worldwide MAU, Q3 2013 base: 232M
- MAU Y/Y growth rate: 39% in Q3 2013; expected to decelerate - model at ~30% FY2014, ~20% FY2015, ~15% FY2016 as penetration rises
- U.S. / International split: 53M / 179M as of Q3 2013; International growing faster (+41% Y/Y)
*Engagement*
- Timeline views/MAU: 685 in Q3 2013, growing 8% Y/Y; modest ~5–8% growth p.a. reflecting product maturity
- Total timeline views = MAU × TLV/MAU
*Monetization*
- Ad RPM (worldwide): $0.97 in Q3 2013; growing 49% Y/Y
- RPM growth decelerates: ~30% FY2014, ~20% FY2015, ~15% FY2016, driven by international mix shift (intl RPM much lower at $0.36) and product/targeting improvements
- U.S. RPM: $2.58 Q3 2013; International RPM: $0.36 Q3 2013 - model separately
- Data licensing revenue: $47M in 9M 2013; ~$65M FY2013, growing ~15–20% p.a. (slower/steadier than advertising)
- Mobile as % of ad revenue: 71%; stable/growing
*Costs (Non-GAAP % of revenue - target model from deck)*
- Cost of Revenue: 33% (current) → 21%–23% (target); linear step-down over 3 years
- R&D: 35% (current) → 19%–21% (target)
- S&M: 30% (current) → 20%–22% (target)
- G&A: 11% (current) → 10% (target)
- D&A: 16% (current) → 10% (target)
- Target Adj. EBITDA margin: 35%–40%
*CapEx*
- 9M 2013 CapEx: $142M ($47M PP&E cash + $96M capital leases)
- CapEx as % of revenue ~25–30% near term, declining as infrastructure scales
*SBC*
- 9M 2013 SBC: $79M; grows with headcount, use as % of revenue (declining from ~19% toward 10%)
*D&A*
- 9M 2013 D&A: $77.7M; drives from CapEx schedule
- Scenarios (Base / Bull / Bear - which variables flex):
- Base: MAU growth ~30% FY2014 declining to 15% by FY2016; RPM growth ~25–30%; cost ratios step toward midpoint of target model by FY2016.
- Bull: MAU growth sustains ~35% on international expansion; U.S. RPM approaches $4+ as TV/native ad formats scale; cost leverage achieved faster (EBITDA margin 30%+ by FY2016).
- Bear: MAU growth decelerates to ~20% by FY2014 (user engagement concerns); RPM growth stalls at ~15% (ad market competition); cost ratios sticky at current levels; EBITDA margin stays 7–10%.
- Primary flex variables: MAU growth, RPM (especially international), S&M spend efficiency, SBC dilution.
- Required sheets / outputs:
- Assumptions - all drivers with toggle for Base/Bull/Bear
- Revenue Build - MAU (US/Intl split) × TLV/MAU × RPM/US and RPM/Intl + Data Licensing
- P&L - GAAP and Non-GAAP income statement (advertising, data licensing, CoR, R&D, S&M, G&A, D&A, SBC, EBIT, Net Income/Loss)
- Adj. EBITDA Bridge - reconcile GAAP net loss to Adjusted EBITDA (matching deck format, slide 63)
- CapEx & Working Capital - PP&E, capital leases, D&A schedule
- Target Model Tracker - current vs. target margin comparison (matching slide 60 format)
- KPI Dashboard - MAU (US/Intl), TLV, TLV/MAU, RPM (worldwide/US/Intl), Ad Revenue, Data Licensing Revenue, Adj. EBITDA margin (matching slides 49–57 format)
- Sensitivity - MAU growth vs. RPM growth → Revenue and EBITDA margin grid
Frequently asked
Is the Twitter IPO Pitch Deck financial model free?+
Yes. The Twitter IPO Pitch Deck model is a free Excel (.xlsx) download with live formulas. Sign up with your email and the workbook is yours to keep, review, and edit.
What's included in the model?+
A 5-year monthly forecast with P&L, cash flow and runway, valuation (exit multiple plus a DCF cross-check), MOIC/IRR returns, and unit economics, with live formulas throughout.
How was this model built?+
It was built from Twitter IPO Pitch Deck's pitch deck and publicly available information, then structured to investment-banking standards as a fully editable Excel model.
Can I change the assumptions?+
Yes. You can change assumptions and the live formulas will recalculate in the downloadable Excel model.
Have more financial modelling questions? Contact us

Created by ex-finance professionals
Hey, I’m Alex and I created Finamodel.
Over my years in the finance industry I kept building the same models over and over again. Same structure, same assumptions, different logo. So I started building frameworks to turn them into clean, reusable templates.
Every model here is one I’d actually use for a client, and I personally vet each one before it goes up.
I’m not an expert in every industry, but I’ve built enough models to know what belongs in one. And when something is completely foreign to me, I reach out to my network for experts to work on our models with us.
Having a template library on hand cuts a first build from hours to minutes.
Need help finding your model? You’ll find me in the Finamodel app!
Other Marketplace Startup Financial Models
Browse another startup in the same category.

Acquco
Amazon brand aggregator - acquires third-party Amazon seller businesses at attractive multiples, then scales them via proprietary growth playbooks and technology.
Arive
Premium q-commerce app delivering lifestyle and branded products in under 30 minutes across German cities.

Audience Town
Vertical data and advertising platform targeting home movers across the entire home journey - pre-move through post-move.

AudioMob
Non-intrusive in-game audio ad platform bridging music/brand advertisers to mobile game publishers.

Authoritive
Two-way messaging platform that turns creator expertise into scalable, push-delivered learning experiences via SMS/WhatsApp.

Avo
Building amenity and office perk platform delivering same-day grocery/pantry/goods to residential and commercial tenants via a white-label marketplace.
beehiiv
Newsletter platform for creators to build, grow, and monetize email audiences - SaaS subscription + native ad network revenue.
Borzo
Global same-day logistics marketplace connecting B2B merchants with crowdsourced couriers for last-mile delivery


