Equity Research Initiation Model
Capital Markets Financial Model (Free Excel Download)
Initiate on a company whose fiscal year does not match its peers. Two of three segments are sized off an installed base of 96,000 instruments rather than off a growth rate, so a weak shipment quarter shows up two years later as a smaller field. The same sixteen quarters roll into September fiscal years and into December calendar years - CY27E adjusted EPS of $5.18 against FY27E of $4.97, a $0.21 gap an uncalendarised multiple gives away. A seven-column sequential substitution bridges consensus EPS of $4.73 to $4.97 through revenue at plus $0.39, margin at plus $0.32 and operating costs at minus $0.58. A discounted cash flow at $95.41, 19.0x earnings at $98.38 and 12.5x EBITDA at $105.28 blend to a $98.92 target, 17.1 per cent above an $84.50 reference price.



professionals from Deloitte






About this model
A sell-side initiation on a mid-cap analytical instruments maker with a September fiscal year end, built for four mechanics a generic valuation model does not carry. Two of the three segments are sized off an installed base rather than off a growth rate: only instruments are sold outright, and the field they build - 96,000 units at the start, 104,585 by the end of the window - is what consumables and software revenue are then driven from, so a weak instrument quarter does not show up as a weak reagent quarter, it shows up two years later as a smaller field. Seasonality is applied to instruments alone, indexed to four across the fiscal year, because capital budgets close in the September quarter and reagent consumption does not care what month it is. The software attach rate climbs into a hard 40 per cent ceiling that binds from the second quarter of FY29, because the oldest platforms in the field cannot be connected at all. The second mechanic is calendarisation. The same sixteen quarters are rolled into September fiscal years and, separately, into December calendar years - the same axis shifted one quarter forward - because the peer group reports on December. The fiscal year end lands on a clean quarter boundary, so the mapping is exact and two check rows prove it: one that the four fiscal windows account for all sixteen quarters, one that the three calendar windows are contiguous and non-overlapping. The row that matters is the gap: CY27E adjusted earnings of $5.18 against FY27E of $4.97, a $0.21 difference worth 4.3 per cent of the number, which is what an analyst gives away by applying a peer-derived December multiple to a September fiscal figure. Both multiples in the target price are struck on the calendar year for exactly that reason. The third mechanic is a consensus bridge built by sequential substitution rather than by attribution. A full FY27E profit and loss account is built seven times across seven columns, each swapping exactly one consensus input for ours in profit-and-loss order, so the change in earnings per share between two adjacent columns is that line and nothing else and the six effects sum to the total gap by construction. Consensus adjusted EPS of $4.73 bridges to $4.97 through revenue at plus $0.39, gross margin at plus $0.32, operating costs at minus $0.58, financing at plus $0.05, tax rate at plus $0.03 and share count at plus $0.03. That shape is the thesis and it is not the shape the plus 5.0 per cent headline implies: we are not above the street because we are more optimistic on demand, we carry 45 million more operating cost than consensus does and give back most of the revenue and margin benefit, and the call is that the mix shift into consumables and software is real while the street has under-modelled what it costs to deliver. Adjusted earnings are defined once, on the calendarisation sheet, which is why the bridge reconciles to zero without a plug. The fourth mechanic is the target price itself. A discounted cash flow at an 8.1 per cent cost of capital gives $95.41, a 19.0 times multiple on CY27E earnings gives $98.38 and a 12.5 times multiple on CY27E EBITDA gives $105.28, blended 40 / 35 / 25 to $98.92 against a reference price of $84.50 - 17.1 per cent upside, or 19.3 per cent including the dividend. The three methods land within 10 per cent of each other, which is the discipline the sheet exists to impose, and the implied multiple at the target closes the loop at 19.1 times. Two details keep the terminal value honest: the acquired intangible pool is rolled forward as a finite balance so the charge stops in year eight rather than running at a share of revenue forever, and terminal reinvestment is sized from a return on capital rather than inherited from the last forecast year, so growth capital expenditure and growth working capital are not capitalised into perpetuity. Terminal value is 66.6 per cent of enterprise value, high for the honest reason rather than because the final year was capitalised with its expansion spending still in it. Scenario bands move earnings and the multiple together, because a downgrade cycle de-rates as well as cuts, giving $75.73 bear, $98.92 base and $120.76 bull with a probability-weighted expected value of $98.58. On the shipped case revenue runs from 1,791 to 2,360 over four fiscal years, gross margin improves from 54.8 to 56.9 per cent on mix, EBITDA margin from 23.6 to 25.2 per cent, adjusted earnings per share from $3.88 to $6.85, and net debt falls from 742 to 151 as free cash flow outruns the dividend and the buyback. Interest is charged on opening net debt rather than the average, so a genuinely recursive capital structure is modelled with no circular reference anywhere in the workbook.
What every model includes
Live formulas, no hardcoded values
Outputs are driven by live formulas, so the workbook updates from its assumptions instead of relying on hardcoded results.
All assumptions in one tab
Inputs are clearly marked in the Assumptions tab and separated from calculations, making it clear what to change and what to leave intact.
Statements always balancing
For integrated-statement models, the balance sheet, cash flow, and supporting schedules tie through properly.
Distinct schedules for clarity
Debt, working capital, taxes, and cash flow can get messy quickly. We group calculations in clear schedules, not across disconnected tabs.
No hidden macros or external links
There are no unexplained external workbook links or macros to undermine auditability or portability.
Changes flow through the model
Update a key driver and see the impact carry through the forecast, financing, and return outputs. We never use hardcoded numbers in formulas.
What's inside the Equity Research Initiation Model
- Base year revenue by segment, margins, depreciation, acquired intangible amortisation, share count and net debt
- Instruments: quarterly seasonality indexed to four, base units, unit growth, selling price and price change
- An installed base roll-forward through deliveries, retirements, closing and average field units
- Consumables sized off the average field: active instrument share and spend per instrument per quarter
- Software: an opening attach rate, a quarterly gain, a hard ceiling, subscription price and renewal uplift
- Operating costs as research and development, selling and marketing, and an inflated fixed overhead base
- A net property roll-forward and a finite acquired intangible pool guarded by a MIN so the charge expires
- Capital returns: a share count roll-forward through buybacks, quarterly dividends, and net debt off free cash flow
How the Equity Research Initiation Model Handles Fiscal Calendars
This equity research initiation template models Meridian Instruments, a mid-cap analytical instruments maker with a September fiscal year end. It addresses four mechanics that generic valuation models miss: a segment build off an installed base, calendarisation for peer comparability, a consensus bridge by sequential substitution, and a target price blended across three valuation methods with scenario bands.
Operating Drivers: Installed Base and Segment Linkages
Two of the three segments are sized off an installed base, not a top-line growth rate. Instruments revenue depends on units shipped, which follow a base level, unit growth, and fiscal seasonality.
- Consumables and software revenue are driven by the average installed base, active share, spend per instrument, and attach rate. This creates a time lag: weak instrument shipments reduce the future installed base, which then lowers consumables and software revenue with a delay.
- The model also applies a hard ceiling on the software attach rate, reflecting that some older platforms cannot be connected, preventing unrealistic compounding.
Calculation Flow: From Quarterly Build to Valuation
The model flows from a quarterly segment build through a quarterly profit and loss account to adjusted earnings per share, then into valuation.
- A calendarisation sheet maps the same sixteen quarters into fiscal years and calendar years, since the company's September year end differs from December-reporting peers.
- The consensus bridge uses a sequential substitution across seven columns, swapping one input at a time to decompose the gap to street estimates into six effects that sum exactly.
- The discounted cash flow valuation runs eight years, with four explicit years and four fade years, and normalises the terminal value using a reinvestment rate based on return on capital.
Outputs: Blended Target Price and Scenario Bands
The target price sheet blends three methods: a discounted cash flow, a target earnings multiple, and a target enterprise multiple.
- Each method uses the same forecast drivers, and the blended target is the weighted average of the three.
- The model also produces scenario bands that move both earnings and the multiple together, reflecting that a downgrade cycle typically de-rates the multiple as well as cutting earnings.
- Validation checks ensure that the method weights and scenario probabilities sum to one, and that the implied earnings multiple from the blended target is close to the target multiple assumed.
Practical Use: When and How to Apply the Template
This template is designed for initiating coverage on a company whose fiscal year does not match its peer group, particularly when a significant portion of revenue is recurring and tied to an installed base.
- The calendarisation feature ensures that multiples are applied to the correct period, avoiding valuation errors that arise from comparing September fiscal EPS to December peer multiples.
- The consensus bridge provides a transparent decomposition of the gap to consensus, helping analysts articulate whether their difference is driven by revenue, margin, costs, or other factors.
- The scenarios and blend offer a structured way to present a target price with clear assumptions.
Formatted to IB standards
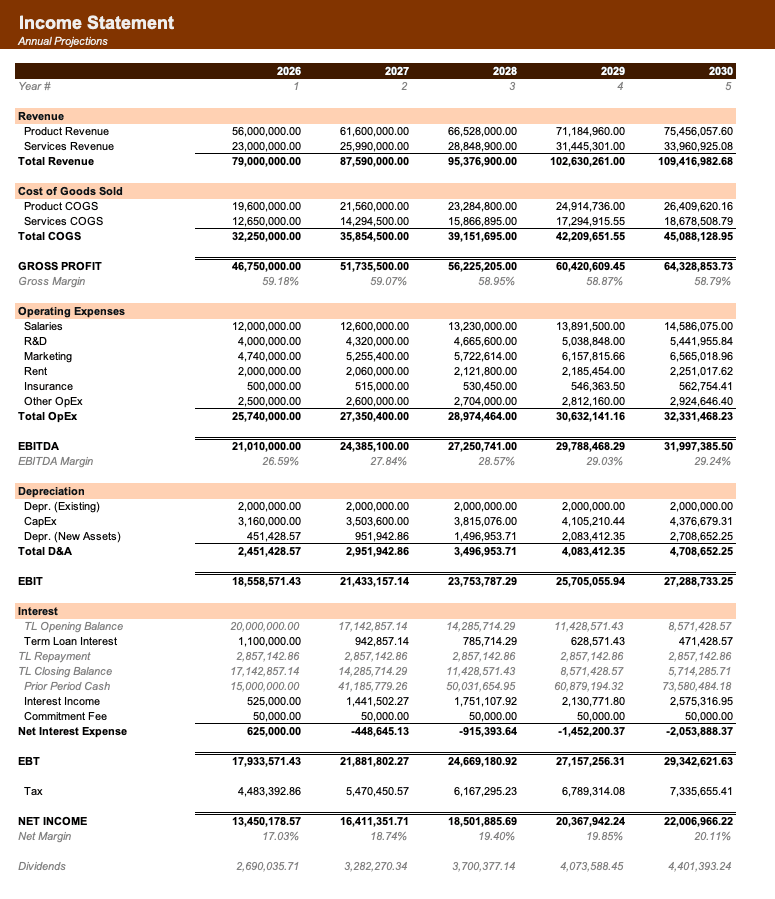
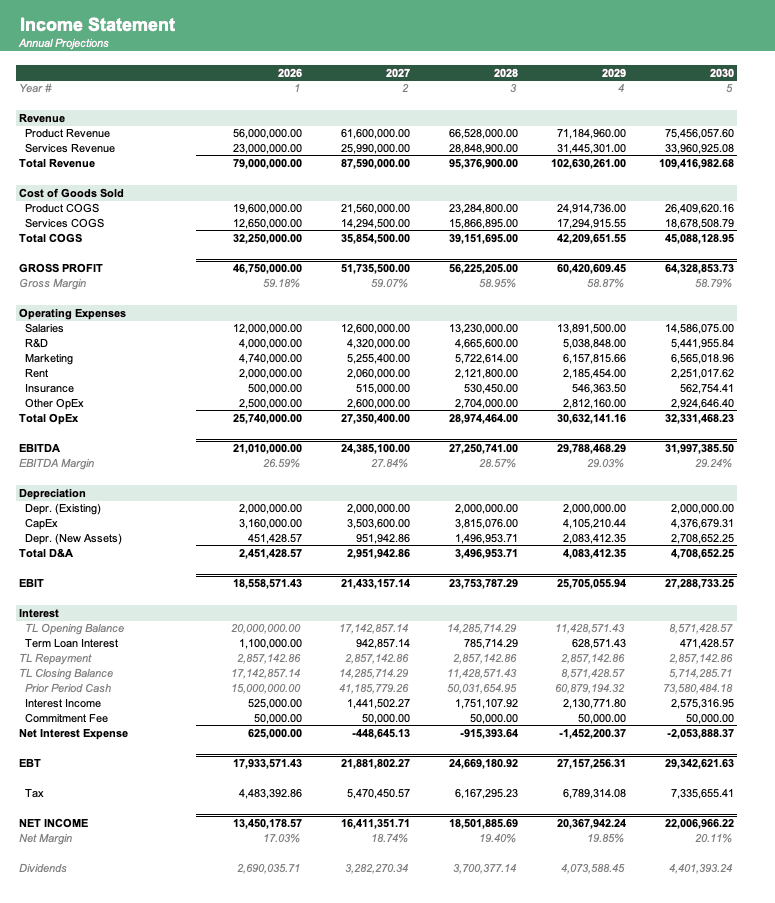
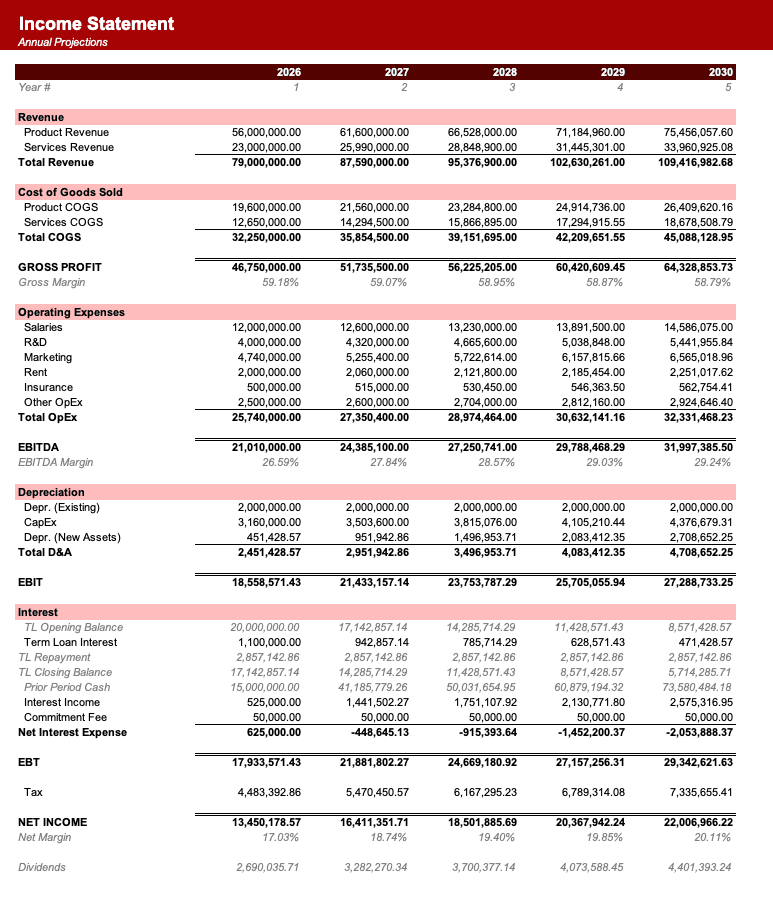
Named theme colors repaint the whole workbook in one click, on top of an investment-banking structure with clear input, output, and cross-sheet reference styling - brand-ready, institutional-grade, and fully auditable.

Created by ex-finance professionals
Hey, I’m Alex and I created Finamodel.
Over my years in the finance industry I kept building the same models over and over again. Same structure, same assumptions, different logo. So I started building frameworks to turn them into clean, reusable templates.
Every model here is one I’d actually use for a client, and I personally vet each one before it goes up.
I’m not an expert in every industry, but I’ve built enough models to know what belongs in one. And when something is completely foreign to me, I reach out to my network for experts to work on our models with us.
Having a template library on hand cuts a first build from hours to minutes.
Need help finding your model? You’ll find me in the Finamodel app!
Frequently asked
What is an equity research initiation model?+
It is the model behind an initiation of coverage note: a forecast detailed enough to publish, a stated view of where it sits against consensus, and a target price with a method attached. What separates it from a plain DCF is that it has to be quoted on the same basis the market quotes the stock, has to be defensible against the street's numbers, and has to survive quarterly revision.
What is calendarisation and why does it matter?+
Calendarisation restates a company's fiscal year onto the calendar year the peer group reports on. Here the fiscal year ends in September, so calendar 2027 is the second, third and fourth quarters of FY27 plus the first quarter of FY28. It matters because peer multiples are quoted on calendar years: applying one to an uncalendarised fiscal figure understates the company by $0.21 a share, 4.3 per cent.
How does the consensus bridge work?+
It builds the same FY27E profit and loss account seven times across seven columns. Column one is entirely consensus; each column after it swaps exactly one input for ours, in profit-and-loss order. The change in earnings per share between adjacent columns is therefore that line alone, which is why the six effects sum to the total gap by construction rather than by a residual.
Why are consumables and software driven off the installed base?+
Because that is how the business works. Reagents are consumed by instruments already in the field, not by instruments sold this quarter. The field is eight to nine times annual shipments, so driving recurring revenue off shipments would make it far more volatile and far more cyclical than it really is.
Why does the software attach rate have a ceiling?+
The oldest platforms in the field cannot be connected at all. Without a ceiling the attach rate compounds toward full penetration of a fleet that would first have to be replaced, and the model quietly forecasts a replacement cycle it has not funded. The ceiling binds from the second quarter of FY29 here.
Why is interest charged on opening net debt rather than the average?+
Because average-balance interest is circular: net debt depends on cash flow, cash flow depends on tax, tax depends on interest, and interest depends on net debt. Charging on the opening balance runs the dependency forward through the quarters, so the workbook holds no circular reference and needs no iterative calculation setting.
How is the terminal value normalised?+
Two ways. The acquired intangible pool is rolled forward as a finite balance with a MIN guard, so the charge stops in year eight rather than running at a share of revenue forever. And terminal reinvestment comes from terminal growth divided by a return on capital, so growth capital expenditure and growth working capital are sized to the growth assumed rather than to whatever the last forecast year happened to spend.
How is the target price built?+
A discounted cash flow, a target earnings multiple on calendar 2027 adjusted EPS and a target enterprise multiple on calendar 2027 EBITDA, weighted 40 / 35 / 25. Scenario bands then move earnings and the multiple together - a downgrade cycle de-rates as well as cuts - giving a bear, base and bull target and a probability-weighted expected value.
How is this different from a DCF or a comps model?+
A DCF values a company off one method and usually starts at annual revenue. A comps model benchmarks multiples but does not forecast. This model does the quarterly forecasting a research desk actually publishes, reconciles it to the street, converts it onto the basis peers trade on, and then triangulates three methods into a single number with bands around it.
Have more financial modelling questions? Contact us
Related templates
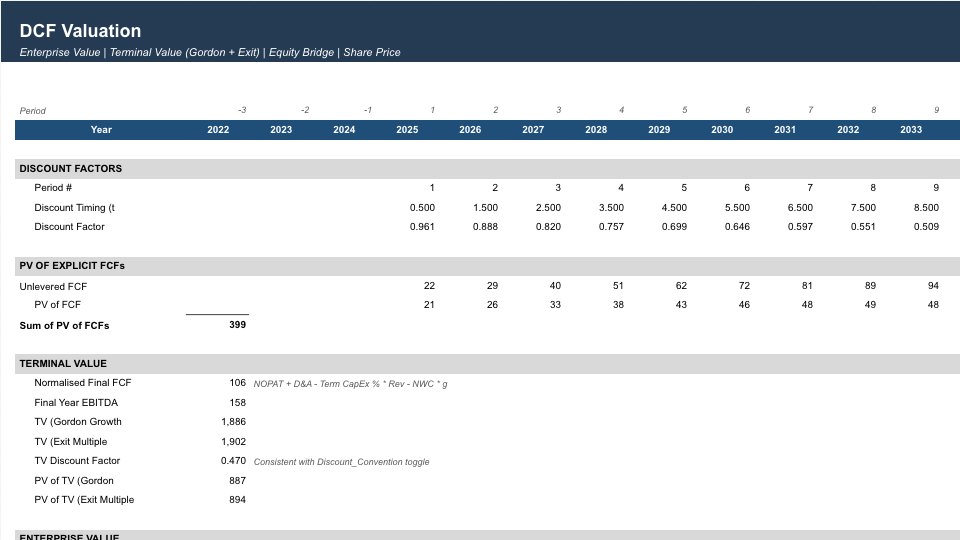
DCF Model
Discounted cash flow valuation model with explicit forecast, terminal value, and WACC.
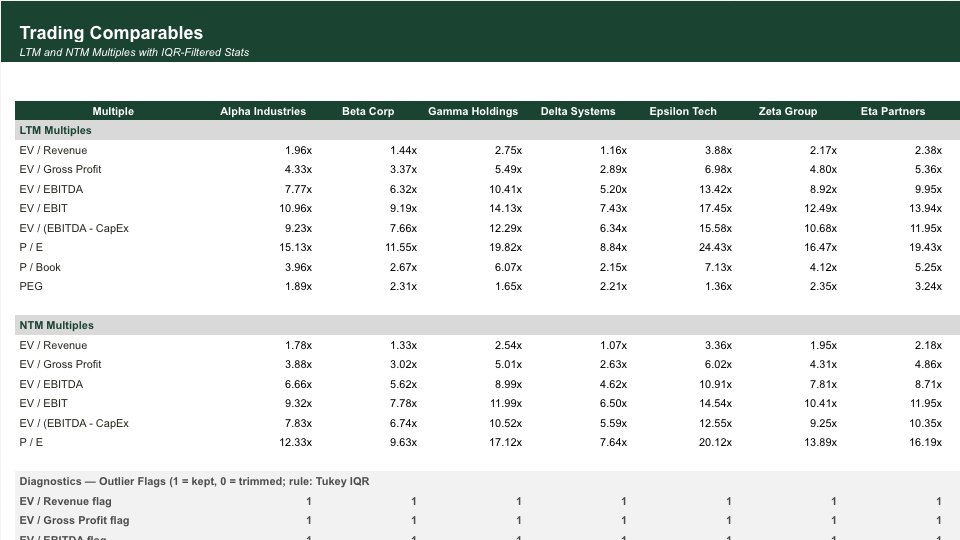
Comparable Companies Analysis
Pull trading multiples from peer companies and calculate implied valuation ranges.
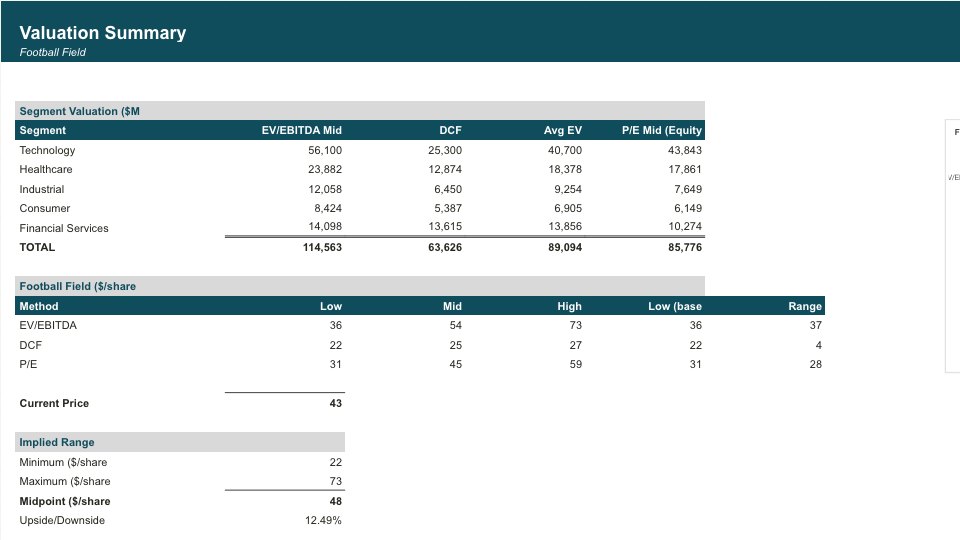
Sum of Parts Valuation
Value a diversified company by valuing each business segment independently and summing the parts.
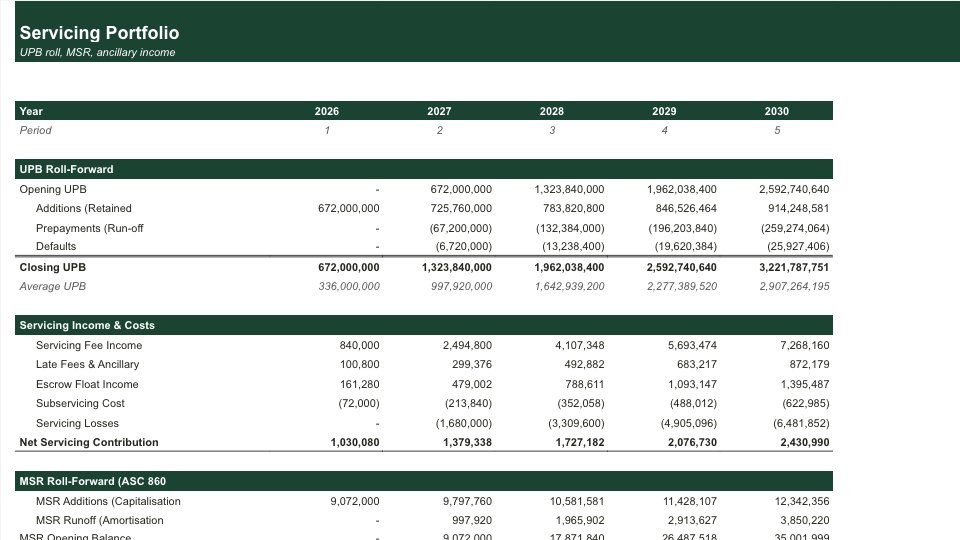
Mortgage Portfolio Model
Mortgage loan portfolio analysis with prepayment speeds, default rates, and cash flow projections.