PLG Funnel Model
Tech & Software Financial Model (Free Excel Download)
See how much of the funnel the product fills by itself. Habitual users send 0.42 invites a month, 28 per cent are accepted, and those acceptances are 36.9 per cent of all signups in month one rising to 40.5 per cent by month twenty-four. The coefficient is built as a lifetime measure - a 3.4 per cent monthly loop rate carried across a 26.3-month average life gives k of 0.88 and 8.5 times amplification - and a stability check flags where k would cross one. The loop is not free: $12 a referral reaches 165 a month, a third of all sales and marketing, against 368 a month of signups it saves buying. Signups run 14,642 to 33,978 a month, the base compounds to 154,715 habitual users, ARR reaches 21,149, and cost per paid user falls from $191 to $148 while lifetime value rises to $852.



professionals from Deloitte






About this model
A self-serve product where signups are an output rather than an input. Most SaaS funnel models take a monthly signup number as an assumption and convert it downward through fixed stage rates; this one refuses to, because the largest single source of new signups is the product's own retained base. Habitual users send invites, a share are accepted, and every accepted invite re-enters the top of the same funnel it came out of. The whole archetype turns on one line: the inviting base is last month's closing habitual users, so the dependency runs forward in time only and a genuinely self-referencing growth engine is modelled with no circular reference anywhere in the workbook and no iterative calculation setting. Reaching back one column instead of sideways within the same column is the entire trick, and it is also how the business really works: a user who signs up on the fifteenth is not inviting anybody that month. Only habitual users invite, which is deliberate - sending the loop off the signup cohort would let a burst of paid traffic manufacture viral growth it has not earned. The coefficient is then built as a lifetime measure rather than a monthly one, in three auditable steps: a monthly loop rate of 3.4 per cent, being invites per user times acceptance times the signup-to-habitual rate, carried across an average lifetime of 26.3 months to give k of 0.88 and an amplification factor of 8.5 times. A stability check flags the point where k crosses one and the amplification formula would invert. Across the window k decays to 0.84 as invite rates mature, while the loop's share of signups rises from 36.9 to 40.5 per cent - not a contradiction, but the divergence a reader who conflates the coefficient with what the loop delivers will misread. Three paid channels are carried separately, because the cheapest visitor at $1.35 converts at less than half the rate of the most expensive at $3.10. The loop is not free: every accepted invite carries a $12 referral credit that reaches 165 a month, a third of the entire sales and marketing line, and the loop is valued net of it - 368 a month of signups that would otherwise be bought, less 165 to run, netting 203. Three acquisition costs sit side by side rather than blended: a paid signup at $26.76, the blend at $14.49, and the $12.27 gap the loop is worth per signup. On the shipped case signups run from 14,642 to 33,978 a month, the habitual base compounds from 46,000 to 154,715 with a dormant pool of 67,391 building behind it, and paid users reach 46,266 at 31.4 per cent penetration. Recurring revenue grows from 199 to 1,762 a month, or 21,149 of ARR, gross margin improves from 64.6 to 83.9 per cent, EBITDA crosses into profit in month 22 and reaches 196, and cash troughs at 11,923 rather than running out. The unit economics improve because the loop does and not because the paid channels do: paid cost per signup is flat at roughly $26.70 all window while the blend falls to $14.49, cost per paid user falls from $191 to $148, lifetime value - capped at a 36-month horizon rather than taken to perpetuity - rises from $534 to $852, and the ratio moves from 2.8 times to 5.7 times with payback compressing from 9.6 months to 4.6.
What every model includes
Live formulas, no hardcoded values
Outputs are driven by live formulas, so the workbook updates from its assumptions instead of relying on hardcoded results.
All assumptions in one tab
Inputs are clearly marked in the Assumptions tab and separated from calculations, making it clear what to change and what to leave intact.
Statements always balancing
For integrated-statement models, the balance sheet, cash flow, and supporting schedules tie through properly.
Distinct schedules for clarity
Debt, working capital, taxes, and cash flow can get messy quickly. We group calculations in clear schedules, not across disconnected tabs.
No hidden macros or external links
There are no unexplained external workbook links or macros to undermine auditability or portability.
Changes flow through the model
Update a key driver and see the impact carry through the forecast, financing, and return outputs. We never use hardcoded numbers in formulas.
What's inside the PLG Funnel Model
- Three paid channels with their own media spend, cost per visitor and visitor-to-signup rate
- Organic acquisition with compounding visitor growth and its own conversion rate
- Loop inputs: invites per active user, invite rate decay, invite acceptance and the referral reward
- Funnel conversion: signup to activated with a monthly gain, activated to habitual, churn and resurrection
- Monetisation: free-to-paid conversion, paid churn, revenue per paid user and monthly expansion
- Cost structure: hosting, support, product headcount, overhead, capitalisation and depreciation
- Working capital and tax: collection days, supplier payment days and the tax rate
- A viral coefficient built as monthly loop rate times average user lifetime, in three visible steps
PLG Funnel Model: How the Acquisition Loop and Unit Economics Work
The PLG funnel model treats signups as an output of the product's retained base, not an input. Habitual users send invites that bring in new signups, creating a self-reinforcing loop.
This preview explains the operating drivers, calculation flow, outputs, and practical use of the template.
The acquisition loop and its operating drivers
At the heart of the model is a one-month lag: the number of inviting users in any month equals the closing habitual base from the prior month. This avoids circular references while reflecting real user behaviour, since new signups do not invite in their first month.
- Only habitual users send invites, which prevents paid traffic from artificially inflating viral growth. Invites sent depend on the invite rate per user, and a fixed acceptance rate converts them into viral signups.
- These viral signups then join paid and organic signups to form total signups, which feed the active base model. The base then rolls forward, with churn and resurrection shaping the habitual pool that will drive next month's invites.
From signups to revenue and unit economics
Total signups flow into the active base, where conversion rates move users from signup to activated to habitual. The habitual base generates paid users through a free-to-paid conversion rate, and revenue is calculated as paid users multiplied by revenue per paid user.
- Expansion revenue is explicitly modelled by repricing the surviving base each period, ensuring the revenue movement check balances to zero. Lifetime value is computed as gross profit per paid user times a capped annuity factor over 36 months, and payback is simply cost per paid user divided by gross profit per paid user.
- These relationships let you trace how acquisition changes propagate to revenue and unit economics.
Key outputs: loop strength, efficiency and financials
The model reports a viral coefficient that combines the monthly loop rate with average user lifetime, giving a lifetime measure of loop strength. A stability check flags when the coefficient approaches one.
- Loop economics separate paid cost per signup, blended cost per signup, and cost per paid user, showing the loop's net contribution after referral rewards. The dashboard summarises signups, habitual users, paid penetration, revenue, gross margin, EBITDA, and cash.
- Validation checks monitor revenue movement, loop stability, base growth, dormant pool, and unit economics thresholds, helping you assess whether the growth engine is behaving as intended.
Practical use: evaluating and stress-testing a PLG strategy
This template is designed for product-led companies that want to test how much of their funnel the product fills itself.
- You can adjust invite rates, acceptance rates, churn, and conversion assumptions to see how the viral coefficient and loop share respond.
- The model shows that a falling coefficient does not necessarily mean the loop is delivering less; the share of signups from the loop can rise if the base compounds faster than the per-user rate decays.
- By tracking loop economics alongside paid acquisition, you can judge whether referral costs are justified and how unit economics improve as the loop strengthens.
Formatted to IB standards
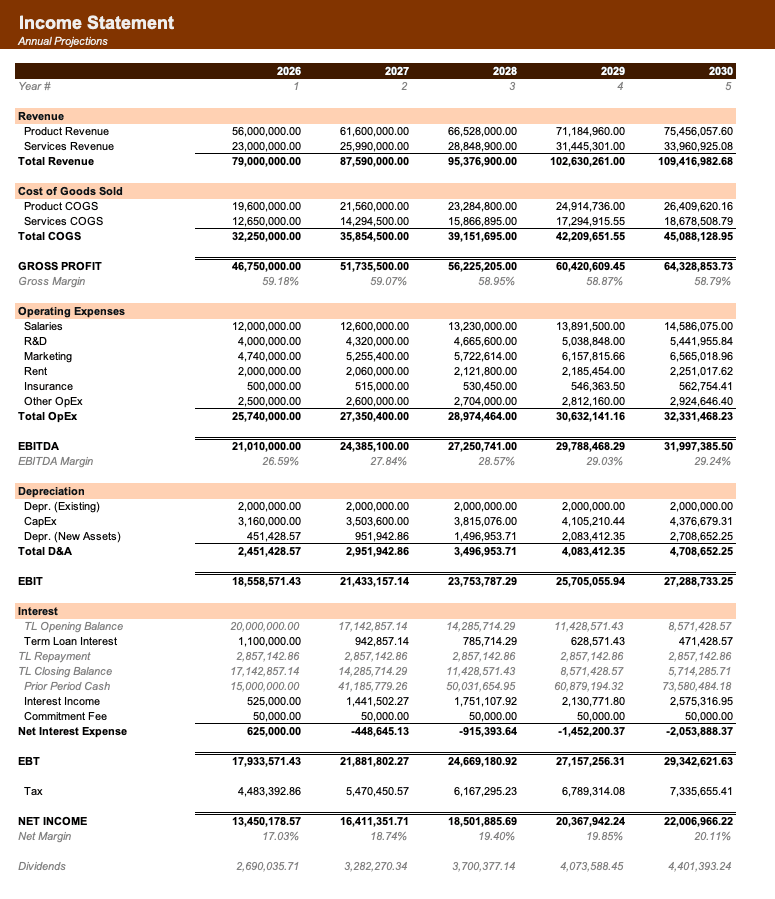
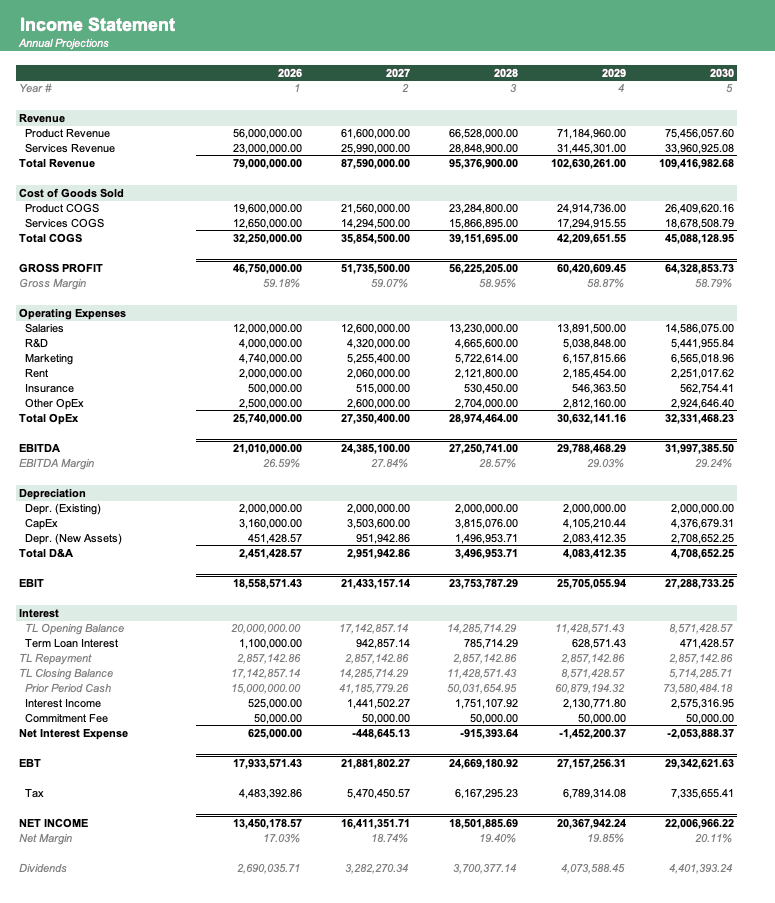
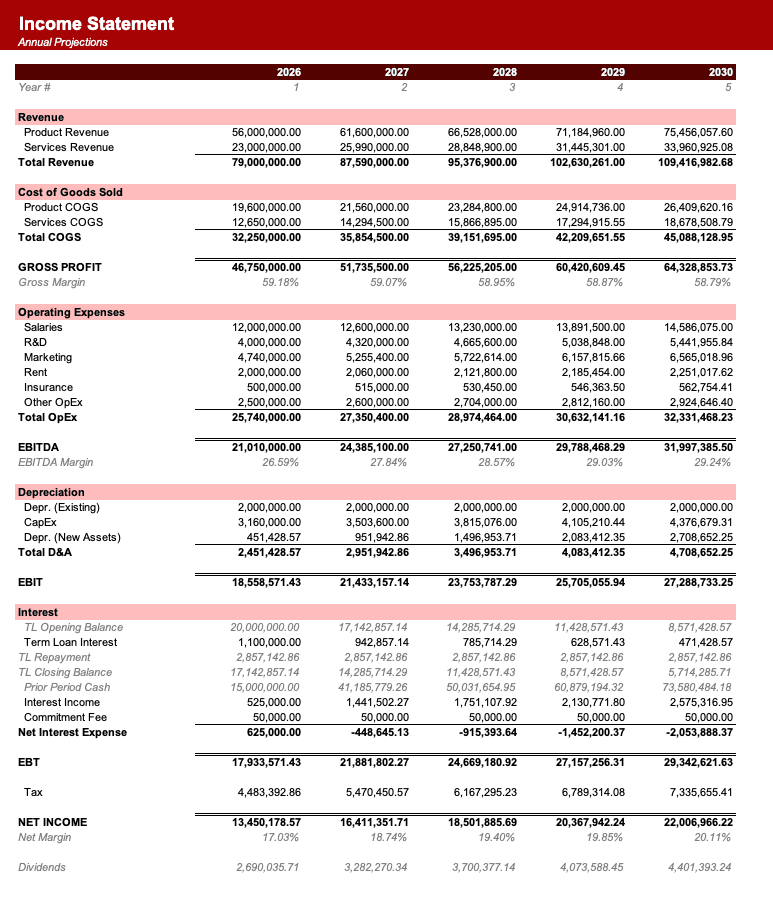
Named theme colors repaint the whole workbook in one click, on top of an investment-banking structure with clear input, output, and cross-sheet reference styling - brand-ready, institutional-grade, and fully auditable.

Created by ex-finance professionals
Hey, I’m Alex and I created Finamodel.
Over my years in the finance industry I kept building the same models over and over again. Same structure, same assumptions, different logo. So I started building frameworks to turn them into clean, reusable templates.
Every model here is one I’d actually use for a client, and I personally vet each one before it goes up.
I’m not an expert in every industry, but I’ve built enough models to know what belongs in one. And when something is completely foreign to me, I reach out to my network for experts to work on our models with us.
Having a template library on hand cuts a first build from hours to minutes.
Need help finding your model? You’ll find me in the Finamodel app!
Frequently asked
What is a product-led growth funnel?+
It is an acquisition model for a product people can sign up for and use without talking to anyone. What separates it from a sales-led funnel is that the product itself is a distribution channel: existing users bring in new ones through shared workspaces, invites and referral links. That makes the funnel a loop rather than a line, and it makes the retained base an acquisition asset rather than just a revenue base.
What is the viral coefficient, or k?+
k is the number of new users each existing user brings in over their own lifetime. Below one, the loop amplifies other acquisition without sustaining growth on its own; at one it is self-sustaining; above one it compounds without external input, which almost nothing does durably. This model builds k as a monthly loop rate multiplied by average user lifetime, which is why 3.4 per cent a month over 26.3 months reads as 0.88.
Why does the model use a one-month lag?+
Because it is both true and convenient. A user who signs up mid-month is not inviting anyone that month, and making the inviting base last month’s closing habitual users means the dependency runs forward in time only. That is what keeps a self-referencing growth engine free of circular references without an iterative calculation setting.
Why do only habitual users send invites?+
Sending the loop off the signup cohort would let a burst of purchased traffic manufacture viral growth that the product has not earned. Tying invites to the retained base means the loop is only ever as strong as the product’s ability to hold on to people, which is the honest version of the mechanic.
What is the amplification factor?+
It is one divided by one minus k, and it says how many total signups each non-viral signup eventually produces once the loop has run its course. At k of 0.88 the factor is 8.5 times. It inverts and turns negative above k of one, which is why the model carries an explicit stability check.
Can the viral coefficient fall while the loop grows?+
Yes, and it does here. k slides from 0.88 to 0.84 as invite rates decay, while the loop’s share of signups rises from 36.9 to 40.5 per cent, because the habitual base compounds faster than the per-user rate decays. Reading k as a measure of how much the loop delivers is the most common mistake with this archetype.
Why is lifetime value capped rather than taken to perpetuity?+
At 1.8 per cent monthly churn a perpetuity is worth 55.6 months of gross profit; capped at 36 months it is worth 26.7. The capped figure is the one a board or an investment committee will accept, and using the perpetuity here would have printed a lifetime value to cost ratio of eleven instead of 5.7.
How is this different from a SaaS MRR model or a cohort retention model?+
An MRR model rolls recurring revenue forward through new, expansion, contraction and churn but takes new customers as an input. A cohort retention model measures how a fixed cohort decays over time. This model is about where the cohorts come from: the acquisition engine that produces them, and specifically the share of it the product generates by itself.
Have more financial modelling questions? Contact us
Related templates
SaaS MRR/ARR Forecast Model
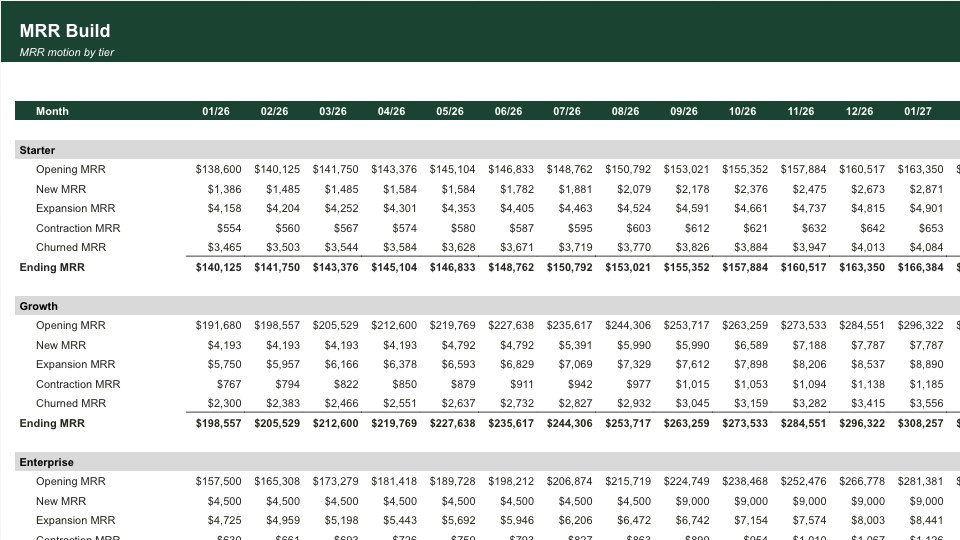
Subscription forecast with logo motion, MRR build, ARR, NRR/GRR, and CAC payback for SaaS businesses.
Unit Economics Dashboard
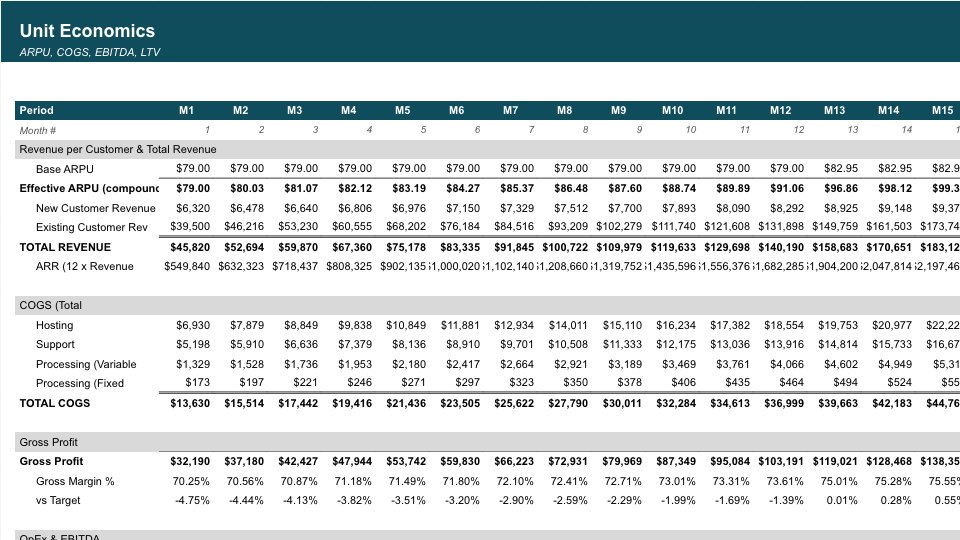
Track customer acquisition cost, lifetime value, payback period, and margins by customer segment.
Cohort Retention
12-cohort SaaS retention model with logo curve, NRR, and LTV per cohort.
Startup Financial Model
All-in-one 60-month plan for early-stage startups: revenue, headcount, P&L, cash and runway, with two funding rounds.