Usage-Based Pricing Model
Tech & Software Financial Model (Free Excel Download)
See what committed-consumption pricing actually does to a P&L. A commitment buys 62.0 thousand credits for four quarters at $2.74 each, a 28 per cent discount to the $3.80 list rate, and anything past the grant is billed at $3.97. Because a heavy 32 per cent of customers run at 1.38 times steady-state usage and the light 68 per cent at 0.82, the same contract produces breakage and overage at once: 58.5 credits drawn for 94.3 per cent utilisation, 3.5 expired, 10.8 overdrawn. Scaled across twelve quarters the book reaches 284 active contracts and 26,159 of quarterly revenue - 14,910 drawdown, 3,284 on demand, 730 breakage, 7,235 self-serve - against 29,865 of deferred revenue that ties to the unused credit balance to the cent. Billings run 3.24x revenue in the first quarter and 1.14x by the twelfth, EBITDA crosses into profit in the eighth, and gross margin climbs from 39 to 77 per cent as compute cost deflates.



professionals from Deloitte






About this model
A consumption-priced software business where cash, billings and revenue are three different numbers. Enterprise customers prepay for a pool of credits and draw it down as they consume, so revenue is recognised on consumption rather than on the calendar and the deferred revenue balance is a physical credit inventory rather than a straight-line release. The mechanic is built once for a single contract and then scaled onto every signing vintage. A commitment buys 62.0 thousand credits for four quarters at $2.74 each, a 28 per cent discount to the $3.80 list rate, and anything consumed past the grant is billed in arrears at $3.97. Because customers do not consume evenly, the contract is split before the drawdown is calculated: a heavy 32 per cent running at 1.38 times steady-state usage exhausts its grant in the third quarter and pays 3.3 then 30.4 credits on demand, while the light 68 per cent at 0.82 times finishes the term with 5.2 credits unused. Blending after the MIN rather than before is what keeps both effects alive - the blended contract draws 58.5 of its 62.0 credits for 94.3 per cent utilisation, expires 3.5, and overdraws 10.8 - where a single average contract would show neither breakage nor overage. Four vintage rows, one per contract age, turn that profile into the aggregate ledger without a single lookup, and a size index that escalates commitments and usage together at 3 per cent a quarter keeps one profile exact for every cohort. Twelve direct contracts a quarter growing at 9 per cent, plus 0.25 per cent of a self-serve base that reaches 5,731 accounts, plus renewals at 84 per cent logo retention, build to 284 active contracts and 26,159 of quarterly revenue: 14,910 of committed drawdown, 3,284 on demand, 730 of expired credits at full margin, and 7,235 from a self-serve tier that pays list in arrears with no deferral at all. Deferred revenue closes at 29,865, and because only drawdown and breakage touch it, that balance equals the 10,915 of unused credits at the committed price to the cent - the model's main structural test. Billings run at 3.24 times revenue in the first quarter and converge to 1.14 as the book seasons, which is the cash the prepaid model collects early: EBITDA of -4,655 in the first quarter crosses into profit in the eighth and reaches 6,643 at a 25 per cent margin, while cash troughs at 5,137 rather than running out. Compute cost of $0.92 a credit deflating 5 per cent a quarter against a growing usage base takes gross margin from 39 to 77 per cent, and the contract itself pays back its 153 of loaded acquisition cost in three quarters for 8.3 times lifetime value.
What every model includes
Live formulas, no hardcoded values
Outputs are driven by live formulas, so the workbook updates from its assumptions instead of relying on hardcoded results.
All assumptions in one tab
Inputs are clearly marked in the Assumptions tab and separated from calculations, making it clear what to change and what to leave intact.
Statements always balancing
For integrated-statement models, the balance sheet, cash flow, and supporting schedules tie through properly.
Distinct schedules for clarity
Debt, working capital, taxes, and cash flow can get messy quickly. We group calculations in clear schedules, not across disconnected tabs.
No hidden macros or external links
There are no unexplained external workbook links or macros to undermine auditability or portability.
Changes flow through the model
Update a key driver and see the impact carry through the forecast, financing, and return outputs. We never use hardcoded numbers in formulas.
What's inside the Usage-Based Pricing Model
- Acquisition inputs: new direct contracts and their growth, logo retention at renewal, self-serve signups, self-serve growth, churn and the conversion rate into commitments
- Pricing and credit terms: list price per credit, the committed discount, the on-demand premium, credits granted per commitment and a contract escalation rate
- Consumption profile: steady-state usage per contract, a heavy-usage share with heavy and light multiples, a four-quarter usage ramp vector, and usage per self-serve account
- Cost inputs: compute cost per credit with a quarterly deflation rate, support cost per contract and per self-serve account, hosting, payment processing and a cost inflation index
- Operating expense inputs: acquisition cost per new logo, self-serve acquisition cost, brand marketing, engineering headcount and its growth, cost per engineer, general and administrative cost, the capitalised software share and a depreciation life
- Working capital inputs: separate invoice days for commitments, on-demand billing and self-serve collection, supplier payment days, the tax rate and opening cash
- Customer_Base sheet: new logos, self-serve conversions, renewals of the cohort ageing out, contracts signed, four age bands and the active book, plus a self-serve account roll-forward
- Consumption sheet: the contract size index, a per-contract usage profile split into heavy and light tiers and blended, a four-row vintage build to committed consumption, and self-serve consumption
Usage-Based Pricing Model: How Committed Consumption Drives Revenue
This usage-based pricing model captures a software business where enterprise customers prepay for credits, drawing them down over a four-quarter term, and are billed in arrears for any overage. It distinguishes cash, billings, and revenue by modelling credit expiry and consumption dispersion.
The template illustrates how breakage and overage coexist within the same contract and how the deferred revenue balance acts as a physical credit inventory.
Operating Drivers: Commitments, Consumption, and Contract Economics
The model is built on a committed tier where customers sign a four-quarter contract, are invoiced at signing, and receive a discounted credit grant. Consumption dispersion is captured by splitting contracts into heavy and light profiles.
- Heavy users overshoot and pay overage at a premium; light users undershoot and leave credits to expire as breakage. A separate self-serve tier pays list price in arrears with no commitment or deferral, and a small share of those accounts converts to committed contracts each quarter.
- The committed price is derived from list less a discount, and the overage price adds a premium. Contract size escalates via an index, and compute cost per credit deflates over time.
These drivers determine the split between cash collected upfront and revenue recognised on consumption.
Calculation Flow: From Credit Grant to Financial Statements
The credit ledger is first built for one contract over its four-quarter term, then scaled to each quarterly cohort. For each tier and age, consumption is a base amount scaled by a tier multiplier and a ramp factor.
- The drawn amount is the minimum of consumption and the available pool, which prevents a negative balance. Overage is consumption minus drawn, and closing balance rolls forward as opening plus grant minus drawn.
- Expired credits are the closing balance at the final age. Blending occurs after the minimum to preserve both breakage and overage.
- The aggregate ledger scales the per-contract profile by contracts signed and a size index, then computes grants, draws, expiries, and closing balances. Revenue recognition uses four lines: committed drawdown, overage, breakage, and self-serve.
Deferred revenue rolls forward with committed billings, drawdown revenue, and breakage revenue. Costs are driven by platform consumption and a deflating unit cost, while depreciation follows capitalised software rules.
Key Outputs: Revenue, Deferred Balance, and Performance Metrics
The model produces an income statement with four revenue streams, margins, and EBITDA. A cash flow statement shows collections, receivables by billing stream, deferred revenue movements, and free cash flow.
- A unit economics sheet calculates ACV, CAC, payback, LTV, NRR, utilisation, breakage, and Rule of 40. The dashboard aggregates KPI cards, summary tables, charts, and a billings-to-revenue bridge.
- A central structural check ensures that closing deferred revenue equals the closing credit balance times the committed price. Other checks compare the credit balance to live vintages, verify that drawn plus expired equals granted, and that consumption splits into drawn and overage.
Validation targets include utilisation between 85% and 100%, breakage between 3% and 10% of credits granted, and positive EBITDA by quarter eight.
Practical Use: Evaluating Trade-offs in Committed Consumption
This template helps assess how committed consumption pricing affects a profit and loss account compared with ratable subscriptions. It clarifies that revenue is recognised on consumption, not on the calendar, so the deferred revenue balance behaves like a physical credit inventory.
- The model makes visible that the same contract can produce breakage for one customer and overage for another in the same quarter, which a single average contract would hide. It also connects cohort dynamics to net revenue retention, showing how logo retention and commitment escalation interact.
- Common pitfalls are highlighted: blending tiers before the minimum removes both breakage and overage; moving revenue lines must move credits at the same price; breakage carries no compute cost; and renewals must not double-count. The free download includes the full Excel workbook with formulas.
The interactive site preview displays cached values.
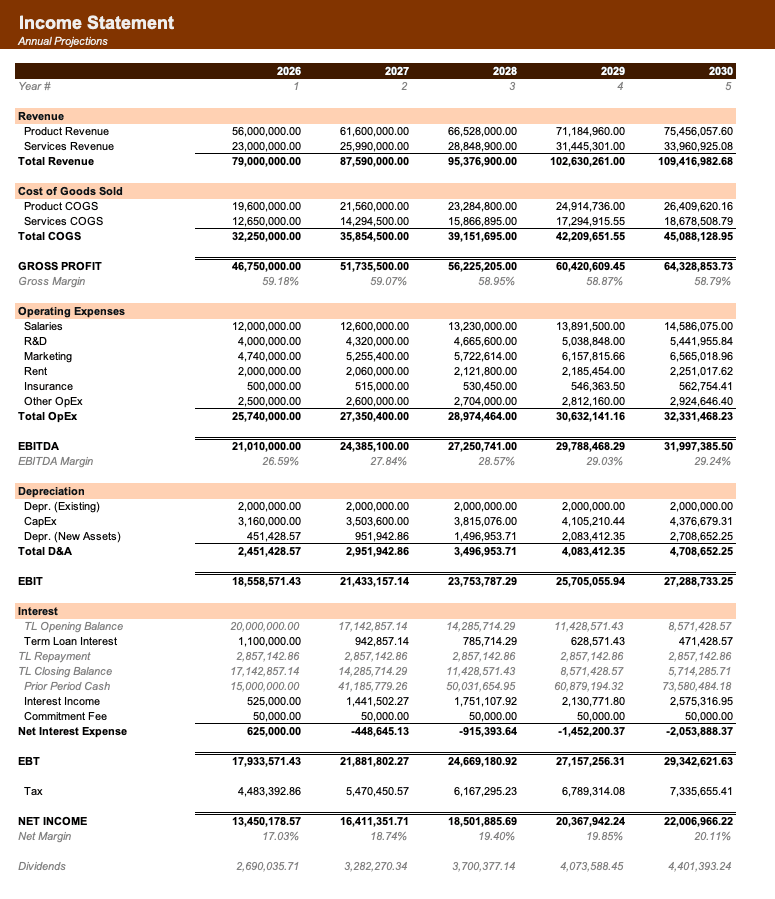
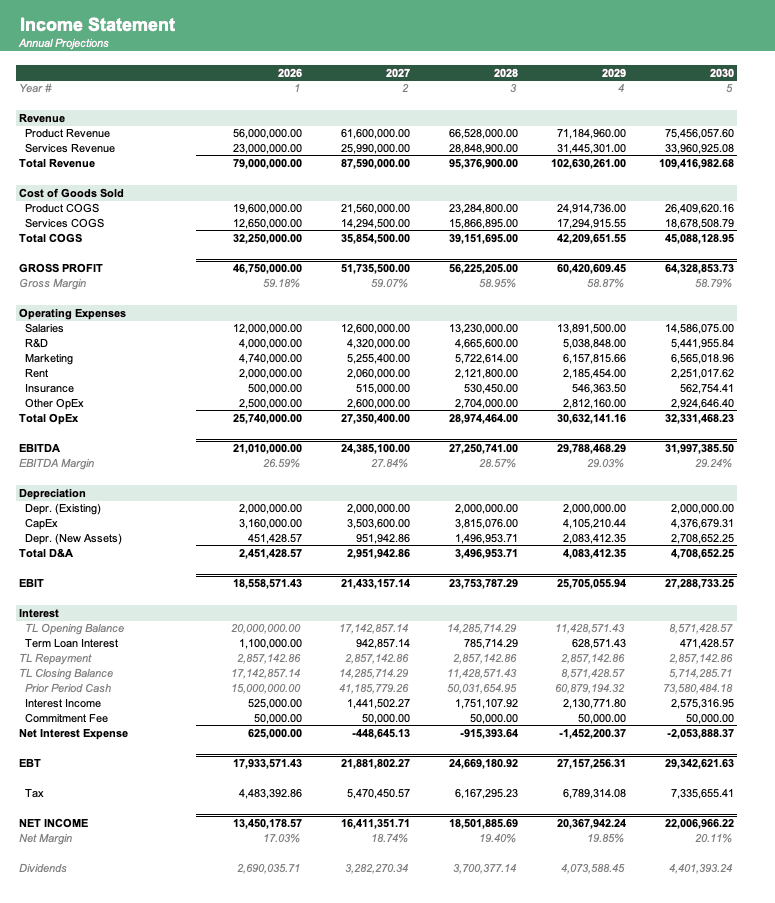
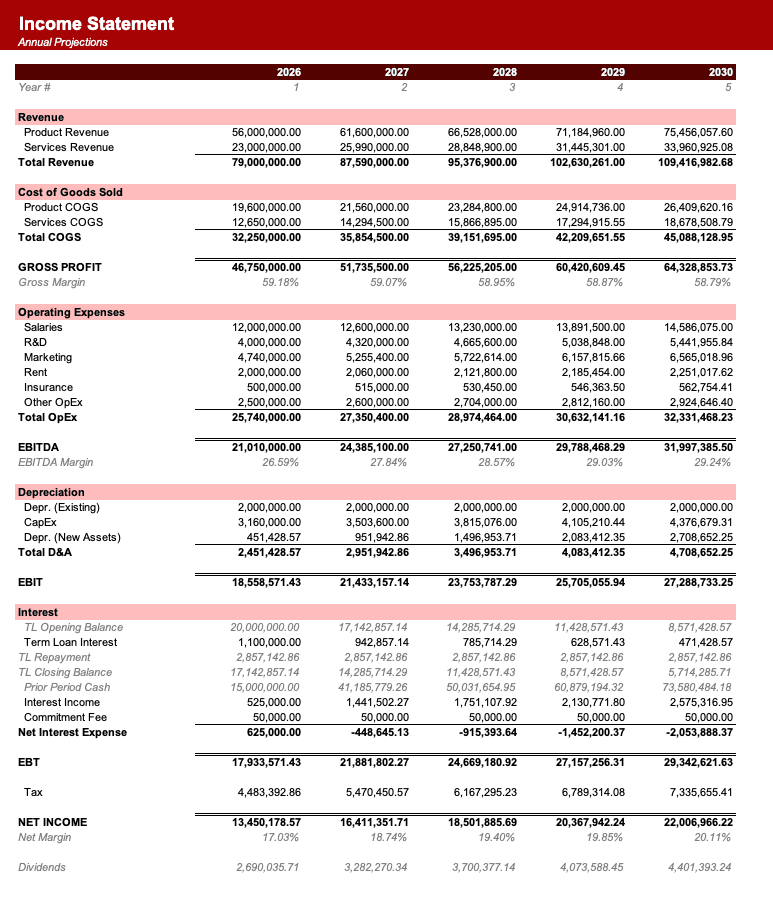
Formatted to IB standards
Named theme colors repaint the whole workbook in one click, on top of an investment-banking structure with clear input, output, and cross-sheet reference styling - brand-ready, institutional-grade, and fully auditable.

Created by ex-finance professionals
Hey, I’m Alex and I created Finamodel.
Over my years in the finance industry I kept building the same models over and over again. Same structure, same assumptions, different logo. So I started building frameworks to turn them into clean, reusable templates.
Every model here is one I’d actually use for a client, and I personally vet each one before it goes up.
I’m not an expert in every industry, but I’ve built enough models to know what belongs in one. And when something is completely foreign to me, I reach out to my network for experts to work on our models with us.
Having a template library on hand cuts a first build from hours to minutes.
Need help finding your model? You’ll find me in the Finamodel app!
Frequently asked
What is usage-based pricing?+
Charging for what a customer actually consumes rather than for a seat or a subscription period. In this model consumption is metered in credits: enterprise customers prepay for a pool of them at a discount and draw it down, while self-serve accounts pay list price for what they use with no commitment at all.
How is this different from a subscription model?+
Revenue is recognised on consumption, not on the calendar. A subscription releases deferred revenue in equal slices; a credit commitment releases it when credits are drawn, which means the release is lumpy, follows the customer's usage ramp, and leaves a residue that has to be dealt with when the term ends.
What is breakage?+
Revenue recognised on prepaid credits that expire unused. The cash was collected at signing, so breakage carries no compute cost at all and lands at a full margin. Here it runs at about 5.7 per cent of credits granted, produced entirely by the light-usage tier.
What is overage, and why does it appear alongside breakage?+
Overage - on-demand consumption here - is usage above the credit grant, billed in arrears at a premium. It coexists with breakage because customers do not consume uniformly: the heavy tier exhausts its grant in the third quarter of the term while the light tier is still leaving credits on the table.
Why split contracts into heavy and light tiers?+
Because the drawdown is a MIN of consumption against the available balance, and the minimum of an average is not the average of the minimums. Model one average contract and both effects cancel; split it, apply the MIN inside each tier, then blend, and the model reproduces what a real book does.
How does the deferred revenue check work?+
Deferred revenue moves on committed billings less drawdown and breakage. Credits move on grants less draws less expiry. Both use the committed price, so the closing deferred balance must equal the closing credit balance at that price. The difference is a check row and it should read zero in every quarter.
Why do credits expire?+
Because the commitment has a term - four quarters here. Expiry is what turns an unused balance into revenue and what makes the deferred balance finite; without it a growing book would accumulate an ever-larger liability that never resolves.
What does the contract size index do?+
It escalates the commitment and the usage together at the same rate, which keeps a single per-contract profile exact for every signing cohort. Without it each vintage would need its own utilisation profile, and the vintage build would need a lookup.
Why is net revenue retention only around 95 per cent?+
Because 84 per cent logo retention at renewal only just outruns 12 per cent annual commitment escalation. Both are single inputs on the Assumptions sheet: raise either and net revenue retention moves directly, which is the point of showing the two components separately.
Can it model a pure pay-as-you-go business?+
Yes. Set new committed contracts to zero and the model collapses to the self-serve tier: metered consumption billed at list in arrears, no deferred revenue and no breakage. The credit ledger sheets simply run flat, which is a useful way to see what the commitment actually buys.
Have more financial modelling questions? Contact us
Related templates
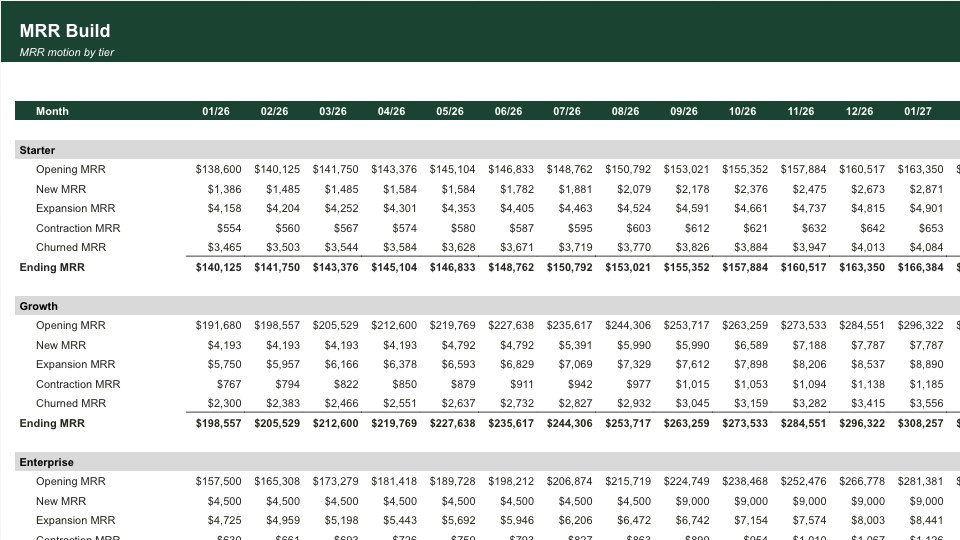
SaaS MRR/ARR Forecast Model
Subscription forecast with logo motion, MRR build, ARR, NRR/GRR, and CAC payback for SaaS businesses.
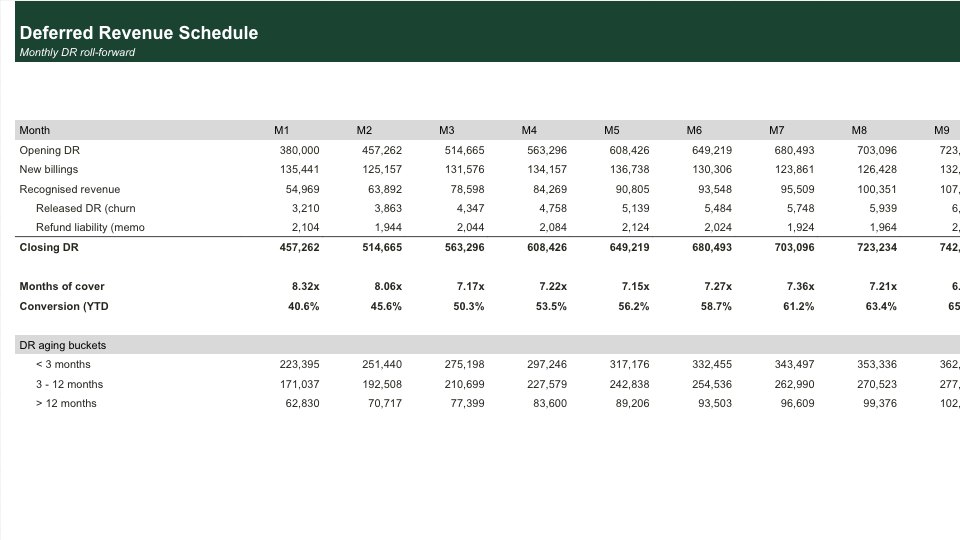
Deferred Revenue
12-month deferred-revenue (contract liability) roll-forward with billings-to-revenue conversion across a contract panel.
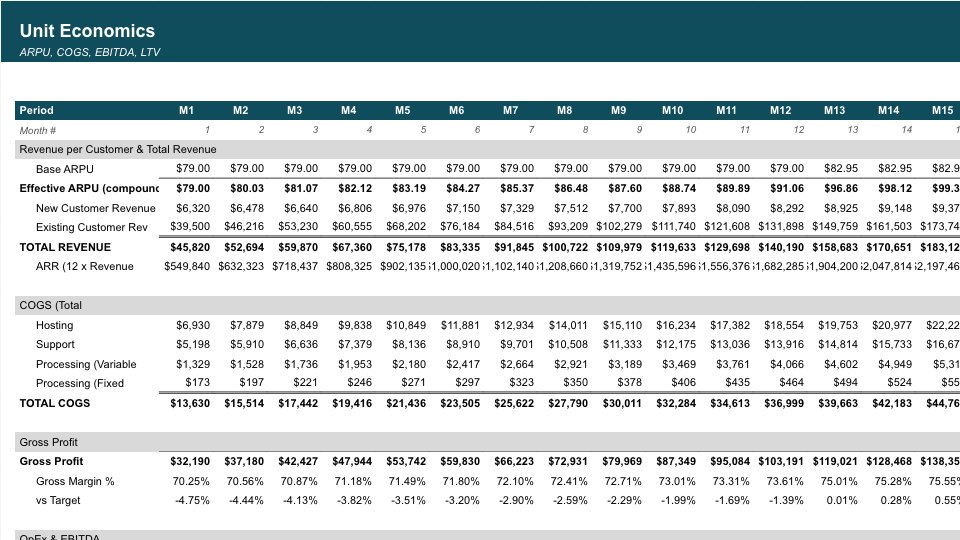
Unit Economics Dashboard
Track customer acquisition cost, lifetime value, payback period, and margins by customer segment.
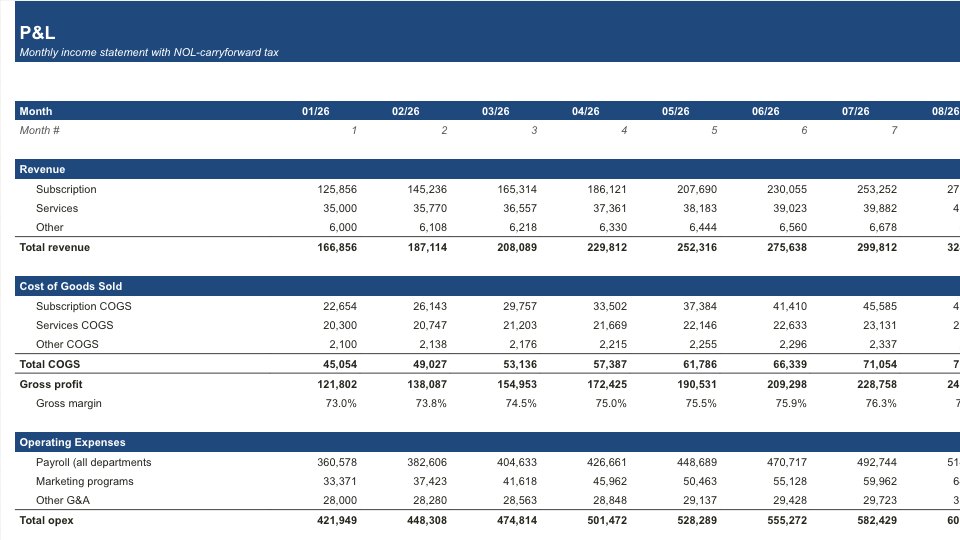
Startup Financial Model
All-in-one 60-month plan for early-stage startups: revenue, headcount, P&L, cash and runway, with two funding rounds.