
Accretion / Dilution Analysis in M&A
Key Takeaways
- The whole analysis is one ratio: pro forma EPS ÷ standalone acquirer EPS − 1. Everything else is about building pro forma net income and pro forma shares correctly.
- The P/E rule of thumb predicts the direction of an all-stock deal: accretive when the acquirer's P/E exceeds the P/E paid (premium included), dilutive when it's lower.
- Financing choice usually dominates. Cheap after-tax debt makes cash deals more accretive than the same deal in stock; issuing equity at a low earnings yield is the costliest way to pay.
- Synergies are decisive and dangerous. They can flip a dilutive headline to accretive - which is exactly why breakeven synergy analysis ("how much do we actually need?") is the most persuasive number in the deck.
- Sensitivity beats a point estimate. A premium-by-financing-mix grid shows where the deal tips from accretive to dilutive and how much cushion you have.
- Accretive is not the same as value-creating. Use accretion / dilution to screen and communicate; use DCF, comps, and returns analysis to actually decide.
Ready to run your own deal? Start with the M&A Modeling & Valuation template - it pairs the accretion / dilution engine with DCF, comps, and precedent transactions so you can pressure-test both the EPS optics and the underlying economics in one workbook.
Accretion / dilution analysis answers the first question every M&A banker is asked about a deal: will it raise or lower the acquirer's earnings per share? An accretive deal lifts pro forma EPS above the acquirer's standalone EPS; a dilutive deal drops it below. This guide explains the mechanics, the famous P/E rule of thumb, a full worked example across cash, stock, and mixed financing, how synergies and breakeven analysis fit in, and the mistakes that quietly break most accretion / dilution models.
Accretion / dilution is the back-of-the-envelope test that gets run on every deal before anyone builds a full merger model. It is deceptively simple: combine the two companies' earnings, adjust for how the deal is paid for, divide by the new share count, and compare the result to the acquirer's standalone EPS. Yet it drives boardroom decisions, because public-company acquirers are judged on EPS, and an EPS-dilutive deal is a hard story to sell to shareholders.
The catch is that "accretive" and "value-creating" are not the same thing. A deal can be accretive and still destroy value (cheap debt funding a poor business), or dilutive and still create enormous value (think early-stage, high-growth targets). Accretion / dilution measures the near-term EPS optics, not the economics. Understanding exactly what it does and does not say is what separates a useful analysis from a misleading one.
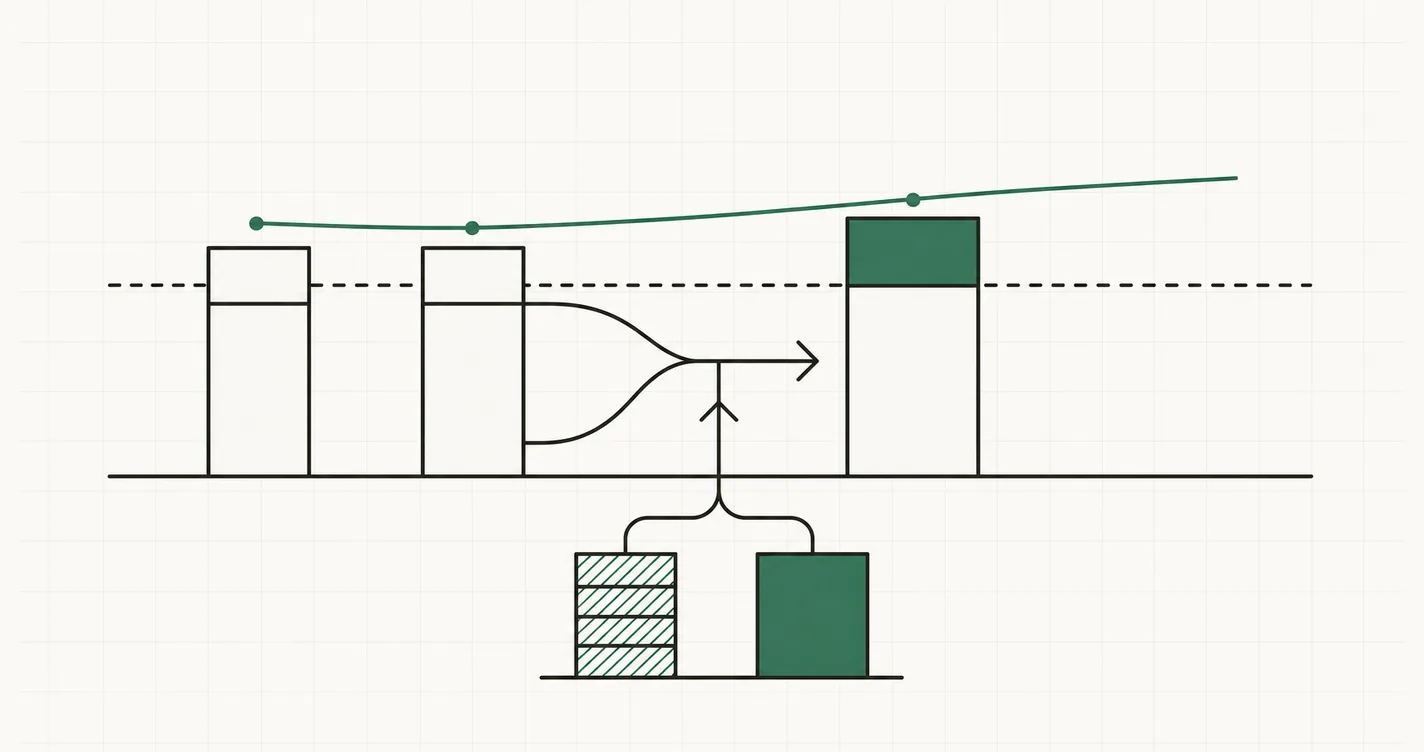
The Accretion / Dilution Workflow: from combined earnings to a pro forma EPS verdict.
What Accretion / Dilution Actually Measures
The entire analysis reduces to one comparison:
Accretion / (Dilution) % = Pro Forma EPS / Standalone Acquirer EPS - 1
Where pro forma EPS is the combined company's earnings per share after the deal closes:
Pro Forma EPS = Pro Forma Net Income / Pro Forma Diluted Shares
A positive result means the deal is accretive; a negative result means dilutive; zero is breakeven. Everything else in the model exists to build up those two numbers - pro forma net income and pro forma shares - correctly.
Pro forma net income starts with the two companies' standalone net incomes and then layers on the earnings consequences of how the deal is financed and integrated:
Pro Forma Net Income =
    Acquirer Net Income
  + Target Net Income
  + After-Tax Synergies
  - After-Tax Interest on New Acquisition Debt
  - After-Tax Foregone Interest on Cash Used
  - After-Tax Incremental D&A from Asset Write-Ups
Pro forma shares is the acquirer's diluted share count plus any new shares issued to fund a stock-financed portion of the deal:
Pro Forma Diluted Shares = Acquirer Diluted Shares + New Shares Issued
The three financing levers - new debt, balance-sheet cash, and new equity - each hit the equation differently. Debt and cash reduce net income (interest cost, foregone interest); equity increases the share count. Which lever you pull is usually the single biggest driver of the result.
The P/E Rule of Thumb
Before building anything, you can predict the direction of a 100% stock deal with a single comparison: the acquirer's P/E versus the P/E it is paying for the target (inclusive of the control premium).
| Comparison | All-Stock Result |
|---|---|
| Acquirer P/E > P/E Paid | Accretive |
| Acquirer P/E < P/E Paid | Dilutive |
| Acquirer P/E = P/E Paid | Breakeven |
The intuition: in an all-stock deal the acquirer is effectively "printing" its own equity - valued at its P/E - to buy the target's earnings at the P/E it pays. Buy earnings more cheaply than your own stock is valued, and EPS goes up. The "P/E paid" is the effective deal multiple, which includes the premium:
P/E Paid = Offer Value for Equity / Target Net Income
For cash deals the comparison shifts: instead of the acquirer's P/E, you compare the target's earnings yield (1 ÷ P/E paid) against the after-tax cost of the cash or debt used. If the target's earnings buy more than the after-tax financing costs, the deal is accretive. Because after-tax debt is usually far cheaper than equity, cash deals are almost always more accretive than the same deal done in stock - which is exactly why so many strategic buyers reach for debt first.
The P/E multiples you plug in here are the same ones you would pull from a comparable company analysis. The live model below shows where those trading multiples come from before they feed the deal math.
Worked Example: BuyCo Acquires SellCo
Let's run the numbers on a concrete deal. Two standalone profiles:
| Metric | BuyCo (Acquirer) | SellCo (Target) |
|---|---|---|
| Net Income | $500.0M | $120.0M |
| Diluted Shares | 250.0M | 60.0M |
| EPS | $2.00 | $2.00 |
| Share Price | $40.00 | $30.00 |
| P/E | 20.0x | 15.0x |
| Market Cap | $10,000M | $1,800M |
Deal terms: BuyCo offers $36.00 per share for SellCo - a 20% premium to the $30.00 unaffected price.
// Equity offer value (what BuyCo pays SellCo shareholders)
= Offer_Price_Per_Share * Target_Shares
= 36.00 * 60.0          // = $2,160M

// Effective P/E paid (includes the 20% premium)
= Offer_Value / Target_Net_Income
= 2160 / 120            // = 18.0x
So BuyCo is paying 18.0x earnings - above SellCo's standalone 15.0x because of the premium, but still below BuyCo's own 20.0x. The rule of thumb already tells us an all-stock deal will be accretive. Assume a 25% tax rate and that any cash portion is funded with new debt at 6.0%.
Scenario A - 100% Cash (debt-financed)
// New acquisition debt = full offer value
New_Debt = 2160

// After-tax interest cost
= New_Debt * Interest_Rate * (1 - Tax_Rate)
= 2160 * 0.06 * 0.75    // = $97.2M

// Pro forma net income (no new shares)
= 500 + 120 - 97.2      // = $522.8M

// Pro forma EPS
= 522.8 / 250           // = $2.091
Accretion = $2.091 / $2.00 − 1 = +4.6%.
Scenario B - 100% Stock
// New shares issued at BuyCo's $40 price
= Offer_Value / Acquirer_Share_Price
= 2160 / 40             // = 54.0M new shares

// Pro forma shares
= 250 + 54              // = 304.0M

// Pro forma net income (no financing cost)
= 500 + 120             // = $620.0M

// Pro forma EPS
= 620 / 304             // = $2.040
Accretion = $2.040 / $2.00 − 1 = +2.0%.
Scenario C - 50% Cash / 50% Stock
Half the $2,160M is debt ($1,080M → $48.6M after-tax interest); half is stock ($1,080M ÷ $40 = 27.0M new shares).
// Pro forma net income
= 500 + 120 - (1080 * 0.06 * 0.75)   // = $571.4M

// Pro forma shares
= 250 + (1080 / 40)                  // = 277.0M

// Pro forma EPS
= 571.4 / 277                        // = $2.063
Accretion = $2.063 / $2.00 − 1 = +3.1%.
Comparing the Three Structures
| Financing | Pro Forma Net Income | Pro Forma Shares | Pro Forma EPS | Accretion / (Dilution) |
|---|---|---|---|---|
| 100% Cash (debt) | $522.8M | 250.0M | $2.091 | +4.6% |
| 50% / 50% | $571.4M | 277.0M | $2.063 | +3.1% |
| 100% Stock | $620.0M | 304.0M | $2.040 | +2.0% |
All three are accretive, but cash is the most accretive. The after-tax cost of debt is 6.0% × (1 − 25%) = 4.5%, while BuyCo buys SellCo's earnings at an 18.0x multiple - a 5.6% earnings yield. Funding a 5.6% yield with 4.5% money is pure accretion. The all-stock structure is thinnest because BuyCo issues equity valued at a 5.0% earnings yield (1 ÷ 20.0x) to buy earnings yielding 5.6% - still positive, but a narrower spread.
Layering in Synergies
Synergies - cost savings or revenue gains from combining the businesses - are added to pro forma net income on an after-tax basis. Take the all-stock deal (the thinnest at +2.0%) and assume BuyCo can extract $50M of annual pre-tax cost synergies:
// After-tax synergies
= Pretax_Synergies * (1 - Tax_Rate)
= 50 * 0.75             // = $37.5M

// Pro forma net income with synergies
= 620 + 37.5            // = $657.5M

// Pro forma EPS
= 657.5 / 304           // = $2.163
Accretion jumps from +2.0% to +8.1%. Synergies are frequently the difference between a dilutive headline and an accretive one - which is also why they get scrutinised heavily. A model that only "works" with aggressive, unsubstantiated synergies is a red flag, not a green light.
Breakeven Analysis: How Much Synergy Do You Need?
When a deal is dilutive, the most useful number you can produce is the breakeven synergies - the amount of pre-tax synergy required to push pro forma EPS back to the acquirer's standalone EPS.
Suppose BuyCo had to pay up: a 40% premium, or $42.00 per share.
// Offer value and P/E paid
= 42 * 60               // = $2,520M
= 2520 / 120            // = 21.0x  (above BuyCo's 20.0x -> dilutive)

// All-stock: new shares
= 2520 / 40             // = 63.0M  ->  pro forma shares = 313.0M

// Pro forma EPS before synergies
= 620 / 313             // = $1.981
Dilution = $1.981 / $2.00 − 1 = (1.0%). To break even, pro forma net income must rise to the level that restores $2.00 EPS:
// Net income needed for breakeven
= Standalone_EPS * Pro_Forma_Shares
= 2.00 * 313            // = $626.0M

// After-tax shortfall
= 626.0 - 620.0         // = $6.0M

// Pre-tax synergies required (gross up for tax)
= 6.0 / (1 - Tax_Rate)
= 6.0 / 0.75            // = $8.0M
So just $8M of pre-tax synergies flips this deal from dilutive to neutral; anything above that is accretive. Framing the answer this way ("we need only $8M of the $50M synergy plan to break even") is far more persuasive in an investment committee than a bare "the deal is 1% dilutive."
Sensitivity: Premium vs Financing Mix
A single accretion number is fragile - it moves with both the premium paid and the financing mix. Build a two-way table (all figures = accretion / (dilution) %, no synergies) to see the whole surface at once:
| Premium \ Stock % | 0% (all cash) | 50% | 100% (all stock) |
|---|---|---|---|
| 10% | +6.2% | +4.7% | +3.5% |
| 20% | +4.6% | +3.1% | +2.0% |
| 30% | +2.9% | +1.6% | +0.5% |
| 40% | +1.3% | +0.1% | (1.0%) |
Two patterns jump out. First, moving down a column (higher premium) always reduces accretion - you are paying more for the same earnings. Second, moving left across a row (more cash, less stock) always increases accretion here, because cheap after-tax debt beats issuing 20.0x-multiple equity. The all-cash column never goes dilutive in this deal, while the all-stock column tips negative once the premium pushes the P/E paid above BuyCo's own 20.0x - which happens at exactly a 33% premium ($40.00 offer, 20.0x paid). That breakeven premium is the same rule of thumb from the top of the article, now visible as the zero-crossing in the grid.
The full M&A model below lets you flex these inputs - premium, financing mix, synergies, interest rate - and watch pro forma EPS update live.
Accretive Does Not Mean Value-Creating
This is the single most important caveat, and the one most often missed. EPS accretion is an accounting outcome, not an economic one:
- A deal financed entirely with cheap debt will look accretive almost regardless of whether the target is a good business - low after-tax interest cost mechanically lifts combined EPS.
- A high-growth target acquired in stock can be dilutive in Year 1 yet create enormous value as its earnings compound - Amazon and many software roll-ups have run exactly this playbook.
- Accretion ignores the risk added to the combined entity: more leverage, integration risk, and a higher cost of equity that the EPS number never sees.
Use accretion / dilution as a communication and screening tool, not a valuation tool. For the actual go / no-go decision, lean on a DCF and the full suite of valuation methods, and remember the distinction between enterprise value and equity value when you translate an offer price into funding needs. The same pro forma debt-and-EPS mechanics also sit at the heart of an LBO model, where returns - not EPS - are the scorecard.
Common Mistakes to Avoid
- Treating accretion as value creation. The cardinal sin. An accretive deal can destroy value and a dilutive one can create it. Always pair the EPS read with a real valuation.
- Forgetting the after-tax adjustment. Interest on new debt, foregone interest on cash, and synergies all hit after tax. Modeling them pre-tax overstates the EPS impact by the full tax rate.
- Ignoring foregone interest on balance-sheet cash. If the deal is funded with existing cash rather than new debt, you still lose the interest income that cash was earning - a real cost to pro forma net income.
- Omitting incremental D&A from the write-up. Purchase accounting steps up acquired assets and intangibles, creating extra depreciation and amortisation that reduces pro forma earnings. Skipping it flatters the result.
- Pricing new shares at the wrong number. Shares issued in a stock deal are valued at the acquirer's market price, not book value or par. Using the wrong price misstates the new share count and the whole denominator.
- Double-counting or front-loading synergies. Synergies rarely arrive in full on day one. Phasing them in (and netting integration costs) keeps the Year-1 accretion honest.
- Forgetting transaction and financing fees. Advisory, financing, and other deal costs reduce earnings or equity. Leaving them out is a small but persistent source of over-optimism.

Alex Tapio
Founder of Finamodel • Professional Financial Modeller • Ex-Deloitte







