
IRR vs MOIC: Private Equity Return Metrics Explained
Key Takeaways
- MOIC measures magnitude, IRR measures speed. MOIC is total value over invested capital and ignores time; IRR is the annualized, time-weighted rate and is driven by when cash arrives.
- With no interim cash flows they imply each other: MOIC = (1 + IRR) ^ Years. The same MOIC becomes a very different IRR depending on the holding period, a 2.5x is 35.7% over three years but only 9.6% over ten.
- Timing moves IRR, not MOIC. Two deals with an identical 2.2x multiple and identical absolute profit can differ by three points of IRR purely because one returns cash earlier. This is the lever behind recaps and subscription lines.
- You cannot eat IRR. The highest-IRR deal is often not the one that creates the most wealth. Pair every IRR with its MOIC and its absolute dollar profit before ranking outcomes.
- In an LBO, both are built from the same parts: EBITDA growth, multiple expansion, and debt paydown. Deleveraging can add turns of MOIC without any rise in enterprise value.
- At the fund level, MOIC becomes TVPI, and TVPI = DPI + RVPI. A high TVPI with low DPI means the gains are still unrealized. Read the realized (DPI) and unrealized (RVPI) pieces separately.
- Report both, always. IRR for the pace of compounding and for benchmarking; MOIC for the absolute wealth created and to neutralize timing games. Neither number tells the whole story alone.
To go deeper on the discounting mechanics behind IRR, read our guide to NPV vs IRR, and to see MOIC and IRR built from a full capital structure, work through the LBO model tutorial.
IRR and MOIC are the two numbers every private equity return is judged on, and they routinely disagree. MOIC (multiple on invested capital) tells you how many times you got your money back; IRR (internal rate of return) tells you how fast it compounded. A 2.5x MOIC sounds great until you learn it took ten years, and a 40% IRR sounds spectacular until you learn it was a one-year flip that returned barely more than you put in. This guide explains exactly how the two metrics relate, why the same MOIC can produce wildly different IRRs, works through four deals side by side, and shows which metric to trust for which question.
Anyone who has sat in a private equity investment committee has watched the same argument play out: one partner points to a stellar IRR, another to a thin MOIC, and both are looking at the same deal. Neither is wrong. IRR and MOIC measure genuinely different things, and a return profile that looks brilliant on one can look ordinary on the other. Understanding the wedge between them is the single most useful thing you can learn about fund and deal performance.
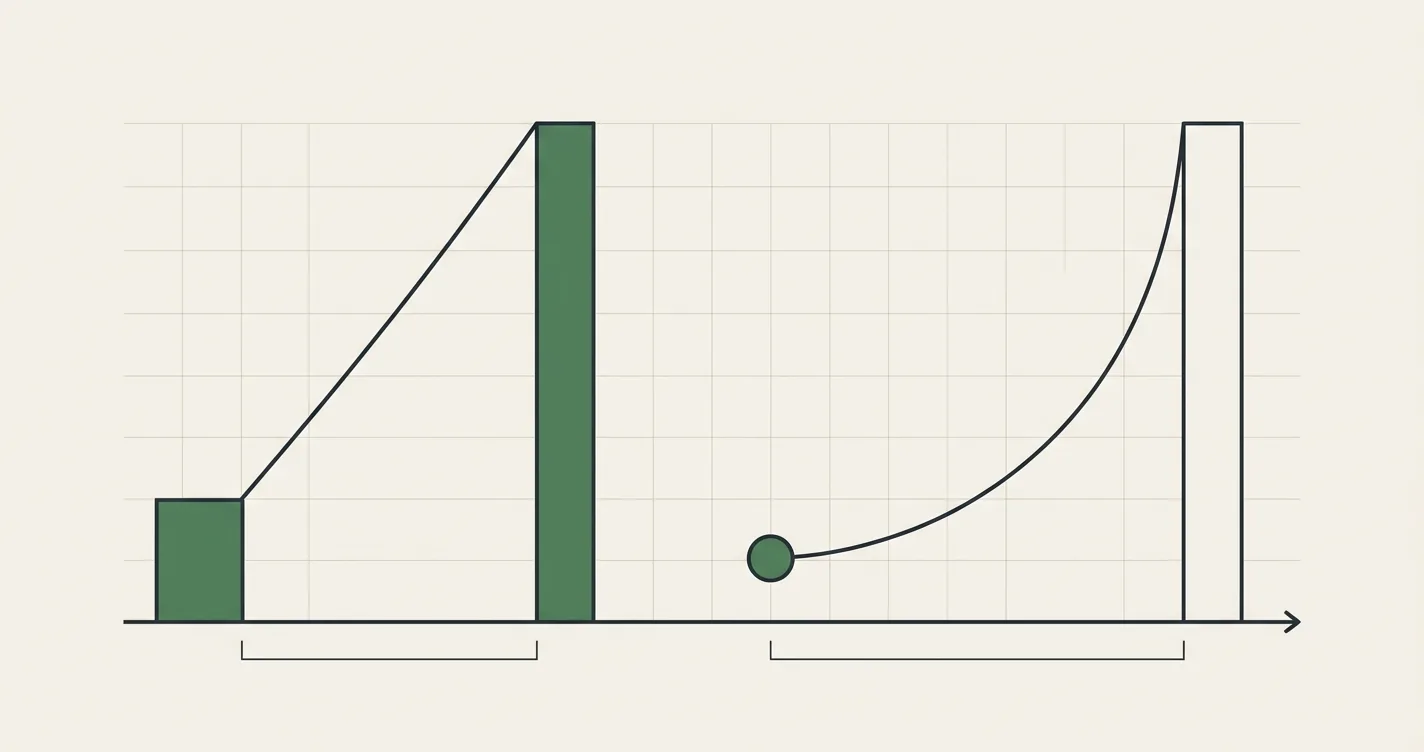
Which metric to lead with depends on the holding period and the shape of the cash flows.
The Two Metrics, Defined
MOIC (Multiple on Invested Capital)
MOIC answers a blunt question: for every dollar invested, how many dollars came back? It is also called the money multiple, MoM (multiple of money), or simply the gross multiple.
MOIC = (Total Distributions + Residual Value) / Invested Capital
If you invest $100 and eventually receive $250 in total (whether realized in cash or still sitting as unrealized value), your MOIC is 2.5x. That is the whole calculation. MOIC has no concept of time: a 2.5x earned in one year and a 2.5x earned in twenty years are the same number.
IRR (Internal Rate of Return)
IRR is the annualized, time-weighted rate of return: the single discount rate that makes the net present value of all cash flows equal to zero.
0 = Sum of [ Cash Flow_t / (1 + IRR) ^ t ]
IRR is entirely about time. It rewards getting cash back sooner and penalizes deals that make you wait. Because it solves an equation rather than a simple ratio, IRR generally has to be computed numerically (Excel's IRR or XIRR functions do this for you). For a deeper treatment of the underlying discounting mechanics, see our guide to NPV vs IRR.
The Bridge: How MOIC and IRR Relate
In the simplest case, one cash outflow at entry and one inflow at exit, with nothing in between, the two metrics are locked together by the holding period:
MOIC = (1 + IRR) ^ Years
IRR  = MOIC ^ (1 / Years) - 1
This is just compound interest. A 2.5x MOIC earned over 5 years implies an IRR of 2.5^(1/5) - 1 = 20.1%. The critical insight is that the same MOIC maps to a completely different IRR depending on how long you hold the investment.
Same MOIC, Different Hold: IRR Falls the Longer You Wait
| Holding period | MOIC | Implied IRR |
|---|---|---|
| 1 year | 2.5x | 150.0% |
| 2 years | 2.5x | 58.1% |
| 3 years | 2.5x | 35.7% |
| 5 years | 2.5x | 20.1% |
| 7 years | 2.5x | 14.0% |
| 10 years | 2.5x | 9.6% |
A 2.5x is a home run over three years and a distinctly average outcome over ten. The multiple never changed, only the clock.
Same IRR, Different Hold: MOIC Grows the Longer You Compound
Run it the other way. Hold the IRR fixed at 20% and the money multiple balloons as the hold lengthens, because you are compounding for more years.
| Holding period | IRR | Implied MOIC |
|---|---|---|
| 1 year | 20% | 1.20x |
| 3 years | 20% | 1.73x |
| 5 years | 20% | 2.49x |
| 7 years | 20% | 3.58x |
| 10 years | 20% | 6.19x |
A steady 20% compounding for ten years turns $1 into $6.19. This is why long-duration compounders can build enormous multiples at what looks like a pedestrian annual rate.
Use the calculator below to feel the relationship directly, enter an entry cash flow and a later exit and watch how the IRR moves as you stretch the timing.
Worked Example: Four Deals, One Lesson
The cleanest way to internalize the difference is to line up several deals and compute both metrics. Here are four, each starting from a $100 equity investment.
| Deal | Cash-flow profile | Hold | MOIC | IRR | Absolute profit |
|---|---|---|---|---|---|
| A - Dividend recap | -$100 at entry, +$40 in Year 2, +$180 in Year 5 | 5 yr | 2.2x | 20.0% | $120 |
| B - Back-ended exit | -$100 at entry, +$220 in Year 5 | 5 yr | 2.2x | 17.1% | $120 |
| C - Quick flip | -$100 at entry, +$140 in Year 1 | 1 yr | 1.4x | 40.0% | $40 |
| D - Compounder | -$100 at entry, +$250 in Year 5 | 5 yr | 2.5x | 20.1% | $150 |
Three lessons fall straight out of this table:
- Deal C has the highest IRR (40%) but creates the least wealth ($40). A fast, high-percentage return on a deal that barely doubles is worth less in absolute dollars than a patient compounder. As the old fund adage goes, you cannot eat IRR, and LPs ultimately spend distributions, not percentages.
- Deals A and B create identical wealth ($120) and identical MOICs (2.2x), yet A shows a higher IRR (20.0% vs 17.1%). The only difference is that A returns $40 early via a Year 2 dividend recap. Pulling cash forward lifts the annualized rate without adding a single dollar of profit.
- Deal D is the strongest all-rounder: the most absolute profit ($150), the highest MOIC (2.5x), and an IRR essentially tied with the recap deal. If you could only pick one, D is the one that actually made investors the most money.
Why Timing Moves IRR but Not MOIC
Deals A and B deserve a closer look, because the gap between them is the whole point of understanding these two metrics.
Both turn $100 into $220 over five years. MOIC only counts total dollars in versus out, so both are 2.2x, full stop. But IRR discounts every cash flow by when it arrives. Deal A hands back $40 in Year 2, and that early cash is discounted far less heavily than cash locked up until Year 5:
Deal A IRR solves:  -100 + 40 / (1 + r)^2 + 180 / (1 + r)^5 = 0
                    r = 20.0%

Deal B IRR solves:  -100 + 220 / (1 + r)^5 = 0
                    r = 2.2^(1/5) - 1 = 17.1%
Same multiple, same profit, three points of IRR conjured purely by timing. This is not a trick, it reflects the genuine time value of money: getting $40 back in Year 2 lets an LP redeploy it two years sooner. But it is exactly the lever a general partner can pull to flatter headline IRR. Dividend recaps, early partial exits, and subscription credit lines (which delay the moment LP capital is actually called) all shorten the time capital is outstanding and push IRR up while MOIC sits still. When you see a strong IRR, always check whether the MOIC moved with it or stayed flat.
MOIC and IRR in an LBO
Nowhere do these two metrics collide more than in a leveraged buyout, where debt paydown, EBITDA growth, and multiple expansion combine to build the equity return. Consider a simple LBO:
- Entry: buy a business generating $100 of EBITDA at a 10.0x multiple, so enterprise value is $1,000. Fund it with $600 of debt and $400 of equity.
- Exit (Year 5): EBITDA has grown to $150, sold again at a flat 10.0x multiple for an enterprise value of $1,500. Free cash flow has swept net debt down from $600 to $300.
The exit equity is the exit enterprise value less remaining net debt: $1,500 - $300 = $1,200. Against the $400 invested, that is a 3.0x MOIC and, over five years, a 24.6% IRR (since 3.0^(1/5) - 1 = 24.6%).
Where did the $800 of equity value creation come from? A return bridge decomposes it:
| Value-creation lever | Calculation | Contribution to equity |
|---|---|---|
| EBITDA growth | ($150 - $100) EBITDA × 10.0x entry multiple | $500 |
| Multiple expansion | (10.0x - 10.0x) × $150 exit EBITDA | $0 |
| Debt paydown (deleveraging) | $600 - $300 net debt reduction | $300 |
| Total equity value gain | $800 |
The $400 of equity grows to $1,200, and the bridge ties out: $500 from growing the business plus $300 from paying down debt equals the full $800 gain. Notice that deleveraging alone contributed a 0.75x turn of MOIC without the business becoming a dollar more valuable at the enterprise level, one of the defining features of leveraged returns. The live LBO template below lets you flex entry leverage, growth, and exit multiple and watch both the MOIC and the IRR respond.
For the full mechanics of building one of these, including the debt schedule and cash sweep that drive deleveraging, see our LBO model tutorial.
MOIC, TVPI, and DPI: The Fund-Level Cousins
MOIC is a deal-level word. At the fund level, LPs use a closely related family of ratios, all measured against paid-in capital (the money LPs have actually contributed):
- DPI (Distributions to Paid-In): cash actually returned to LPs divided by capital called. This is realized, in-your-pocket money, the fund's realized multiple.
- RVPI (Residual Value to Paid-In): the unrealized net asset value still held, divided by capital called. Gains still on paper.
- TVPI (Total Value to Paid-In): total value divided by capital called, and the direct fund-level analogue of MOIC.
They combine simply:
TVPI = DPI + RVPI
A fund reporting a 2.4x TVPI with only 0.9x DPI is telling you most of its gains are still unrealized NAV, not distributed cash. IRR and TVPI can both look excellent while DPI, the money LPs can actually spend, lags well behind. Reading all three together is how experienced allocators separate real, banked performance from marks.
The Excel Formulas
In practice you will compute these directly from a dated cash-flow line. The key functions:
' MOIC - total value over invested capital
= (SUM(Distributions) + Residual_Value) / Invested_Capital

' IRR with irregular dates - always prefer this in PE
= XIRR(cashflows, dates)

' IRR with evenly spaced annual periods
= IRR(annual_cashflows)

' Implied IRR from a MOIC and a hold (no interim cash flows)
= MOIC ^ (1 / Years) - 1

' Implied MOIC from an IRR and a hold
= (1 + IRR) ^ Years
Use XIRR rather than IRR whenever cash flows land on irregular dates, which in private markets is almost always. IRR assumes perfectly even periods and will quietly mislead you if a distribution arrives mid-year.
Common Mistakes to Avoid
- Comparing IRRs across different holding periods without MOIC. A 40% IRR over one year and a 25% IRR over six years are not directly comparable as wealth creation. Always show the multiple alongside the rate.
- Quoting gross and net figures inconsistently. Gross returns are before fees and carried interest; net is what LPs actually keep. Mixing a gross MOIC with a net IRR (or vice versa) produces a flattering but meaningless comparison. Label every figure.
- Using
IRRon irregular dates. TheIRRfunction assumes even periods. For real, dated private-equity cash flows, useXIRRor you will overstate or understate the true annualized return. - Treating the highest IRR as the best deal. A quick flip can post a huge IRR while returning trivial absolute profit. If your objective is total wealth, MOIC and absolute dollars matter more than the percentage.
- Ignoring IRR-flattering levers. Subscription credit lines and early dividend recaps can lift reported IRR without improving MOIC. When IRR jumps but the multiple does not, ask what changed in the timing.
- Forgetting IRR's reinvestment assumption. IRR implicitly assumes interim cash is reinvested at the IRR itself, which can overstate returns for very high-IRR deals. Where this matters, MIRR (modified IRR) lets you specify a realistic reinvestment rate.

Alex Tapio
Founder of Finamodel • Professional Financial Modeller • Ex-Deloitte







