
Profit Margin Formula: Gross, Operating and Net Margin Explained
Key Takeaways
- Three margins, three questions: gross margin asks about production efficiency, operating margin asks about overhead discipline, net margin asks about the bottom line after financing and tax.
- The formula is always profit / revenue - the only thing that changes between the three is how much has been subtracted from the numerator.
- Never compare margins across industries without adjusting for fundamentally different cost structures - 55% gross margin means something different for a manufacturer than for a SaaS company.
- Build margins as formulas referencing separate subtotal rows, not nested one-line calculations, so the model stays auditable and each margin can be bridged and tracked over time.
- Net margin is the most exposed to non-operating noise - leverage, one-time items, and tax strategy can all move it independently of how the business is actually performing.
For the full income statement structure these margins sit inside, see our guide to pro forma financial statements and building a 3-statement financial model.
The profit margin formula strips an income statement down to one question: how much of every revenue dollar does the business actually keep? There are three answers, not one - gross margin, operating margin, and net margin - and each removes a different layer of cost. Confusing them is one of the most common mistakes in financial analysis. This guide gives you the formula for each margin, a fully worked example that ties from revenue to net income, the Excel formulas to build it, and the mistakes that make margin comparisons misleading.
Profit margin is a ratio, not a dollar figure: profit divided by revenue, expressed as a percentage. That simplicity is exactly why it gets misused. A retailer with a 4% net margin and a software company with a 25% net margin aren't necessarily "worse" and "better" - they're different cost structures entirely. The real skill is knowing which margin to look at, what it isolates, and how to read the gap between them.
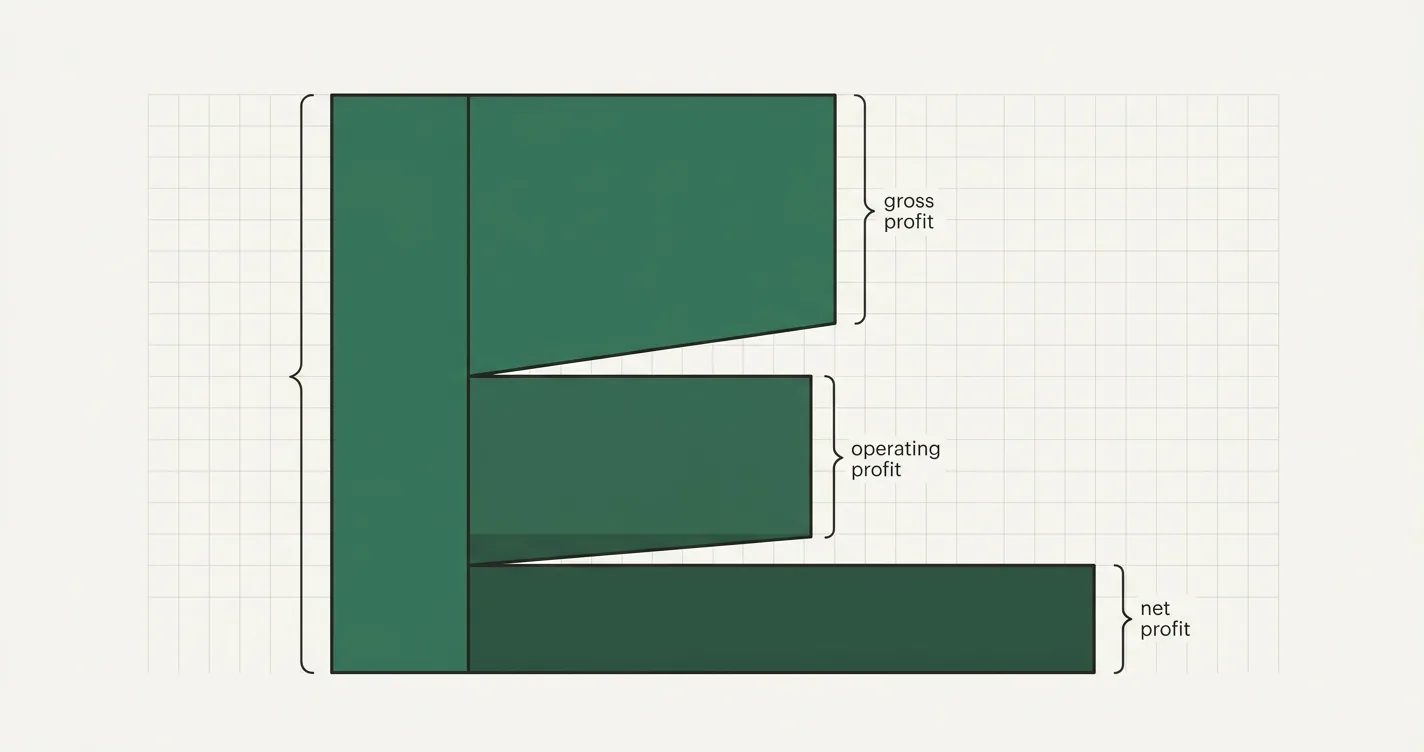
The income statement waterfall: each profit margin formula strips out one more layer of cost.
The Three Profit Margin Formulas
All three margins share the same denominator - revenue - and differ only in which costs have been subtracted from the numerator by the time you divide.
Gross Profit Margin
Gross Profit Margin = (Revenue - COGS) / Revenue
Gross margin measures what's left after the direct cost of producing or delivering what you sell (materials, direct labor, hosting costs, cost of goods sold). It says nothing about overhead, marketing, R&D, interest, or tax - it's a pure read on production and sourcing efficiency.
Operating Profit Margin
Operating Profit Margin = (Revenue - COGS - Operating Expenses) / Revenue
Operating margin (also called EBIT margin) subtracts the cost of actually running the business - sales and marketing, general and administrative costs, R&D - on top of COGS. It's the cleanest single measure of core operating profitability, because it excludes financing decisions (interest) and tax jurisdiction (tax rate), both of which are unrelated to how well the business itself performs.
Net Profit Margin
Net Profit Margin = Net Income / Revenue
Net margin is the bottom line: what's left after every cost, including interest expense and taxes. It's the number shareholders ultimately care about, but it's also the most exposed to factors that have nothing to do with operating performance - capital structure, one-time charges, and tax strategy can all move net margin without the underlying business changing at all.
Worked Example: From Revenue to Net Margin
Take a mid-size manufacturer with the following income statement for the year:
| Line Item | $ | % of Revenue |
|---|---|---|
| Revenue | $10,000,000 | 100.0% |
| Cost of Goods Sold (COGS) | $4,500,000 | 45.0% |
| Gross Profit | $5,500,000 | 55.0% |
| Sales & Marketing | $1,800,000 | 18.0% |
| General & Administrative | $1,200,000 | 12.0% |
| Operating Profit (EBIT) | $2,500,000 | 25.0% |
| Interest Expense | $300,000 | 3.0% |
| Pre-Tax Income (EBT) | $2,200,000 | 22.0% |
| Tax (25%) | $550,000 | 5.5% |
| Net Income | $1,650,000 | 16.5% |
Walking through the math:
Gross Profit = $10,000,000 - $4,500,000 = $5,500,000
Gross Margin = $5,500,000 / $10,000,000 = 55.0%

Operating Profit = $5,500,000 - $1,800,000 - $1,200,000 = $2,500,000
Operating Margin = $2,500,000 / $10,000,000 = 25.0%

Pre-Tax Income = $2,500,000 - $300,000 = $2,200,000
Tax = $2,200,000 x 25% = $550,000
Net Income = $2,200,000 - $550,000 = $1,650,000
Net Margin = $1,650,000 / $10,000,000 = 16.5%
Notice the gap between the three margins: 55.0% gross, down to 25.0% operating, down to 16.5% net. Each step removes a layer - overhead, then financing and tax - and the size of each drop tells you something different. Here, operating expenses cost the company 30 points of margin (55.0% to 25.0%), while interest and tax together cost another 8.5 points (25.0% to 16.5%). A business with heavy debt would show a much bigger drop in that last step, even with identical operations.
Building the Margins in Excel
Set up the income statement so revenue and each cost line are their own cells, and every margin is a formula, not a typed-in percentage - that's what lets the same model recalculate the moment an assumption changes.
// Gross Profit (Revenue in B3, COGS in B4)
= B3 - B4

// Gross Margin %
= (B3 - B4) / B3

// Operating Profit / EBIT (Opex in B6:B7)
= (B3 - B4) - SUM(B6:B7)

// Operating Margin %
= ((B3 - B4) - SUM(B6:B7)) / B3

// Pre-Tax Income (Interest Expense in B9)
= ((B3 - B4) - SUM(B6:B7)) - B9

// Net Income (Tax Rate in B11)
= (((B3 - B4) - SUM(B6:B7)) - B9) * (1 - B11)

// Net Margin %
= ((((B3 - B4) - SUM(B6:B7)) - B9) * (1 - B11)) / B3
Nesting the formulas like this works for a single period, but it gets unreadable fast. In a real model, break each subtotal (Gross Profit, EBIT, EBT, Net Income) into its own row so every margin is a simple division of two cells, not a formula five layers deep. That structure is also what makes it possible to bridge margin changes year over year - walking a decline in gross margin back to volume, price, mix, and cost drivers rather than just observing that it fell.
What Each Margin Actually Tells You
- Gross margin reflects pricing power and production efficiency. A falling gross margin usually means rising input costs, discounting, or an unfavorable shift in product mix - and it's the first place to look when overall profitability weakens.
- Operating margin reflects how disciplined the business is about overhead once you strip out financing and tax. Two companies with identical gross margins can have very different operating margins if one spends heavily on sales and marketing to grow faster.
- Net margin reflects everything - including decisions that have nothing to do with operations, like how much debt the company carries or a one-time legal settlement. Never use net margin alone to judge operating performance; a highly leveraged company can have excellent operations and a mediocre net margin purely because of interest expense.
Margins also vary enormously by industry, so never compare margin percentages across sectors without adjusting your expectations. Software and SaaS businesses typically run 70-85% gross margins because delivering an extra unit costs almost nothing, but low double-digit net margins once R&D and S&M are included. Grocery retailers often see 20-25% gross margins and net margins in the low single digits, because volume, not markup, drives the business. Neither is "better" - they're different economic models, and the only valid comparison is a company against its own history or its direct peers.
Common Mistakes
- Comparing margins across industries without context. A 10% net margin is mediocre for software and exceptional for a grocery chain. Always benchmark against direct peers, not a generic "good margin" number.
- Confusing markup with margin. A 50% markup on cost is not a 50% margin. If something costs $100 and sells for $150, that's a 50% markup but only a 33.3% margin ($50 / $150).
- Judging operating health from net margin alone. Net margin bakes in capital structure and tax effects that have nothing to do with how well the core business runs. Use operating margin to isolate operating performance.
- Inconsistent COGS definitions. Some companies bury freight, warehousing, or platform hosting costs in operating expenses instead of COGS, inflating gross margin relative to a company that classifies them correctly. When comparing companies, check what's actually inside COGS.
- Ignoring the trend for the snapshot. A single quarter's margin tells you less than the trend. A gross margin that's declined for four straight quarters is a much bigger flag than one quarter's dip.
- Averaging margins incorrectly across periods or segments. Averaging quarterly margin percentages is not the same as calculating the margin on total annual dollars - weight by revenue, don't just average the percentages.

Alex Tapio
Founder of Finamodel • Professional Financial Modeller • Ex-Deloitte







