
Real Estate Pro Forma: How to Build One
Key Takeaways
- NOI is the engine. Effective Gross Income minus operating expenses, calculated before debt service, depreciation, and taxes. Every dollar of durable NOI is worth roughly $1 / cap rate in value.
- The waterfall never changes. Gross rent to EGI to NOI to cash flow to returns - learn it once and you can underwrite any income property.
- Leverage cuts both ways. Debt amplifies returns when the going-in cap rate exceeds the borrowing cost (positive leverage), but a DSCR below ~1.20x signals the deal is over-levered and won't finance.
- Three returns, three questions. Cash-on-cash asks "what does it yield now?", IRR asks "what is the annualized return including the sale?", and the equity multiple asks "how much total profit?" A complete pro forma reports all three.
- The exit cap rate is the master assumption. It drives most of the IRR and is the hardest thing to forecast. Underwrite it conservatively and stress-test it.
- Sensitivity analysis is non-negotiable. Build a two-way table over exit cap and rent growth, and present your returns as a range - never a single number.
Ready to build your own? Download the free development pro forma template to get a fully-linked income, financing, and reversion model. To go deeper on valuation, see our guides to business valuation methods and building a DCF model in Excel, and run your debt coverage through the DSCR calculator.
A real estate pro forma is the projected income statement for a property - it forecasts rental income, subtracts vacancy and operating expenses to arrive at net operating income (NOI), layers in financing, and translates the cash flows into the return metrics every investor and lender cares about. This guide builds a complete property pro forma from the ground up: a worked 20-unit multifamily example, the exact Excel formulas, a downloadable model, and the sensitivity analysis that separates serious underwriting from a wish list.
A real estate pro forma ("pro forma" is Latin for "as a matter of form") is the single most important document in property investing. Whether you are buying a duplex, a 200-unit apartment complex, or underwriting a ground-up development, the pro forma is where you prove - line by line - that the deal makes money. Lenders use it to size debt, equity investors use it to decide whether to write a check, and you use it to avoid overpaying.
The structure is always the same, regardless of asset class: start with gross rent, work down to net operating income, subtract debt service, and finish with levered cash flow and returns. Master that waterfall once and you can underwrite almost any income property.
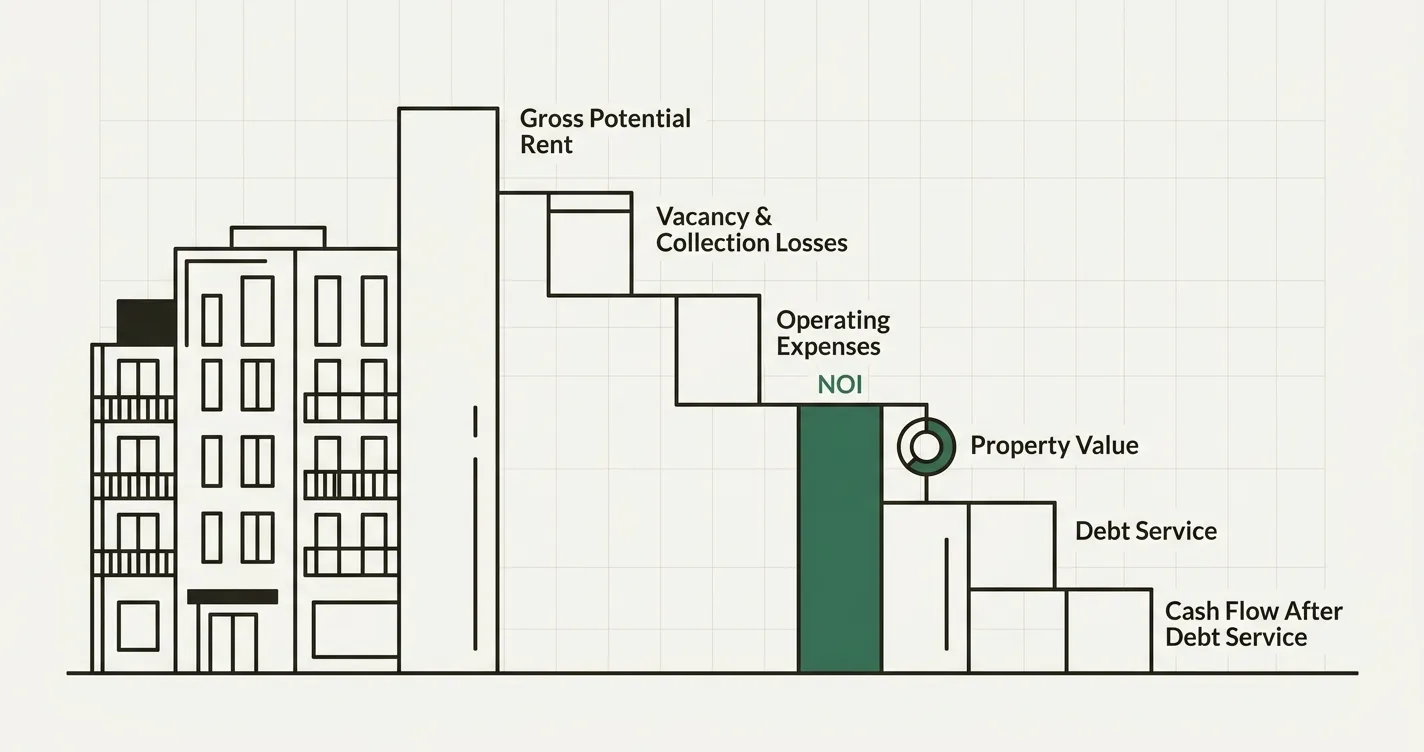
The Real Estate Pro Forma Waterfall: From Gross Rent to Cash Flow and Value
What a Real Estate Pro Forma Actually Is
A pro forma is a forward-looking projection - not a record of what happened, but a model of what will happen if your assumptions hold. A good real estate pro forma does three jobs:
- Projects cash flow. Year-by-year income and expenses, usually over a 5-10 year hold.
- Values the property. Through the cap rate (NOI / value) and the eventual sale - the "reversion."
- Measures returns. Cash-on-cash, IRR, and the equity multiple - the numbers that tell you whether the deal beats your hurdle rate.
The distinction that trips up beginners: a pro forma is not the same as the seller's "actuals." Brokers love to market a property on a pro forma NOI that assumes rents are pushed to market, vacancy magically drops, and expenses are trimmed. Always build your own pro forma from in-place numbers first, then underwrite the upside as a separate, clearly-labeled scenario.
The Structure of a Property Pro Forma
Every property pro forma follows the same vertical waterfall. Each line flows into the next:
| Line Item | What It Is | Order |
|---|---|---|
| Gross Potential Rent (GPR) | Rent at 100% occupancy, market rates | 1 |
| Less: Vacancy & Credit Loss | Empty units and uncollected rent | 2 |
| Plus: Other Income | Parking, laundry, pet fees, storage | 3 |
| Effective Gross Income (EGI) | Rent you realistically collect | 4 |
| Less: Operating Expenses | Taxes, insurance, management, repairs, reserves | 5 |
| Net Operating Income (NOI) | Pre-financing operating profit | 6 |
| Less: Annual Debt Service | Mortgage principal + interest | 7 |
| Cash Flow Before Tax (CFBT) | Levered cash to equity | 8 |
Three rules govern this stack, and breaking them is the most common modeling error in real estate:
- NOI is calculated before debt service. Financing is a function of how you fund the deal, not how the property performs. Two investors buying the same building have the same NOI but different cash flow.
- NOI excludes depreciation and income taxes. These are accounting and tax-code artifacts, not operating cash flow.
- Capital expenditures (CapEx) sit below the NOI line. A new roof or HVAC replacement is a capital item, not an operating expense - though a disciplined investor budgets a replacement reserve inside NOI to smooth for it.
Step 1: Build the Income Section
The top of the pro forma is the income build, and it has three moving parts.
Gross Potential Rent (GPR) is the rent the property would generate if every unit were occupied at market rent, all year. Vacancy & credit loss is the haircut for empty units and tenants who don't pay - budget at least 5% even in a strong market; lenders rarely accept less. Other income captures the non-rent revenue: parking, laundry, application fees, storage, and pet rent. The result is Effective Gross Income (EGI) - the cash you actually collect.
// Gross Potential Rent = units x monthly rent x 12
= Units * Monthly_Rent * 12

// Vacancy loss (negative)
= -GPR * Vacancy_Rate

// Effective Gross Income
= GPR - Vacancy_Loss + Other_Income
Worked Example: A 20-Unit Multifamily Acquisition
Throughout this guide we will underwrite a stabilized 20-unit apartment building listed at $3,000,000, with an average market rent of $1,500 per unit per month.
| Income Line | Calculation | Amount |
|---|---|---|
| Gross Potential Rent | 20 units x $1,500 x 12 | $360,000 |
| Less: Vacancy & Credit Loss (5%) | -$360,000 x 5% | -$18,000 |
| Plus: Other Income | Laundry, parking, fees | +$12,000 |
| Effective Gross Income (EGI) | $354,000 |
Step 2: Operating Expenses and NOI
Operating expenses are every recurring cost of running the building. The standard categories: property taxes, insurance, property management (usually a percentage of EGI), repairs and maintenance, utilities for common areas, administrative and marketing, and a replacement reserve for periodic capital items. What does not belong here: mortgage payments, depreciation, income taxes, and large one-off CapEx projects.
Subtracting total operating expenses from EGI gives Net Operating Income (NOI) - the property's pre-financing operating profit and the engine of the entire pro forma.
// Property management as % of EGI
= EGI * Mgmt_Fee_Rate

// Total operating expenses
= SUM(Taxes, Insurance, Management, Repairs, Utilities, Admin, Reserves)

// Net Operating Income
= EGI - Total_Operating_Expenses
Continuing the example:
| Operating Expense | Amount |
|---|---|
| Property Taxes | $42,000 |
| Insurance | $12,000 |
| Property Management (8% of EGI) | $28,320 |
| Repairs & Maintenance | $24,000 |
| Utilities (common areas) | $15,000 |
| Administrative & Marketing | $8,000 |
| Replacement Reserves ($350/unit) | $7,000 |
| Total Operating Expenses | $136,320 |
| Net Operating Income (NOI) | $217,680 |
The operating expense ratio - OpEx divided by EGI - is $136,320 / $354,000 = 38.5%. For multifamily that is a healthy, realistic figure; ratios between 35% and 50% are typical. A pro forma showing a 20% expense ratio is a red flag that something (usually reserves or management) has been left out.
Step 3: Financing and Debt Service
Most real estate is bought with leverage, and the loan terms drive both your cash flow and how much the lender will lend. The key inputs are the loan-to-value (LTV) ratio, the interest rate, and the amortization period.
For the example, assume a 70% LTV loan, a 6.5% interest rate, and a 30-year amortization:
| Financing Input | Value |
|---|---|
| Purchase Price | $3,000,000 |
| Loan Amount (70% LTV) | $2,100,000 |
| Equity (30% + 2% closing costs) | $960,000 |
| Interest Rate | 6.5% |
| Amortization | 30 years |
| Annual Debt Service | $159,300 |
The annual debt service is the mortgage payment, computed with Excel's PMT function:
// Monthly payment, then annualize
= -PMT(Rate/12, Years*12, Loan_Amount) * 12
// = -PMT(6.5%/12, 360, 2100000) * 12
// = $13,275 per month x 12 = $159,300 per year
The DSCR Test
Before a lender funds the loan, they check the Debt Service Coverage Ratio (DSCR) - how comfortably NOI covers the mortgage:
DSCR = NOI / Annual Debt Service
DSCR = $217,680 / $159,300 = 1.37x
A DSCR of 1.37x means the property generates 37% more income than it needs to pay its loan. Most conventional and multifamily lenders require a minimum of 1.20x-1.25x, so this deal clears underwriting with room to spare. Use the calculator below to test your own NOI and debt service against common lender thresholds:
Step 4: Cash Flow, Cap Rate, and Valuation
With NOI and debt service in hand, the levered cash flow falls out directly:
Cash Flow Before Tax = NOI - Annual Debt Service
Cash Flow Before Tax = $217,680 - $159,300 = $58,380
That $58,380 is the pre-tax cash the property puts in your pocket in Year 1. Divided by the equity you invested, it gives the cash-on-cash return:
Cash-on-Cash Return = CFBT / Equity Invested
Cash-on-Cash Return = $58,380 / $960,000 = 6.1%
Valuing the Property with the Cap Rate
The cap rate ties NOI to value. The going-in cap rate is Year 1 NOI divided by purchase price:
Going-In Cap Rate = NOI / Purchase Price
Going-In Cap Rate = $217,680 / $3,000,000 = 7.26%
Flip the formula and you can price any income property from its NOI and a market cap rate:
Value = NOI / Cap Rate
Value = $217,680 / 7.25% = $3,002,483
This is why NOI is the number every real estate investor obsesses over: every extra dollar of durable NOI is worth roughly $1 / cap rate in value. At a 7.25% cap, $10,000 of additional annual NOI adds about $138,000 to the property's value - the core logic behind value-add strategies.
Step 5: The Multi-Year Pro Forma and Exit
A one-year snapshot is not enough. A real estate financial model projects NOI over the full hold and models the eventual sale (the reversion). For the example, assume 3% annual rent growth, 2.5% expense growth, a 5-year hold, and an exit cap rate of 7.25% applied to forward (Year 6) NOI.
| Year | EGI | OpEx | NOI |
|---|---|---|---|
| 1 | $354,000 | $136,320 | $217,680 |
| 2 | $364,620 | $139,728 | $224,892 |
| 3 | $375,559 | $143,221 | $232,338 |
| 4 | $386,825 | $146,802 | $240,024 |
| 5 | $398,430 | $150,472 | $247,958 |
| 6 (forward) | $410,383 | $154,234 | $256,149 |
Notice NOI grows faster than rent (from $217,680 to $247,958, about 3.3% per year) because expenses grow more slowly than income - operating leverage at work.
Calculating the Exit (Reversion)
The sale price at the end of Year 5 uses the forward Year 6 NOI and the exit cap rate, then nets out selling costs and the remaining loan balance:
| Exit Calculation | Amount |
|---|---|
| Year 6 (forward) NOI | $256,149 |
| Exit Value (NOI / 7.25% exit cap) | $3,533,090 |
| Less: Selling Costs (3%) | -$105,993 |
| Less: Loan Payoff (Year 5 balance) | -$1,965,800 |
| Net Equity Reversion | $1,461,297 |
Building the full year-by-year model - NOI growth, an amortizing debt schedule, and the reversion - is exactly what a structured template handles for you. Here is a live preview of the development pro forma model used to underwrite deals like this one:
Step 6: Return Metrics
Now assemble the levered cash flows across the hold. Year 0 is your equity outflow; Years 1-4 are operating cash flow; Year 5 adds the equity reversion from the sale.
| Year | Operating CFBT | Reversion | Total Cash Flow |
|---|---|---|---|
| 0 | -$960,000 | ||
| 1 | $58,380 | $58,380 | |
| 2 | $65,592 | $65,592 | |
| 3 | $73,038 | $73,038 | |
| 4 | $80,724 | $80,724 | |
| 5 | $88,658 | $1,461,297 | $1,549,955 |
From this stream, the three headline returns:
- Internal Rate of Return (IRR): ~15.1%. The annualized return on every dollar of equity, accounting for timing. Compute it with
=IRR(range)in Excel. - Equity Multiple (MOIC): 1.90x. Total cash returned ($1,827,690) divided by equity invested ($960,000). You nearly double your money over five years.
- Average Cash-on-Cash: 7.6%. Average annual operating cash flow ($73,278) divided by equity - the current yield while you hold.
// IRR across the full cash-flow stream (Year 0 to Year 5)
= IRR(B2:B7)

// Equity multiple
= SUM(Operating_CF, Reversion) / Equity_Invested
A ~15% levered IRR with a 1.9x multiple and a 1.37x DSCR is a solid, financeable middle-market deal. Whether it clears your hurdle depends on the alternative uses of your capital - which is exactly the comparison the IRR exists to make. (For a refresher on why IRR and cash yield can tell different stories, see our guide to NPV vs IRR.)
Sensitivity Analysis
The single most dangerous number in a pro forma is the exit cap rate, closely followed by rent growth. Both are assumptions about a future you cannot control, and small changes swing the IRR dramatically. Never present a single-point return - build a two-way table.
The matrix below shows the 5-year levered IRR across exit cap rates (rows) and annual rent growth (columns). The base case - 7.25% exit cap and 3.0% rent growth - is the center cell.
| Exit Cap \ Rent Growth | 2.0% | 2.5% | 3.0% | 3.5% | 4.0% |
|---|---|---|---|---|---|
| 6.75% | 14.2% | 16.2% | 18.3% | 20.2% | 22.1% |
| 7.00% | 12.5% | 14.6% | 16.7% | 18.7% | 20.6% |
| 7.25% | 10.8% | 13.0% | 15.1% | 17.1% | 19.1% |
| 7.50% | 9.1% | 11.3% | 13.5% | 15.6% | 17.7% |
| 7.75% | 7.4% | 9.7% | 11.9% | 14.1% | 16.2% |
Three lessons jump out:
- Exit cap dominates. Moving from a 6.75% to a 7.75% exit cap - a single percentage point - cuts the base-case IRR from roughly 18% to 12%. Cap-rate expansion is the silent killer of real estate returns.
- Conservatism is cheap insurance. Assuming your exit cap is 0.25-0.50% higher than your going-in cap protects you against a softening market. Underwriting cap-rate compression (a lower exit cap) is how investors talk themselves into bad deals.
- Rent growth matters, but less. A full point of rent growth moves IRR by 2-4 points - meaningful, but a fraction of the exit-cap swing.
Common Mistakes to Avoid
- Using the broker's pro forma as your own. Marketing materials show stabilized, rents-pushed numbers. Underwrite from in-place actuals and model the upside as an explicit, separate scenario.
- Understating vacancy. A 0% or 2% vacancy assumption is fantasy. Budget at least 5%, and more for properties with high turnover or in soft submarkets.
- Forgetting reserves and CapEx. Roofs, HVAC, parking lots, and unit turns all cost money. A replacement reserve inside NOI plus a separate CapEx budget keeps the model honest.
- Putting debt service or depreciation above NOI. NOI is a pre-financing, pre-tax figure. Mixing in mortgage payments or depreciation corrupts both your cap-rate valuation and any comparison to other deals.
- Assuming cap-rate compression at exit. Hoping to sell at a lower cap rate than you bought is a bet on the market, not the asset. Default to a flat or slightly higher exit cap.
- Ignoring transaction costs. Closing costs on the buy (2-3%) and selling costs on the exit (3-6%) can quietly erase a year of cash flow. Model both.
- Reporting a single return number. A point-estimate IRR hides the risk. Always pair it with a sensitivity table over the assumptions that matter most.

Alex Tapio
Founder of Finamodel • Professional Financial Modeller • Ex-Deloitte







