CHChobani Financial Model
Hardware/Deep-tech Startup Financials (Free Excel Download)
Chobani is the US market leader in Greek yogurt; TPG invested $671M in April 2014 for a 35% stake via a structured second lien + equity deal



professionals from Deloitte
Used by professionals from






About this model
Chobani is the US Greek-yogurt market leader and was evaluated through a structured TPG investment transaction. This is a scaled consumer packaged-goods business, where product innovation, retail distribution, manufacturing capacity, and brand strength determine growth more directly than software-style customer acquisition metrics.
Its economics depend on units sold, net price, channel mix, dairy inputs, co-manufacturing or plant costs, trade spending, and working capital. The transaction context adds leverage and return considerations: value creation must be assessed through operational improvement and cash generation as well as headline revenue growth.
Build volume and pricing by product and channel, then derive revenue, gross margin, trade spend, overhead, capex, working capital, debt service, and equity returns. Stress dairy costs, retailer mix, price realisation, operating leverage, inventory, leverage, and exit multiple to evaluate the investment case.
A turnkey financial model
Live formulas, no hardcoded values
Outputs are driven by live formulas, so the workbook updates from its assumptions instead of relying on hardcoded results.
All assumptions in one tab
Inputs are clearly marked in the Assumptions tab and separated from calculations, making it clear what to change and what to leave intact.
Statements always balancing
For integrated-statement models, the balance sheet, cash flow, and supporting schedules tie through properly.
Distinct schedules for clarity
Debt, working capital, taxes, and cash flow can get messy quickly. We group calculations in clear schedules, not across disconnected tabs.
No hidden macros or external links
There are no unexplained external workbook links or macros to undermine auditability or portability.
Changes flow through the model
Update a key driver and see the impact carry through the forecast, financing, and return outputs. We never use hardcoded numbers in formulas.
About Chobani
chobani.com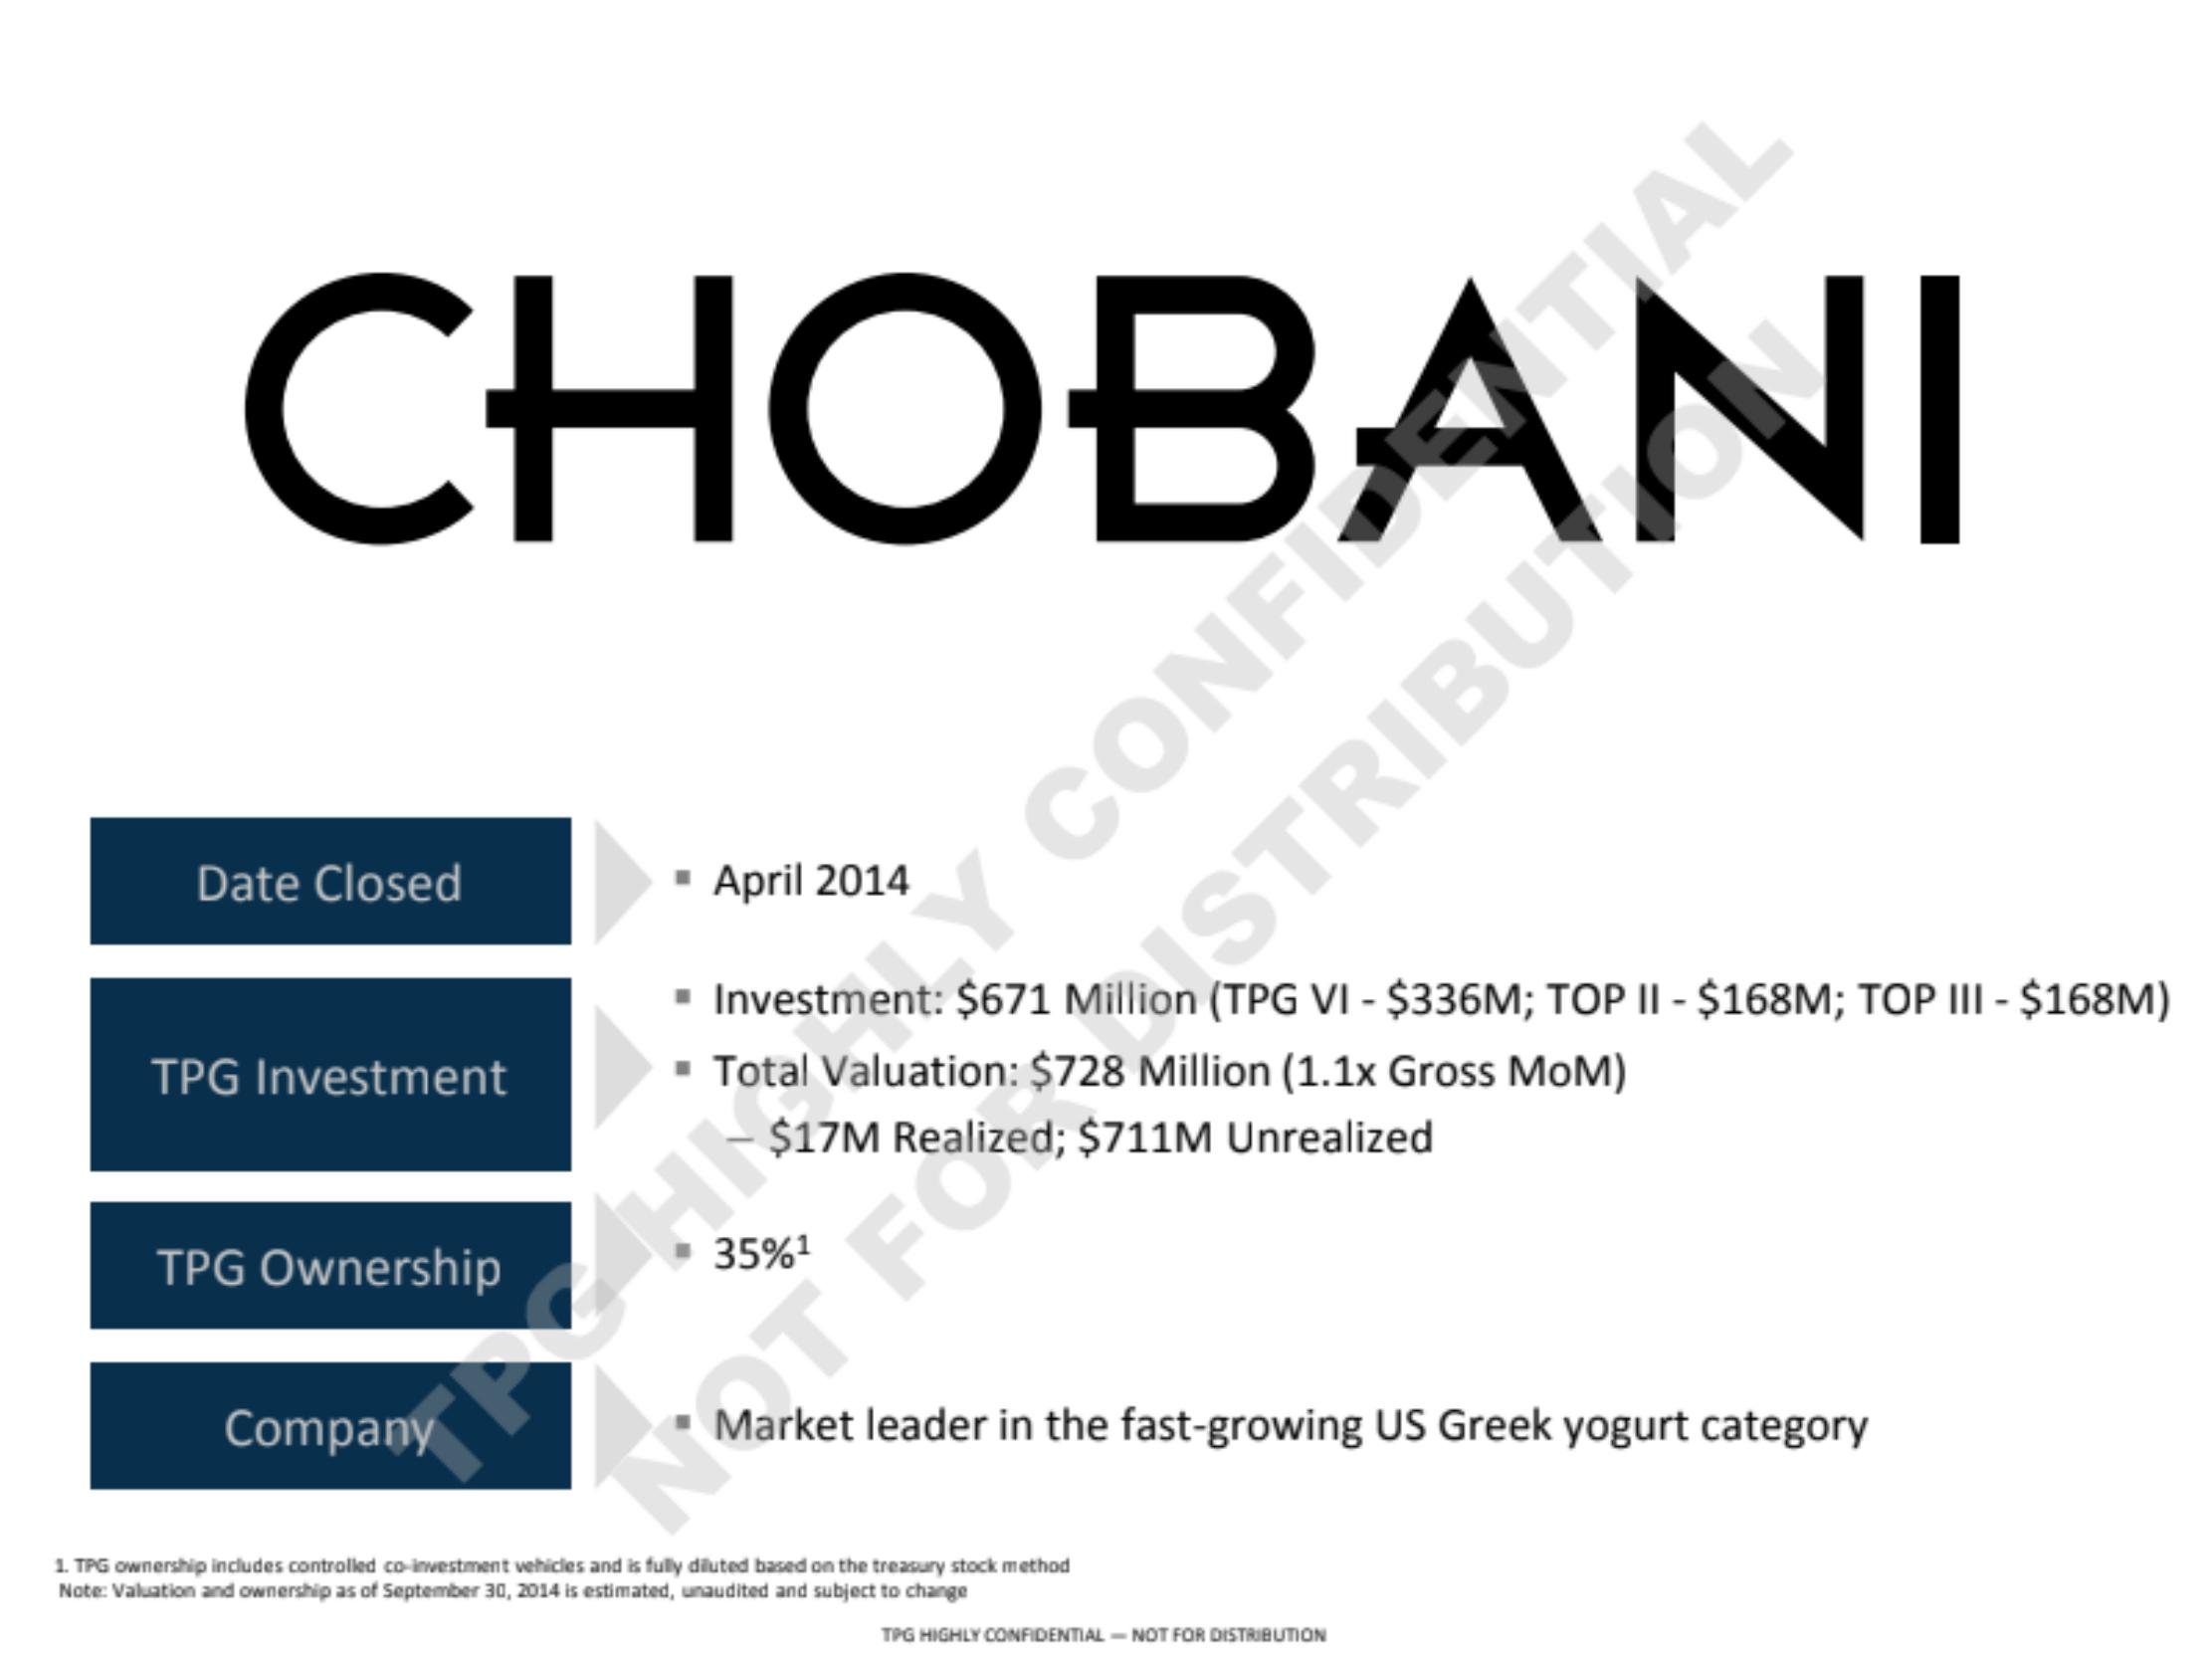
How to build a detailed financial model for Chobani
A complete walkthrough of the business, drivers, and assumptions behind the downloadable Chobani model - distilled from its pitch deck and publicly available information.
Product & value proposition
- Greek yogurt: thick/creamy, 3x milk per cup vs. traditional, more protein, fewer calories, natural ingredients
- Chobani introduced the Greek yogurt category in the US in 2007; remains market-leader with ~16–19% dollar share of total yogurt
- NPS of 28 vs. Dannon –1, Yoplait –3, Oikos 6; second only to premium niche player Fage (37)
- Highest velocity (sales per distribution point) of any yogurt brand - 14% above nearest competitor
- Strong innovation pipeline (e.g. Pumpkin Spice - fastest-selling product launch in company history; 51k cases/week at peak)
- Founded 2005 by Hamdi Ulukaya; $800K SBA loan to buy abandoned Kraft factory in NY
Market
- Total US yogurt retail spend: ~$6.5B in 2013 ($3.4B traditional + ~$3.1B Greek)
- Category CAGR 2001–2013: ~9% total yogurt; Greek yogurt subcategory CAGR far higher - grew from 2% of spend in 2007 to 48% in 2013
- Greek yogurt dollar CAGR 2009–2013: ~77%; traditional yogurt declining at –2%
- Chobani market share of total yogurt (dollar): ~16.8% as of Oct 2014, recovering from 16.3% trough in Sep 2014
- SAM/SOM not explicitly sized beyond the $6.5B US retail category; no international TAM stated
Revenue model
- Single product category: branded Greek yogurt sold in retail grocery
- Key SKU formats: 5.3oz single-serve cups, 4-pack and 8-pack multipacks, 2% and 0% fat variants, flavored (fruit-on-bottom, Flip, Limited Batch seasonal)
- Channels: major US grocery chains - Walmart (3,423 → 5,542 distribution points projected), Kroger (3,142 → 3,799), Target, Costco
- No pricing per unit disclosed; revenue from volume × price per case
- Revenue is volume-driven: production capacity at Idaho facility is the primary growth constraint (20% utilization at deal close)
- No subscription, licensing, or DTC revenue mentioned
Traction & metrics
- Revenue by year ($ millions) - annual sales chart vs. Google/Facebook for comparison:
- Year 3 after first sale (2009): $71M
- Year 4 (2010): $86M (vs. Facebook $150M, Google $244M)
- Year 5 (2011): $265M
- Year 6 (2012): $439M (vs. Facebook $550M, Google $629M)
- Year 7 (2013): $915M
- Year 8 (2014 est.): $1,000M+ (>$1B stated)
- 2013 quarterly EBITDA: Q1 $21M, Q2 $20M, Q3 –$28M, Q4 –$87M (full-year EBITDA approximately –$74M)
- 2013 quarterly net debt: Q1 $534M, Q2 $579M, Q3 $643M, Q4 $708M
- Chobani dollar share of yogurt market (Nielsen 4-wk periods):
- Jul 2013: 18.3%; trough Sep 2014: 16.3%; Oct 2014 (most recent): 16.8% - recovering
- Production - NY plant: 370M lbs actual vs. 420M lbs capacity (89% utilization)
- Production - Idaho plant: 129M lbs vs. 644M lbs capacity (20% utilization)
- Annualized spend base (1H 2014 basis): $1,352M total - breakdown: Milk $404M, Fruit $140M, Packaging $131M, Indirect Procurement $84M, Other Plant Ops $179M, Warehousing & Logistics $91M, SG&A $255M, Capex $68M
- Procurement savings: $10M saved to date; target $30M
- Total waste identified at Twin Falls: $76M (Finished Goods $33M, Raw Material $18M, Milk Yield $12M, Product Donations $13M)
- Unfulfilled orders ("cuts"): 1H 2014 avg 80k cases/week → declining to 2,446 cases in week 41
- Chobani velocity: 5,500 vs. Dannon 4,042, Yoplait 3,472, Fage 4,828, Private Label 2,582
- Total distribution points: 3,150 vs. Dannon 6,309, Yoplait 5,865 (significant distribution upside)
Unit economics
- Gross margin at deal close: <20%; target: 30%
- EBITDA margin at deal close: <5%; target: 15%
- Key COGS driver: milk is largest cost at $404M of $1,352M spend base (30% of total costs); milk price per CWT rose from $16.77 (2012) to $19.18 (2013) to $23.73 (2014 YTD)
- Competitor combined media spend (Danone/Yoplait/Fage): grew $18M → $50M → $131M (2011–2013)
- Idaho facility total capex: $530M; NY facility + Idaho = ~$1B of capex in the ground
- No CAC, LTV, or payback period disclosed (CPG brand, not DTC)
Competition / moat
- Main competitors: Dannon (parent Danone), Yoplait (General Mills), Fage, Oikos (Danone), Private Label
- Combined competitor media spend tripled 2011–2013 ($18M → $131M)
- Chobani moat: NPS #2 in category (28), highest in-store velocity, proprietary brand recognition as the Greek yogurt category creator, world's largest yogurt plant (Twin Falls, 644M lb capacity), strong innovation pipeline
- Weakness acknowledged: lower distribution points than Dannon/Yoplait; share was declining through mid-2014
Team & funding ask / use of funds
- Founder: Hamdi Ulukaya (CEO, retains controlling stake)
- TPG brings: industry/brand knowledge, ops capabilities, structuring expertise
- This is a PE deal update deck, not a fundraising deck. No new capital ask. Deal terms:
- Investment closed April 2014: $671M total (TPG VI $336M + TOP II $168M + TOP III $168M)
- Structure: TPG Second Lien Term Loan $750M + Bank First Lien Debt $405M (revolver fully drawn + $18M priority) + TPG/Founder equity (residual)
- 2nd lien terms: L+400 cash / 800 PIK interest, 6-year maturity, non-call 2
- TPG ownership: 35% fully diluted
- Use of funds: balance sheet restructuring + liquidity injection; supports Idaho facility ramp, procurement improvements, sales team build-out
Recommended financial model
- Archetype + why: PE portfolio company 3-statement operating model with leveraged capital structure / debt schedule. This is not a startup - it's a PE-owned CPG company with $1B+ revenue, complex capital structure (first lien bank debt + TPG second lien), significant operating leverage from underutilized manufacturing capacity, and a clear ops improvement thesis (margin expansion from <5% → 15% EBITDA). The model must track the debt waterfall, PIK interest accrual, and covenant headroom alongside the P&L and cash flow.
- Forecast horizon & granularity: 5-year annual model (2014–2019) with quarterly detail for Year 1 (2014) to reflect the rapid operational improvement trajectory already visible in cuts/waste/procurement data. Income statement, balance sheet, cash flow statement.
- Key drivers & assumptions:
*Revenue:*
- Volume (millions of lbs produced and sold): Idaho at 20% utilization (129M lbs) in 2013; management plan shows 372M lbs (2014) → 508M → 651M → 804M → 943M lbs by 2018. Use as base case.
- Price per lb / revenue per case: implied ~$1.08–1.12/lb based on ~$1B revenue vs. ~420M lbs NY production run-rate; refine when gross revenue is disclosed
- Market share: 16.8% Oct 2014; stabilize then recover to 18–19% as distribution expands
- Distribution point expansion: Walmart 3,423 → 5,542; Kroger 3,142 → 3,799 by Jan 2015
*COGS / Gross Margin:*
- Milk cost: $404M annualized (2014); milk price Class II $23.73/CWT as of mid-2014. normalize toward long-run average; model sensitivity to ±$3/CWT
- Fruit: $140M annualized
- Packaging: $131M annualized
- Other plant ops: $179M annualized
- Procurement savings: $10M realized; target $30M; phase in $20M incremental over 12–18 months
- Waste reduction: $76M identified at Twin Falls; 50% recoverable within 2 years
- GM% target: 30% (from <20% at deal close)
*EBITDA / Opex:*
- SG&A: $255M annualized (2014); grows with revenue but at slower pace as fixed cost leverage kicks in
- W&L (warehousing & logistics): $91M annualized
- EBITDA% target: 15% (from <5% at deal close)
*Capital structure / debt:*
- Bank first lien: $405M; LIBOR + typical first lien spread ~250bps; amortizing per credit agreement
- TPG second lien: $750M; L+400 cash / 800 PIK; 6-year maturity (2020), non-call 2
- PIK interest accrual: LIBOR ~0.25% (2014) → TPG cash coupon ~4.25%, PIK ~8%; model both on outstanding balance
- Capex: $68M annualized (2014 spend base); declining as Idaho ramp completes; maintenance capex ~$30–40M/yr long-run
- D&A: ~$80–100M/yr given $1B+ capex in ground; refine with asset base detail
*Valuation:*
- Exit comps: EV/LTM Revenue 2.7x–3.9x (transaction comps); 2.4x–4.6x (public comps)
- Implied Chobani EV range: $2.7B–$5.1B
- target exit in 4–5 years at 3.0–3.5x revenue = ~$3.5B–$4.5B EV on $1.2B projected revenue
- Scenarios (Base / Bull / Bear - which variables flex):
- Base: Idaho ramps to management plan (~372M lbs 2014 → 943M lbs 2018); GM expands to 28%; EBITDA 12–13%; milk cost normalizes; exits at 3.0x revenue
- Bull: Distribution fully recovers to prior peaks; market share back to 18.5%; procurement savings hit $30M target; EBITDA 15%; exits at 3.5x revenue
- Bear: Idaho ramp stalls (stays below 50% utilization through 2016); milk costs remain elevated; market share erodes further below 16%; EBITDA stays sub-8%; debt covenant pressure; exits at 2.5x or requires recap
- Required sheets / outputs:
- Assumptions & inputs (all drivers tagged DECK or ASSUMED)
- Income statement (annual 2014–2019, quarterly 2014)
- Balance sheet
- Cash flow statement
- Debt schedule (first lien amortization, second lien PIK accrual, interest waterfall)
- Idaho facility volume ramp tracker (lbs produced, % utilization, revenue contribution)
- Margin bridge (waterfall: actual EBITDA → target EBITDA, showing procurement savings, waste reduction, fixed cost leverage)
- Valuation / returns (EV/Revenue comps, TPG MoM / IRR at various exit years and multiples)
- Scenario toggle (3 scenarios on key variables)
Frequently asked
Is the Chobani financial model free?+
Yes. The Chobani model is a free Excel (.xlsx) download with live formulas. Sign up with your email and the workbook is yours to keep, review, and edit.
What's included in the model?+
A 5-year monthly forecast with P&L, cash flow and runway, valuation (exit multiple plus a DCF cross-check), MOIC/IRR returns, and unit economics, with live formulas throughout.
How was this model built?+
It was built from Chobani's pitch deck and publicly available information, then structured to investment-banking standards as a fully editable Excel model.
Can I change the assumptions?+
Yes. You can change assumptions and the live formulas will recalculate in the downloadable Excel model.
Have more financial modelling questions? Contact us

Created by ex-finance professionals
Hey, I’m Alex and I created Finamodel.
Over my years in the finance industry I kept building the same models over and over again. Same structure, same assumptions, different logo. So I started building frameworks to turn them into clean, reusable templates.
Every model here is one I’d actually use for a client, and I personally vet each one before it goes up.
I’m not an expert in every industry, but I’ve built enough models to know what belongs in one. And when something is completely foreign to me, I reach out to my network for experts to work on our models with us.
Having a template library on hand cuts a first build from hours to minutes.
Need help finding your model? You’ll find me in the Finamodel app!
Other Hardware/Deep-tech Startup Financial Models
Browse another startup in the same category.

ANYbotics
ANYbotics builds and sells autonomous legged inspection robots (ANYmal) for industrial facilities, targeting oil & gas, chemicals, power, offshore, mining, and manufacturing sectors.
Awake Security
Awake Security - AI-driven Network Detection & Response (NDR) platform for the hybrid cloud, positioning as the "intent detection" layer of the SOC visibility triad.

Beem
AR communications platform that overlays full-body "hologram" video of a person into the recipient's physical space via smartphone or web.

Blue White Robotics
Autonomous robotics platform converting existing farm equipment to self-driving tractors for permanent-crop growers, sold as Robots-as-a-Service.

Cambridge GaN Devices
Fabless semiconductor startup commercialising self-protected GaN power transistors (HiGaN) that replace silicon and standard GaN with higher efficiency and no external protection circuitry.

Canix
Cannabis-focused ERP (inventory tracking, compliance automation, sales management, yield forecasting) sold as SaaS to cannabis cultivators, manufacturers, and distributors.
Cipher Skin
Wearable sensor mesh platform that collects dense multi-modal data from human bodies and industrial objects to predict structural and functional failure before it occurs.

Citylitics
B2B SaaS intelligence platform that aggregates and curates public-sector infrastructure procurement data for private-sector vendors, suppliers, and consultants.


