 Chronicle Financial Model
Enterprise/Security Startup Financials (Free Excel Download)
Chronicle is a modern, interactive presentation tool designed to replace static slides with a faster, mobile-first format for teams.



professionals from Deloitte






About this model
Chronicle is an interactive presentation product built for a faster, mobile-first way of sharing ideas. It is positioned as an alternative to static slide decks, helping teams create and distribute more engaging presentations.
The company follows a product-led SaaS motion, with individual use encouraging broader team and enterprise adoption. Shared presentations can create a viral acquisition loop, while larger accounts offer a land-and-expand opportunity beyond the initial creator.
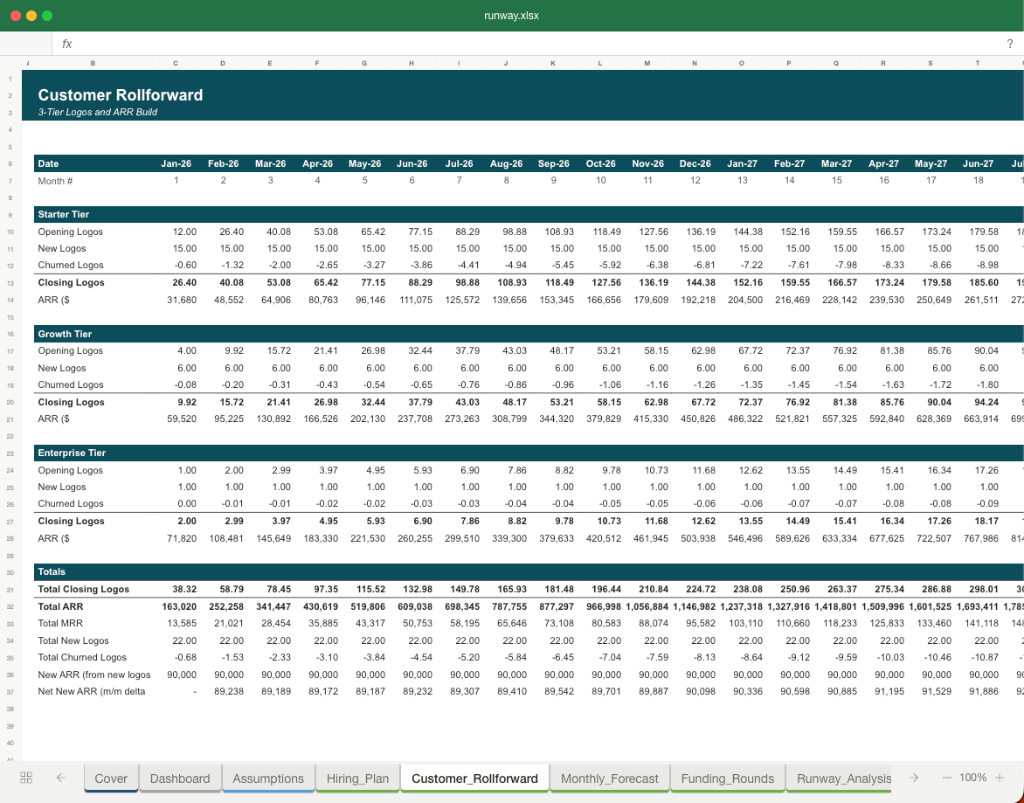
The model combines seat-based ARR with a PLG growth layer. It tracks seed users, activation, shared-presentation virality, conversion to paid teams, expansion within accounts, and churn, then connects those cohorts to customer-acquisition spend, gross margin, headcount, and cash.
A turnkey financial model
Live formulas, no hardcoded values
Outputs are driven by live formulas, so the workbook updates from its assumptions instead of relying on hardcoded results.
All assumptions in one tab
Inputs are clearly marked in the Assumptions tab and separated from calculations, making it clear what to change and what to leave intact.
Statements always balancing
For integrated-statement models, the balance sheet, cash flow, and supporting schedules tie through properly.
Distinct schedules for clarity
Debt, working capital, taxes, and cash flow can get messy quickly. We group calculations in clear schedules, not across disconnected tabs.
No hidden macros or external links
There are no unexplained external workbook links or macros to undermine auditability or portability.
Changes flow through the model
Update a key driver and see the impact carry through the forecast, financing, and return outputs. We never use hardcoded numbers in formulas.
About Chronicle
chroniclehq.com
How to build a detailed financial model for Chronicle
A complete walkthrough of the business, drivers, and assumptions behind the downloadable Chronicle model - distilled from its pitch deck and publicly available information.
Product & value proposition
- Web-based presentation builder eliminating pixel-level design choices through pre-designed blocks and templates.
- Interactive, mobile-first output format - not static slides.
- Core claims: 50x faster to create than PowerPoint/Keynote/Canva; top 5% output quality.
- Key features: pre-designed blocks, use-case templates (pitch decks, all-hands, competitor case studies), real-time collaboration, embeds/integrations with 100+ tools.
- Built-in "made with Chronicle" watermark on presentations drives product-led viral distribution.
Traction & metrics
All metrics are beta/early-stage qualitative signals - no revenue, ARR, or customer count disclosed.
- "50x faster and convenient compared to existing solutions"
- "Output quality among top 5% across all the decks produced"
- "4-5 additional users for each onboarded user" (viral coefficient)
- PLG loop beta data: each activation yields +2-3 additional use cases; each presentation shared yields +2-3 new users; each new user brings +4-6 more users - all asterisked as "based on preliminary beta testing"
- Named beta customers/testimonials: Google (PMM), Cecil (Founder), Chefprep (PM) - no revenue or contract values attached.
- Note: the funnel numbers on slide 4 (73 leads, 36 qualified, 25 intros, 16 discovery, 12 demos) are a sample dataset shown inside the Chronicle product UI, not Chronicle's own sales pipeline.
Competition / moat
Competitive landscape positioned on two axes: Quality vs. Convenience.
- Direct competitors named: Figma, Canva, Pitch, Pitch.com, Gamma.app, Tome (beta.tome.app), PowerPoint, Google Slides, Keynote, Miro, Notion.
- Chronicle claims top-right positioning (high quality + high convenience).
- Moat claims: no pixel-level design choices (vs. Figma/Canva), interactive format (vs. static-slide tools like Canva/Pitch), purpose-built for storytelling (vs. doc-style tools like Notion/Miro).
Team & funding ask / use of funds
- Mayuresh Patole - Product / Design; BCG Digital Ventures, 20+ startup experience, presentation design trainer.
- Tejas Gawande - Customer / Growth; Monitor Deloitte, Doblin (Deloitte design-thinking), APAC luxury retail e-commerce scaling (10 countries, 100+ stores).
- Backed by Accel; angels from Apple, Stripe, Slack, Twitch, Facebook, Google, Superhuman, Lattice, Intercom, InVision.
Recommended financial model
- Archetype + why: SaaS ARR / seat-based subscription with PLG viral growth layer. Chronicle is a B2B SaaS tool with per-seat or per-team pricing (most likely), a product-led growth engine with a measurable viral coefficient, and an enterprise land-and-expand motion. A PLG-SaaS model captures the key dynamics: seed users per account, expansion to additional use cases, and viral new-user acquisition from shared presentations.
- Forecast horizon & granularity: 3 years (Year 1–3), monthly for Year 1, quarterly for Years 2–3. Pre-revenue stage warrants granular near-term cash planning.
- Key drivers & assumptions:
| Driver | Value |
|---|---|
| Initial seed accounts (beta → paid) | 5–10 |
| Average seats per initial account | 3–5 |
| Viral coefficient (new users per onboarded user) | 4–5x |
| Use-case expansion per activated user | 2–3 additional use cases |
| User-to-user sharing yield | 2–3 new users per presentation shared |
| Monthly pricing (per seat) | $15–25/seat/month |
| Gross margin | 70–80% |
| CAC (paid/assisted) | $0 initially (PLG), rising |
| Monthly churn (account level) | 3–5% |
| Headcount growth | 2 FTE now; +2–3 hires in Year 1 |
| Monthly burn | $30–60k |
- Scenarios (Base / Bull / Bear - which variables flex):
- Flex variables: viral coefficient, monthly churn, paid conversion rate from freemium (if any), seat expansion per account, time-to-monetisation.
- Bear: viral loop underperforms (k < 1), churn 7%+, conversion to paid slow - flat user growth.
- Base: viral coefficient holds at ~4x (per deck), moderate churn 3–4%, 12-month ramp to $500k ARR.
- Bull: enterprise deals materialise early (Accel network effect), 10+ seat accounts, viral coefficient sustains - $1–2M ARR by end of Year 2.
- Required sheets / outputs:
- Assumptions - all drivers in one place, toggle for scenarios.
- PLG Growth Model - seed accounts → viral new users → MoM user cohorts.
- Revenue - ARR build (new ARR, expansion ARR, churned ARR, net new ARR), MRR waterfall.
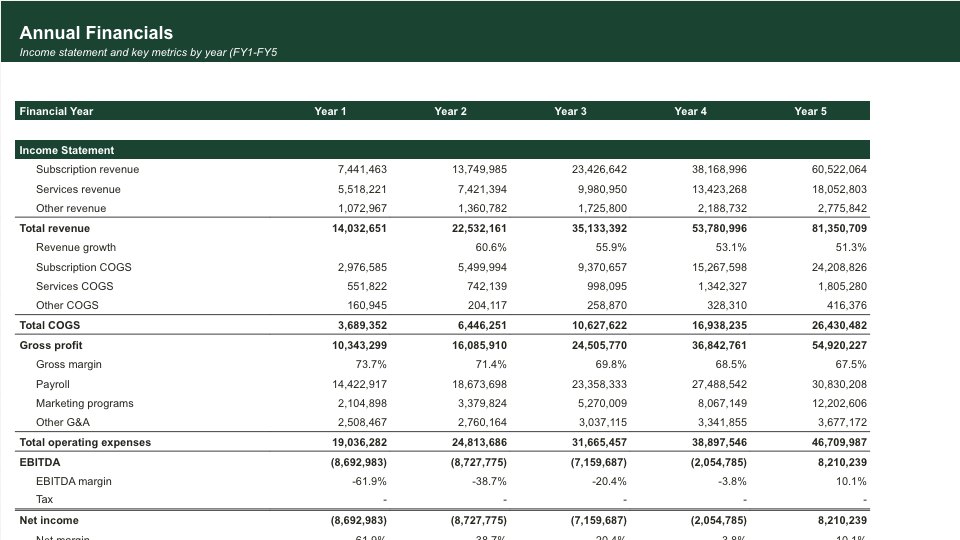
- P&L - Revenue, COGS (hosting), Gross Profit, OpEx (headcount, marketing, infra), EBITDA.
- Headcount plan - by function (product, eng, growth, ops).
- Cash & Runway - monthly burn, cash balance, runway in months.
- Dashboard - KPI summary: ARR, MRR, viral k-factor, churn, runway.
Frequently asked
Is the Chronicle financial model free?+
Yes. The Chronicle model is a free Excel (.xlsx) download with live formulas. Sign up with your email and the workbook is yours to keep, review, and edit.
What's included in the model?+
A 5-year monthly forecast with P&L, cash flow and runway, valuation (exit multiple plus a DCF cross-check), MOIC/IRR returns, and unit economics, with live formulas throughout.
How was this model built?+
It was built from Chronicle's pitch deck and publicly available information, then structured to investment-banking standards as a fully editable Excel model.
Can I change the assumptions?+
Yes. You can change assumptions and the live formulas will recalculate in the downloadable Excel model.
Have more financial modelling questions? Contact us

Created by ex-finance professionals
Hey, I’m Alex and I created Finamodel.
Over my years in the finance industry I kept building the same models over and over again. Same structure, same assumptions, different logo. So I started building frameworks to turn them into clean, reusable templates.
Every model here is one I’d actually use for a client, and I personally vet each one before it goes up.
I’m not an expert in every industry, but I’ve built enough models to know what belongs in one. And when something is completely foreign to me, I reach out to my network for experts to work on our models with us.
Having a template library on hand cuts a first build from hours to minutes.
Other Enterprise/Security Startup Financial Models
Browse another startup in the same category.
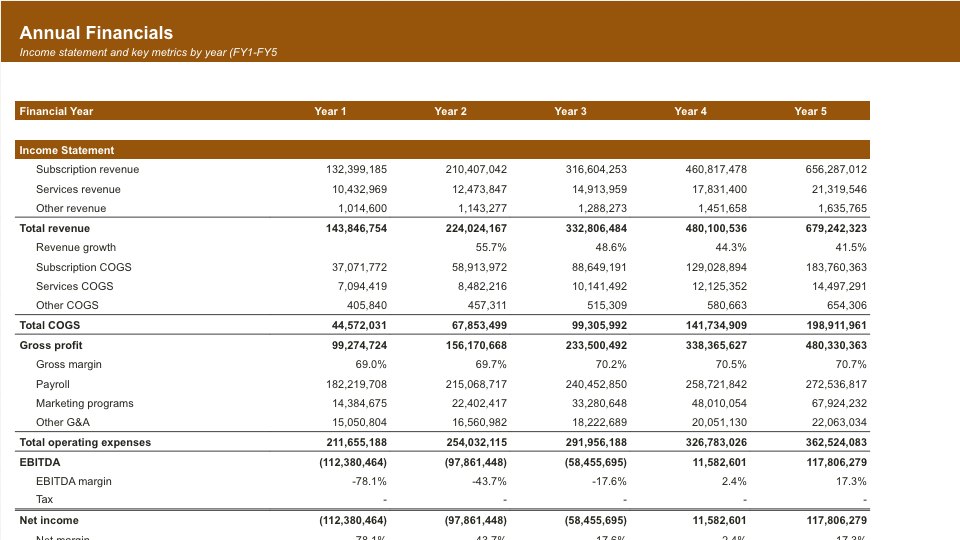
AgBiome
AgBiome is a microbial-platform agtech company that discovers, develops, and commercialises biological crop protection products (and licences the platform across adjacent markets).

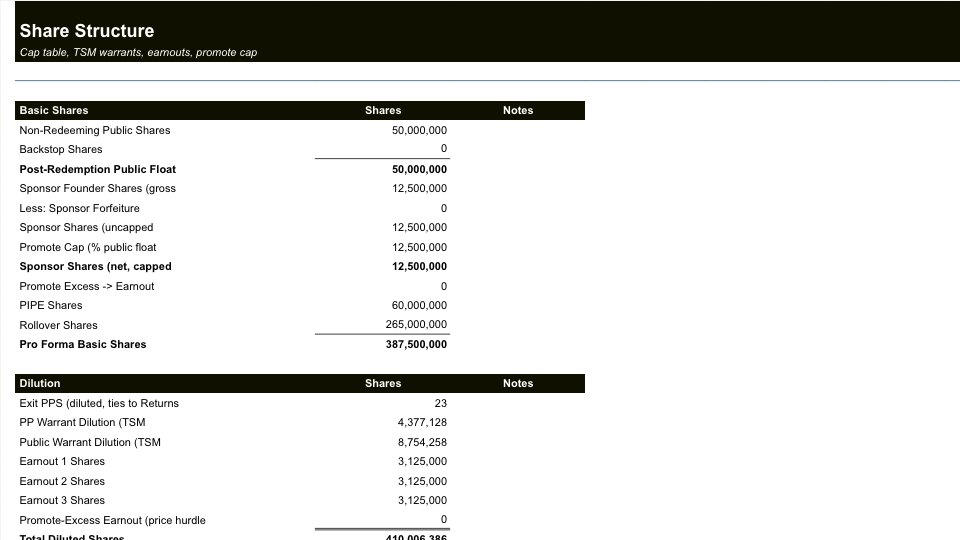
Alation
Enterprise data intelligence platform - data catalog, governance, and metadata management for large organisations.

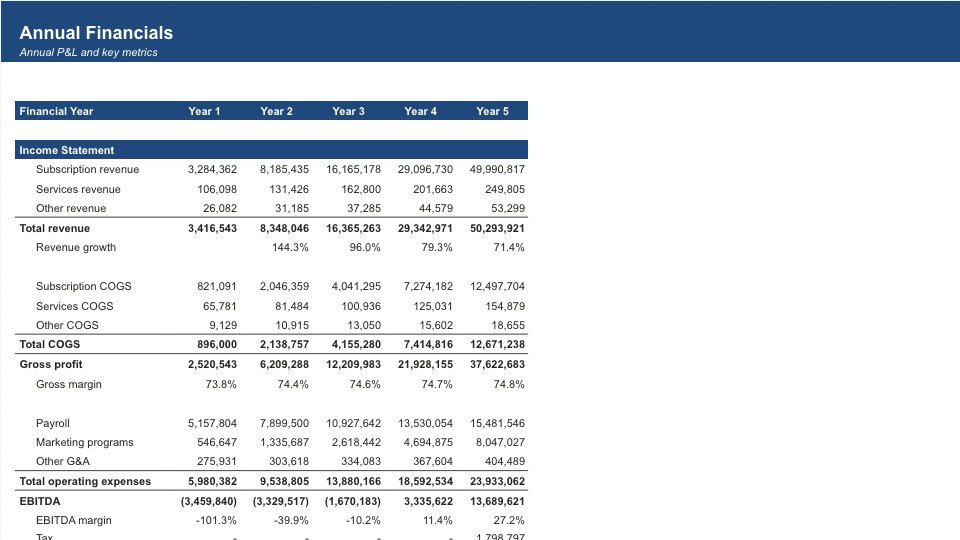
Archer SPAC
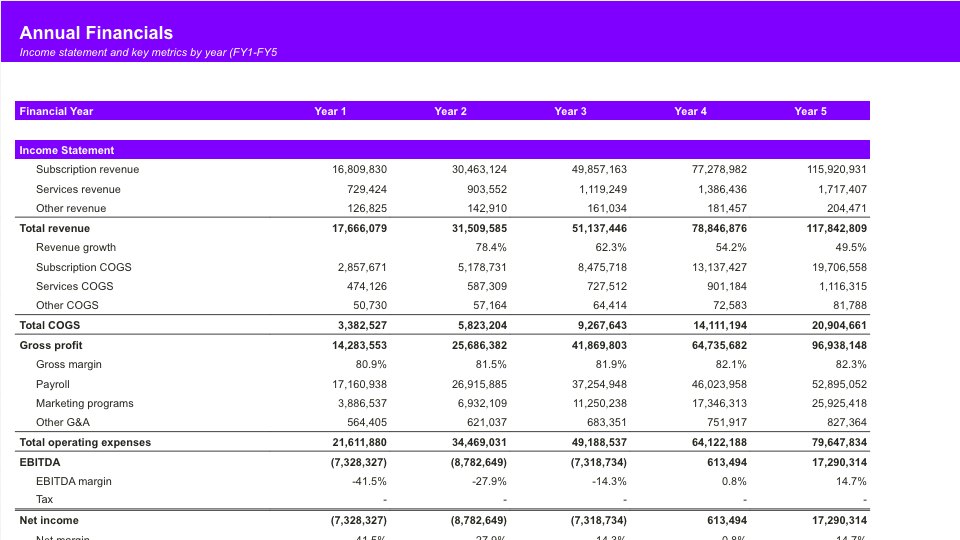
Archera
Cloud resource automation platform that continuously optimizes AWS commitment purchases, de-risks overcommitment, and automates FinOps workflows.

Ardoq
Cloud-native Enterprise Architecture (EA) SaaS platform that helps large enterprises navigate digital transformation through automated data collection, graph-based architecture modelling, and change impact analysis.

Ascend
Ascend.io is an enterprise big data automation platform ("Enterprise Intelligence Platform") that abstracts away the complexity of big data engineering so non-experts can build and run data pipelines.

Athennian
Cloud-based legal entity management system (EMS) uniting entity data with workflow and document automation.

Auditboard
Cloud-based integrated risk management platform connecting audit, risk, compliance, and ESG teams across the enterprise.