WAWaze Financial Model
Enterprise/Security Startup Financials (Free Excel Download)
Waze is a GPS navigation app that sells location-based advertising to brands seeking to reach on-the-go drivers.



professionals from Deloitte
Used by professionals from






About this model
Waze is a GPS navigation app that sells location-based advertising to brands seeking to reach drivers while they are on the move. Its advertiser proposition is based on driver reach, location context, and the ability to engage consumers during a journey.
This is a post-acquisition advertising sales case, not a startup fundraise: Google acquired Waze in 2013. Commercial performance therefore depends on advertiser demand, active drivers, available ad inventory, engagement, and the wider Google advertising ecosystem, with the available metrics scoped to the US.
The model is a media P&L built from active drivers, ad impressions, fill rate, engagement, CPM or campaign pricing, and advertiser retention. Sales costs, platform operations, and contribution margin show the economics of the advertising business unit.
A turnkey financial model
Live formulas, no hardcoded values
Outputs are driven by live formulas, so the workbook updates from its assumptions instead of relying on hardcoded results.
All assumptions in one tab
Inputs are clearly marked in the Assumptions tab and separated from calculations, making it clear what to change and what to leave intact.
Statements always balancing
For integrated-statement models, the balance sheet, cash flow, and supporting schedules tie through properly.
Distinct schedules for clarity
Debt, working capital, taxes, and cash flow can get messy quickly. We group calculations in clear schedules, not across disconnected tabs.
No hidden macros or external links
There are no unexplained external workbook links or macros to undermine auditability or portability.
Changes flow through the model
Update a key driver and see the impact carry through the forecast, financing, and return outputs. We never use hardcoded numbers in formulas.
About Waze
waze.com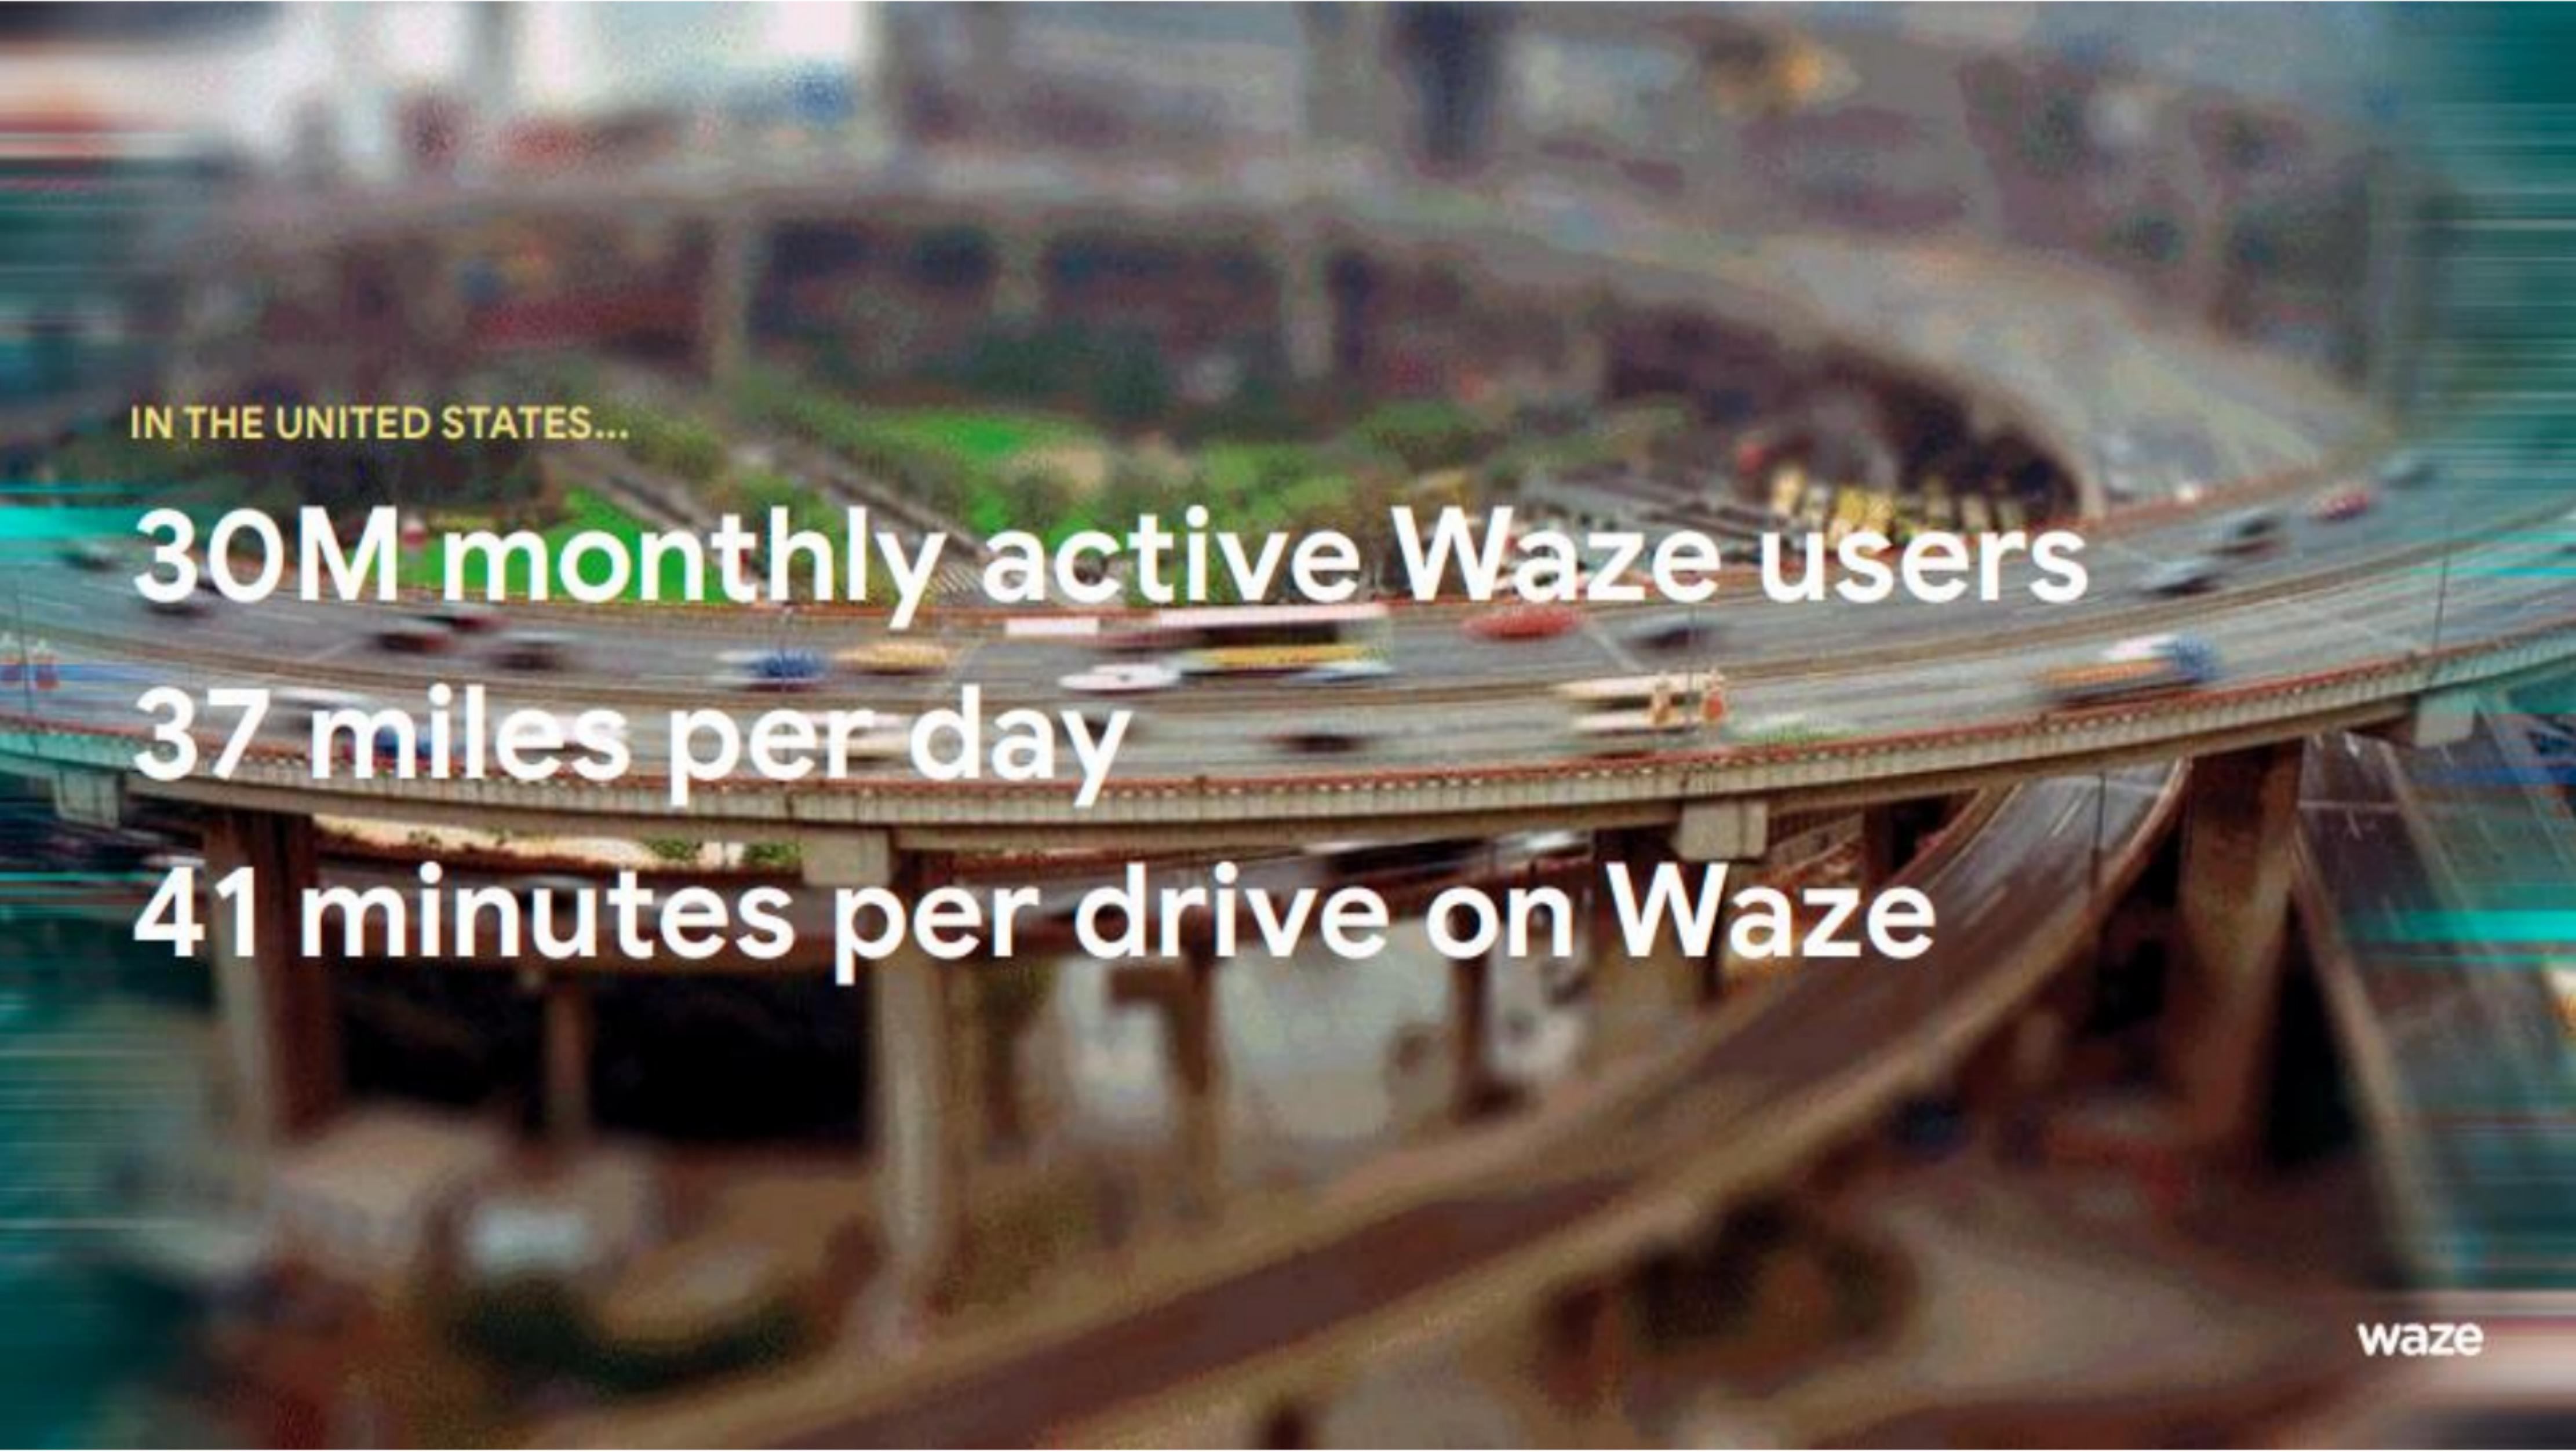
How to build a detailed financial model for Waze
A complete walkthrough of the business, drivers, and assumptions behind the downloadable Waze model - distilled from its pitch deck and publicly available information.
Product & value proposition
Waze is a community-based GPS navigation app with 30M monthly active users (US). It provides brands with access to an in-car advertising channel, positioned as the missing piece in the Google Ads ecosystem alongside Search, Display, Shopping, Maps, and Video.
Key value props for advertisers:
- Proprietary location intelligence: destination, proximity to store, frequency of visits (loyalty), stops and stop length, routes and travel patterns, search intent, demographics/emotional context.
- Drive-based targeting: day parting, home & work targeting, weather, road tripper, destination.
- Ad formats: Pins (location awareness), Zero-Speed Takeovers (messaging when driver stopped 4+ seconds), Search (high-intent navigation), Push Notification Reminders (Save For Later CTA).
- OOH amplification: 3x navigation lift when a driver is exposed to both OOH billboard and Waze ad.
Market
Context from deck: Waze positions itself within the Out-of-Home (OOH) advertising market as a "Digital OOH" complement, with use cases including competitor analysis, last-mile insights, and dwell time measurement. No market size figures provided.
Revenue model
- Advertising revenue from brands buying in-app ad placements (Pins, Zero-Speed Takeovers, Search ads, Push Notifications).
- Revenue is tied to Google Ads ecosystem - deck frames Waze as completing Google's ad suite.
- Pricing model (CPM, CPC, CPV) not disclosed in deck.
- OOH + Waze bundled sales appear to be a partnership/channel pitch to OOH buyers and advertisers.
Traction & metrics
- 30M monthly active users in the United States
- 37 miles driven per day per user (US)
- 41 minutes per drive on Waze (US)
- 3x navigation lift when a driver is exposed to both OOH and Waze advertising
- Average time someone looks at a billboard is ~3 seconds
- Speed gauge shown at 55–56 MPH as dwell time reference
No revenue, growth rate, customer count (advertiser-side), or retention figures in deck.
Competition / moat
Not explicitly stated. Implied moats:
- Proprietary navigation data (destination, route, frequency, dwell time) not available to other ad platforms.
- Part of Google ecosystem - access to Google Ads buying infrastructure.
- Real-time in-car context at the moment of purchase decision ("unlike other ad platforms, Waze interacts directly with consumers while they are on-the-go").
No competitive landscape slide.
Recommended financial model
- Archetype + why: This is not a startup fundraising deck - it is a post-acquisition B2B advertising sales deck (Waze, acquired by Google in 2013, pitching advertisers and OOH partners). If the goal is to model Waze as an advertising business unit, the appropriate model is a digital advertising revenue model (impression/engagement-based P&L). If this is part of a broader exercise, the context calls for a media/advertising P&L rather than a startup operating forecast.
- Forecast horizon & granularity: 3 years, quarterly. Advertising businesses track seasonality (Q4 holiday spend spikes); quarterly granularity is appropriate.
- Key drivers & assumptions:
- US MAU: 30M; flat to modest growth ~5% YoY (mature US market, post-acquisition saturation).
- Average daily drive time per user: 41 minutes.
- Ad inventory per drive: ~1–3 ad impressions per session (Pins + Takeover when stopped); conservative fill given Zero-Speed Takeover requires 4+ second stop.
- CPM / eCPM: $8–$15 CPM (premium vs. standard mobile display, given location context; benchmark: geo-targeted mobile OOH-adjacent inventory); no pricing in deck.
- Fill rate: 50–70% (ad-supported navigation app; not all drives monetized).
- Revenue per MAU per month: derived from MAU × sessions/month × ad frequency × eCPM / 1000.
- OOH partnership revenue share: ancillary; no data in deck to size.
- COGS (infrastructure, maps data licensing): 20–30% of revenue (navigation data, server costs).
- S&M (advertiser sales team, partner development): 25–35% of revenue.
- Scenarios (Base / Bull / Bear - which variables flex):
- Bear: MAU flat, CPM at $8, fill rate 50% → low monetization per user.
- Base: MAU +5% YoY, CPM at $11, fill rate 60%.
- Bull: MAU +10% YoY (new feature adoption, international expansion), CPM at $15, fill rate 70%, OOH bundled revenue adds 10–15% uplift.
- Required sheets / outputs:
- Assumptions sheet (MAU, sessions/month, CPM, fill rate, growth rates)
- Revenue build (MAU → impressions → revenue)
- P&L (revenue, COGS, gross profit, S&M, G&A, EBITDA)
- Dashboard (MAU, revenue/MAU, CPM, gross margin, EBITDA margin)
Frequently asked
Is the Waze financial model free?+
Yes. The Waze model is a free Excel (.xlsx) download with live formulas. Sign up with your email and the workbook is yours to keep, review, and edit.
What's included in the model?+
A 5-year monthly forecast with P&L, cash flow and runway, valuation (exit multiple plus a DCF cross-check), MOIC/IRR returns, and unit economics, with live formulas throughout.
How was this model built?+
It was built from Waze's pitch deck and publicly available information, then structured to investment-banking standards as a fully editable Excel model.
Can I change the assumptions?+
Yes. You can change assumptions and the live formulas will recalculate in the downloadable Excel model.
Have more financial modelling questions? Contact us

Created by ex-finance professionals
Hey, I’m Alex and I created Finamodel.
Over my years in the finance industry I kept building the same models over and over again. Same structure, same assumptions, different logo. So I started building frameworks to turn them into clean, reusable templates.
Every model here is one I’d actually use for a client, and I personally vet each one before it goes up.
I’m not an expert in every industry, but I’ve built enough models to know what belongs in one. And when something is completely foreign to me, I reach out to my network for experts to work on our models with us.
Having a template library on hand cuts a first build from hours to minutes.
Need help finding your model? You’ll find me in the Finamodel app!
Other Enterprise/Security Startup Financial Models
Browse another startup in the same category.
AgBiome
AgBiome is a microbial-platform agtech company that discovers, develops, and commercialises biological crop protection products (and licences the platform across adjacent markets).

Alation
Enterprise data intelligence platform - data catalog, governance, and metadata management for large organisations.

Archer SPAC
Archera
Cloud resource automation platform that continuously optimizes AWS commitment purchases, de-risks overcommitment, and automates FinOps workflows.

Ardoq
Cloud-native Enterprise Architecture (EA) SaaS platform that helps large enterprises navigate digital transformation through automated data collection, graph-based architecture modelling, and change impact analysis.

Ascend
Ascend.io is an enterprise big data automation platform ("Enterprise Intelligence Platform") that abstracts away the complexity of big data engineering so non-experts can build and run data pipelines.

Athennian
Cloud-based legal entity management system (EMS) uniting entity data with workflow and document automation.

Auditboard
Cloud-based integrated risk management platform connecting audit, risk, compliance, and ESG teams across the enterprise.


