AI Inference COGS Model
Tech & Software Financial Model (Free Excel Download)
A twelve-quarter cost-of-revenue and gross margin model for an AI inference platform that sells tokens and rents accelerator hours, built so that cost of revenue is never a percentage of revenue anywhere. Three model tiers - a commodity small model, a mid tier and a frontier model - are priced and served separately because they sit fifty times apart on price per million tokens and twenty times apart on throughput per accelerator. Prompt caching and a free evaluation tier convert billable tokens into compute tokens; a throughput that improves every quarter converts compute tokens into accelerator hours; a utilisation target converts hours into required capacity; and a reservation sized on last quarter demand converts capacity into dollars, short in the early quarters and long in the later ones. Because cost per million tokens is identically cost per compute hour divided by tokens per compute hour, the cost curve factors exactly into an accelerator rate index, a capacity premium index and a throughput index, and a gross profit bridge closes on volume, price and unit cost with no residual. Built so an operator, a CFO or an investor can flex one driver and watch margin, fleet size and cash move together.



professionals from Deloitte






About this model
An inference platform sells tokens and buys accelerator hours, and gross margin is the residual of a race between two deflation curves. Cost of revenue is never a percentage of revenue anywhere in this model - it is built bottom-up through a capacity chain, from tokens to accelerator hours to contracted capacity to dollars, so a change in throughput, utilisation or reservation coverage moves the margin through a chain a reader can follow. Three tiers are modelled separately because blending them destroys the mechanic: a commodity small model at $0.16 a million tokens served at 9,000 tokens a second, a mid tier at $0.78 and 2,100, and a frontier model at $8.50 and 480 - fifty times apart on price and twenty times apart on throughput. Prompt caching, billed at the full rate but served at 12 per cent of the compute, plus an 8 per cent free and evaluation tier that earns nothing at all, take 7,260 billion billable tokens down to a compute intensity of 0.82. Capacity is rented rather than owned, and the reservation is sized on last quarter's requirement grown at 16 per cent, so the platform is short while usage runs hot - 88.5 thousand hours bought on demand at a 55 per cent premium in the second quarter - and long once growth decays past the plan, carrying 138.2 thousand idle reserved hours by the twelfth. Both failure modes are live inside one window, and the capacity premium row shows the handover: 1.69 times the reserved rate at the start, dipping as the burst premium burns off, back to 1.71 as idle hours build. The decomposition is the analytical heart. Because cost per million tokens is identically cost per compute hour divided by tokens per compute hour, the cost curve factors exactly into procurement, capacity discipline and engineering: a rate index of 0.57, a premium index of 1.01 and a throughput index of 1.51 multiply to the 0.38 the unit cost actually reaches, and that difference is a check row. Against a price index of 0.65 the cost curve wins, and gross margin runs from 44.3 to 65.4 per cent while revenue growth decelerates from 21 per cent a quarter to 9 - deflation beating volume is the signature of the archetype. Revenue reaches 26,923 on 48,420 billion tokens across 2,288 accelerators, EBITDA crosses into profit in the sixth quarter and reaches 5,537 at a 21 per cent margin, and cash troughs at 33,900 rather than running out. The gross profit bridge closes with no residual at all: volume adds 2,328 in the final quarter, price deflation takes back 1,483, and unit cost deflation returns 737.
What every model includes
Live formulas, no hardcoded values
Outputs are driven by live formulas, so the workbook updates from its assumptions instead of relying on hardcoded results.
All assumptions in one tab
Inputs are clearly marked in the Assumptions tab and separated from calculations, making it clear what to change and what to leave intact.
Statements always balancing
For integrated-statement models, the balance sheet, cash flow, and supporting schedules tie through properly.
Distinct schedules for clarity
Debt, working capital, taxes, and cash flow can get messy quickly. We group calculations in clear schedules, not across disconnected tabs.
No hidden macros or external links
There are no unexplained external workbook links or macros to undermine auditability or portability.
Changes flow through the model
Update a key driver and see the impact carry through the forecast, financing, and return outputs. We never use hardcoded numbers in formulas.
What's inside the AI Inference COGS Model
- Model conventions: days per quarter, hours per day, seconds per hour, and the unit scale bridging tokens, hours and dollars
- Token demand by tier: opening billable tokens, volume growth, prompt cache hit rate, growth decay, cached compute factor, free and evaluation share
- Pricing: list price and price deflation per tier, enterprise discount, discounted volume share
- Serving throughput: tokens per second per accelerator by tier, quarterly efficiency gain, target utilisation
- Accelerator capacity: reserved rate and its deflation, on-demand premium, reserved coverage, capacity planning growth
- Other cost of revenue: network and delivery, storage, reliability headcount and cost, model licensing royalty, support, cost inflation
- Operating expenses: research headcount and cost, training compute and its growth, sales and marketing, G&A, capitalised research, depreciation life
- Working capital and tax: collection days, supplier days, tax rate, opening cash
Inside the AI Inference Cost Model: How Token Demand, Capacity and Deflation Interact
An AI inference cost model builds cost of revenue from tokens to accelerator hours to contracted capacity, rather than treating cost as a percentage of revenue. The template spans twelve quarters, separates three model tiers, and shows how price deflation races against cost deflation to determine gross margin.
Operating Drivers Behind Token Demand and Compute Consumption
The model separates a small commodity tier, a mid-sized tier and a frontier tier because their economics diverge sharply, but it never blends them before building capacity. Billable tokens are converted into compute tokens using a compute intensity factor that accounts for prompt caching: a cache hit is still billed at full rate but consumes only a fraction of the compute.
- That asymmetry is the core margin benefit. A free evaluation tier and internal runs add compute tokens that earn no revenue, so they are included in the demand build rather than ignored.
- Growth rates differ by tier, and usage growth decays over the twelve quarters while price and cost deflation continue. That mismatch between fading volume growth and persistent deflation is what the model is designed to expose.
The design notes emphasise that charging cost as a percentage of revenue would make the whole structure circular, so every input feeds a physical chain instead.
Calculation Flow from Compute Tokens to Contracted Capacity
Compute tokens are divided by tokens per accelerator-hour to get compute hours, which are then divided by a target utilisation to arrive at required capacity. The capacity plan is based on the prior quarter's requirement plus a planning growth rate, and reserved coverage is applied to that plan.
- A MIN guard ensures reserved hours used never exceed reserved capacity, leaving idle reserved hours when the plan is long and on-demand hours when the plan is short. On-demand hours carry a premium.
- That single guard makes both failure modes visible across the window: early quarters are short and pay a burst premium, later quarters are long and carry idle drag. Contracted hours are simply reserved capacity plus on-demand hours.
The model then converts those hours into dollars using a reserved rate that deflates each quarter and an on-demand rate set as a premium over it.
Outputs: Unit Cost Deflation and the Gross Profit Bridge
Cost per million tokens is identically cost per compute hour divided by tokens per compute hour, so the cost curve factors into three indices: an accelerator rate index, a capacity premium index, and a throughput index.
- The rate index captures hardware procurement; the premium index reflects capacity discipline by spreading the total capacity bill over hours actually computed on; the throughput index reflects engineering gains and tier mix. Their product divided by the throughput index must equal the directly calculated compute cost index each quarter, acting as a structural check.
- Gross profit is billable tokens times the spread between realised price and all-in unit cost, and its quarter-on-quarter change decomposes into volume, price and unit cost effects with no residual. A second check row confirms the bridge closes.
Realised price itself reflects list price deflation and enterprise discounts, while cost includes non-compute lines and depreciation on capitalised research.
Practical Use for Operators, CFOs and Investors
Because every cost is built from hours, a user can flex one driver and watch margin, fleet size and cash move together. Changing the planning growth rate, for example, alters when the platform is short versus long, shifting the mix between on-demand premiums and idle reserved hours.
- Adjusting the throughput gain changes tokens per hour and therefore compute hours, but not the rental rate per hour. The model also supports unit economics by tier, serving utilisation, Rule of 40 and a cash flow statement.
- The twelve-quarter window is long enough for the two deflation curves to separate and for the capacity plan to cross from under- to over-provisioned, making the handover from burst premium to idle drag visible.
- The design notes warn against common errors such as blending tiers before the capacity build, costing only used hours, applying cache to price instead of compute, and putting training compute inside COGS. The free download includes the full Excel workbook with formulas.
The interactive site preview displays cached values.
Formatted to IB standards
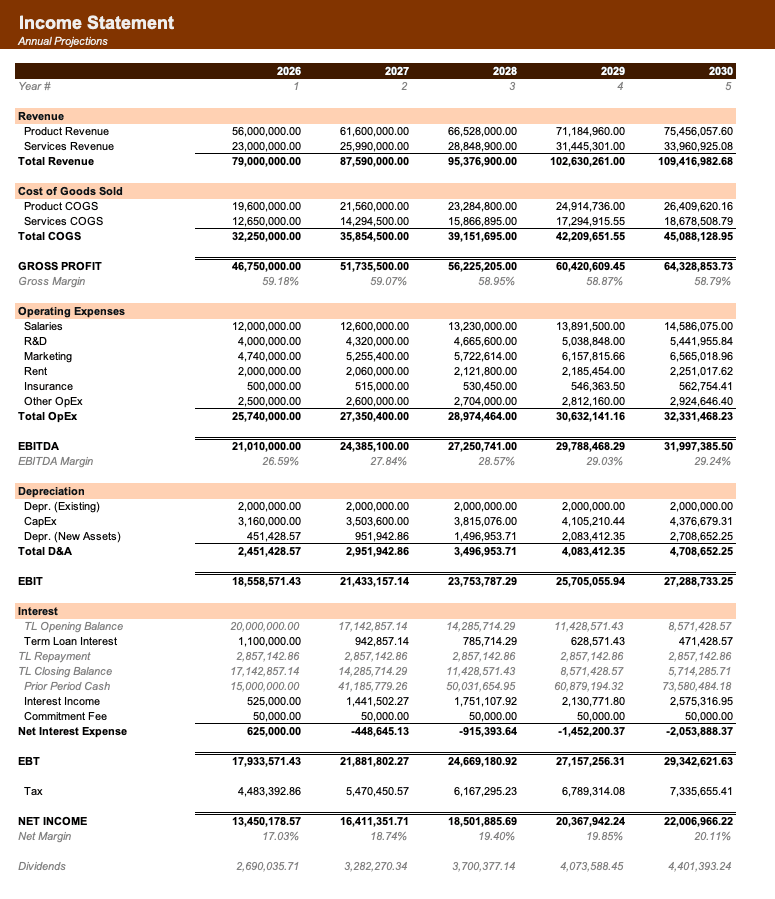
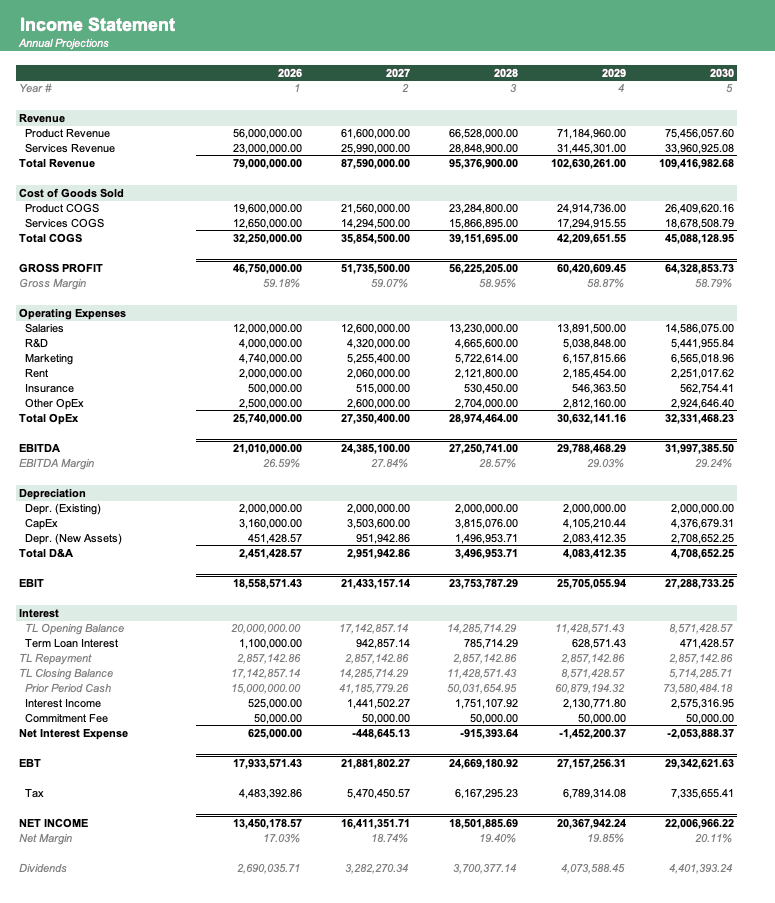
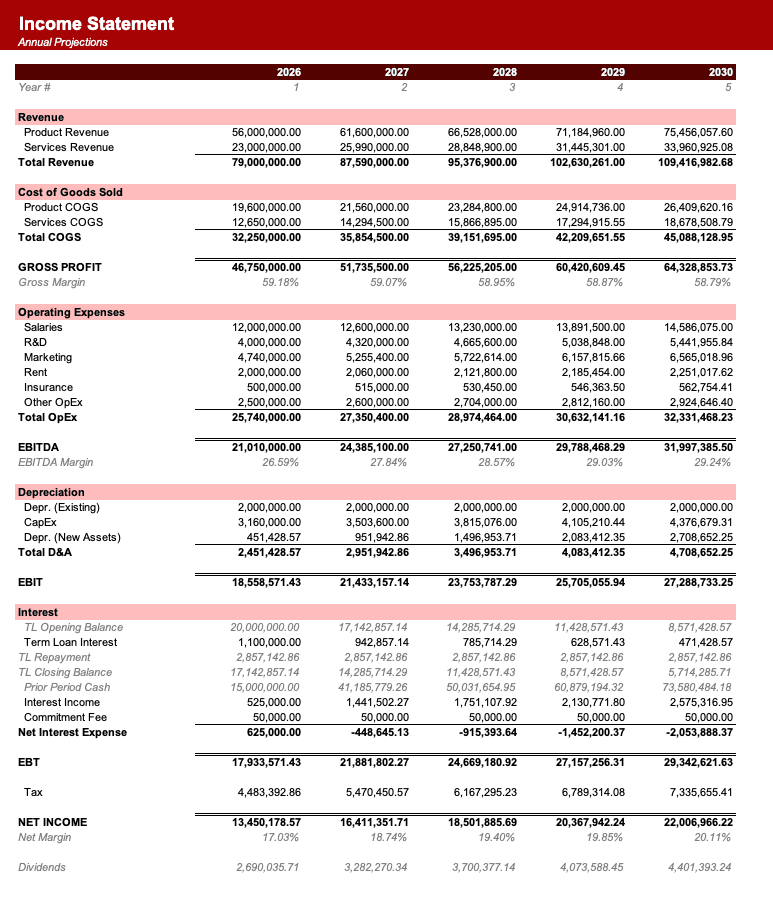
Named theme colors repaint the whole workbook in one click, on top of an investment-banking structure with clear input, output, and cross-sheet reference styling - brand-ready, institutional-grade, and fully auditable.

Created by ex-finance professionals
Hey, I’m Alex and I created Finamodel.
Over my years in the finance industry I kept building the same models over and over again. Same structure, same assumptions, different logo. So I started building frameworks to turn them into clean, reusable templates.
Every model here is one I’d actually use for a client, and I personally vet each one before it goes up.
I’m not an expert in every industry, but I’ve built enough models to know what belongs in one. And when something is completely foreign to me, I reach out to my network for experts to work on our models with us.
Having a template library on hand cuts a first build from hours to minutes.
Need help finding your model? You’ll find me in the Finamodel app!
Frequently asked
What is an AI inference COGS model?+
A model that builds the cost of serving AI inference from the bottom up rather than assuming a gross margin. It converts billable tokens into compute tokens through caching and a free tier, compute tokens into accelerator hours through a throughput per accelerator, hours into contracted capacity through a utilisation target, and capacity into dollars through a reserved rate and an on-demand premium. Gross margin then falls out of the race between the price charged per million tokens and the cost of serving them.
Why model three model tiers separately?+
Because they differ in every respect that matters. A commodity small model, a mid tier and a frontier model sit roughly fifty times apart on price per million tokens and twenty times apart on throughput per accelerator, and they cache at different rates. Blending them into one average token produces a number with no throughput and no contribution margin, and the mix shift toward frontier models, which is one of the main forces on margin, disappears entirely.
Why is capacity cost higher than the reserved rate?+
Because the reservation is sized a quarter ahead on a planning forecast, and the forecast is never right. When usage outruns the plan the shortfall is bought on demand at a premium; when growth decays past the plan the reserved block is paid for whether or not it is used. The capacity premium row carries both effects, and it hands over from one to the other partway through the window as the platform moves from short to long.
Where does training compute sit?+
In research spend, not in cost of revenue. Training a model is an investment in the product; serving a token is the cost of the sale. Putting training compute into COGS makes gross margin unreadable and is the single most common error in published inference economics, so the model carries it as a separate operating expense line with its own growth rate.
Have more financial modelling questions? Contact us
Related templates
Usage-Based Pricing Model
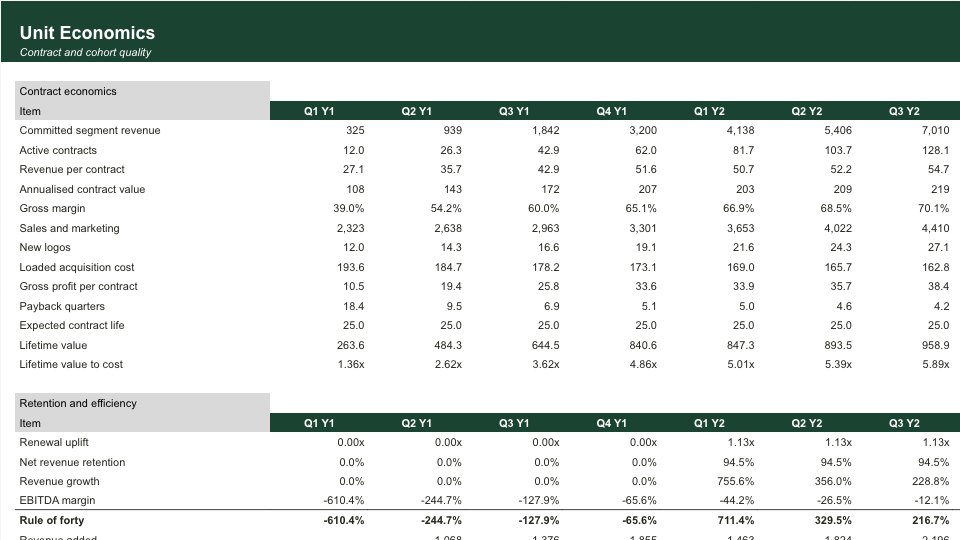
Model consumption-based software pricing: prepaid credits, usage drawdowns, overage billing, and breakage revenue.
AI/ML Startup Model
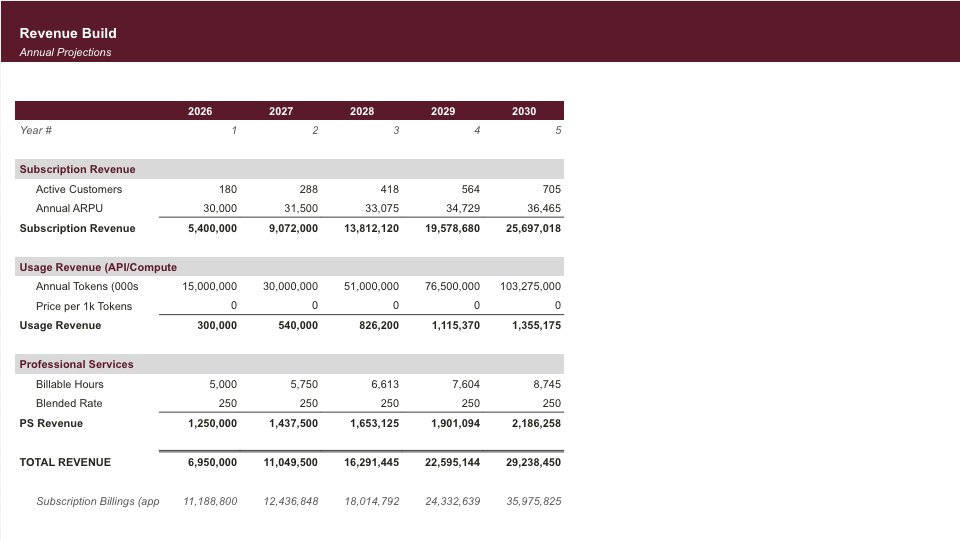
Financial projections for AI and machine learning companies.
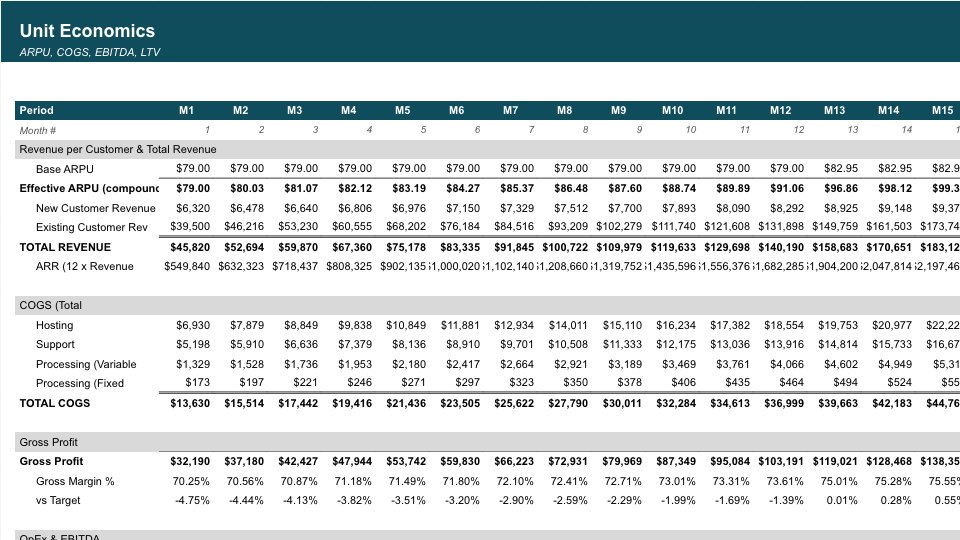
Unit Economics Dashboard
Track customer acquisition cost, lifetime value, payback period, and margins by customer segment.
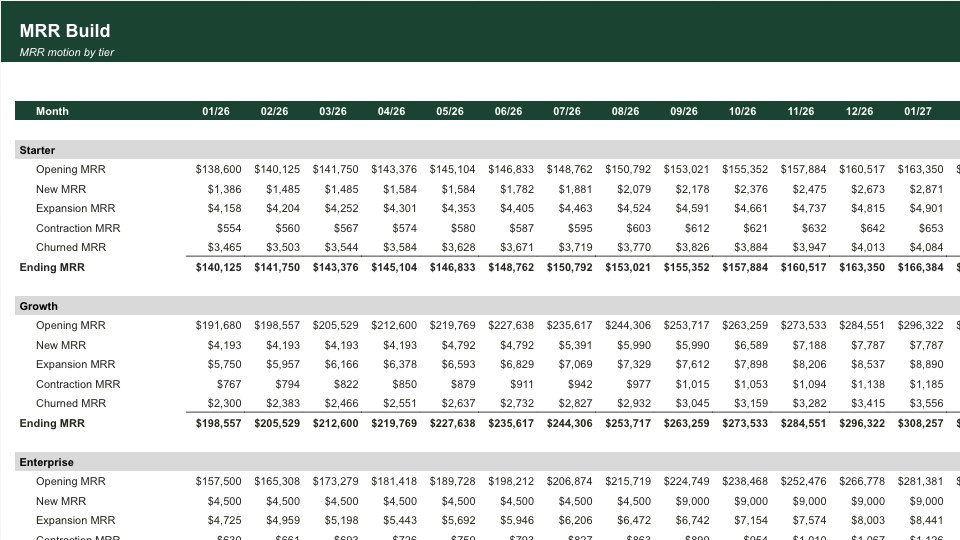
SaaS MRR/ARR Forecast Model
Subscription forecast with logo motion, MRR build, ARR, NRR/GRR, and CAC payback for SaaS businesses.