
How to Build an Income Statement Projection
Key Takeaways
- An income statement projection is the fastest path to a profitability answer — it doesn't need a balance sheet or cash flow statement, which makes it the right tool for budget planning, board updates, and quick deal screens.
- Every line should be a formula, not a hardcoded number. Reference a central assumptions block so growth rates and margin assumptions can be flexed in seconds.
- Revenue drives everything below it. Choose top-down or driver-based forecasting deliberately, and don't let the choice be an afterthought.
- Model operating leverage explicitly. Growing SG&A slower than revenue (rather than as a flat percentage) is what lets margin expansion show up in the projection the way it does in the real business.
- Floor tax at zero and sanity-check margins against history and peers — these are the two checks that catch the majority of income statement projection errors before anyone else sees them.
- Graduate to a full 3-statement model when you need the balance sheet or cash flow to reconcile — debt paydown, working capital swings, and covenant tests all require the full build, not just the income statement.
For the full integrated build, see our guide to 3-statement financial modelling. For a deeper dive on choosing a forecasting method before you start, read financial forecasting methods explained.
An income statement projection forecasts a company's revenue, costs, and profitability line by line — Revenue, COGS, Gross Profit, Operating Expenses, EBIT, Interest, Tax, and Net Income — over a future period. Unlike a full 3-statement model, it doesn't require a balance sheet or cash flow statement to build, which makes it the fastest way to answer "how profitable will this business be next year" and the natural starting point before you build anything more complex.
Most financial modelling guides jump straight to the full 3-statement build. But in practice, a huge share of real-world forecasting work — board decks, budget planning, quick deal screens, lender updates — only needs the income statement. You're answering a narrower question: given a revenue forecast and a set of cost assumptions, what does profitability look like? Getting that projection right, line by line, is a skill on its own.
This guide walks through the structure of an income statement projection, how to forecast each line item, a full worked example, and the mistakes that quietly wreck a projection's credibility.
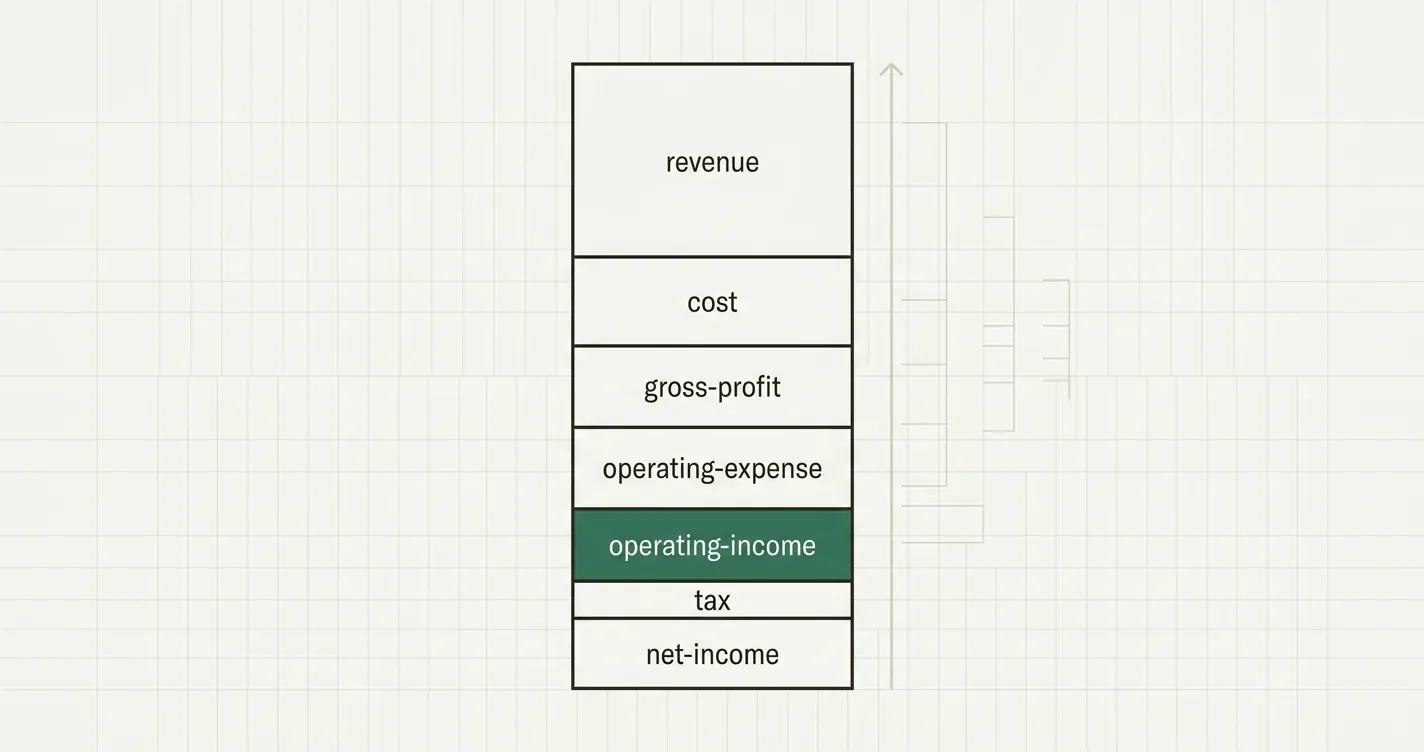
The income statement projection waterfall: every line flows from the one above it
Why Project an Income Statement on Its Own
A full 3-statement financial model links the income statement, balance sheet, and cash flow statement so that cash, debt, and equity all reconcile automatically. That's the right tool when you need to model liquidity, covenant headroom, or financing needs.
But most of that machinery exists to answer balance sheet and cash flow questions. If your question is purely "what does this business earn," a standalone income statement projection gets there faster — no working capital schedule, no debt waterfall, no balance sheet plug. It's also the piece every other model is built on top of: a 3-statement model's income statement tab, an LBO's operating case, and a DCF's free cash flow build all start with the same forecasting logic covered here.
If you need a refresher on the underlying forecasting techniques (straight-line, driver-based, moving average), see our guide to financial forecasting methods. This post assumes you've picked a method and focuses on applying it line by line down the income statement.
The Line-Item Structure
A projected income statement follows a fixed order, and each line depends on the one above it:
- Revenue — the top-line forecast; everything else is derived from or benchmarked against it.
- COGS (Cost of Goods Sold) — direct costs of delivering the product or service.
- Gross Profit — Revenue minus COGS.
- Operating Expenses — SG&A, R&D, and other indirect costs.
- D&A (Depreciation & Amortization) — non-cash expense tied to the asset base.
- EBIT (Operating Income) — Gross Profit minus Operating Expenses minus D&A.
- Interest Expense — the cost of any debt on the balance sheet.
- EBT (Earnings Before Tax) — EBIT minus Interest.
- Income Tax — EBT multiplied by the effective tax rate.
- Net Income — the bottom line.
Every line should be a formula referencing a named assumption, never a hardcoded number. That's what lets you flex growth rates or margin assumptions and watch the whole projection update.
Step 1: Forecast Revenue
Revenue is the input everything else keys off, so get this right before touching any other line. The two common approaches:
- Top-down (growth-rate) forecasting: apply a growth rate to the prior period's revenue. Fast, and reasonable for a stable, established business.
- Bottom-up (driver-based) forecasting: build revenue from units × price, customers × ARPU, or another operational driver. Slower, but far more defensible — it ties the forecast to something you can actually test against reality.
// Top-down: apply a growth rate to prior-year revenue
= Revenue_PriorYear * (1 + Assumptions!$B$4)

// Bottom-up: units x average price
= Units_Forecast * AveragePrice_Forecast
For a full treatment of forecasting techniques and when to use each, see financial forecasting methods.
Step 2: Project COGS and Gross Profit
COGS is almost always modelled as a percentage of revenue, held flat unless you have a specific reason to expect it to shift (a supplier renegotiation, a mix shift toward higher-margin products, input cost inflation).
// COGS as % of revenue
= Revenue * Assumptions!$B$6

// Gross Profit
= Revenue - COGS
Gross margin is the first sanity check on your projection. If your COGS assumption produces a gross margin wildly different from the company's historical actuals or its peer set, that's a signal to revisit the assumption before moving further down the statement.
Step 3: Project Operating Expenses
This is where most income statement projections go wrong. The naive approach — holding every opex line at a fixed percentage of revenue — implicitly assumes zero operating leverage: costs grow exactly as fast as revenue, forever. Real businesses don't work that way. A sales team, a finance function, and office overhead are semi-fixed: they scale with the business, but slower than revenue, especially post the initial ramp-up.
A more realistic approach is to grow semi-fixed opex lines (SG&A, G&A) at some fraction of the revenue growth rate rather than holding them at a constant percentage:
// Semi-fixed SG&A: grows slower than revenue (operating leverage)
= SGA_PriorYear * (1 + Assumptions!$B$4 * Assumptions!$B$8)

// where Assumptions!$B$8 is a "scaling factor" (e.g. 0.5 = SG&A grows at half the revenue growth rate)
Truly variable costs — sales commissions, payment processing fees, shipping — should stay as a straight percentage of revenue, since they scale directly with volume.
Step 4: D&A, Interest, and Tax
Depreciation & Amortization is non-cash and, in a standalone income statement projection without a full PP&E schedule, is usually simplified to a percentage of revenue or held flat at the prior year's run rate.
= Revenue * Assumptions!$B$9 // simplified: D&A as % of revenue
Interest Expense is driven by the debt balance, not revenue. If you're not building a full debt schedule, use the current balance and rate and hold it flat, or step it down manually if you know principal is amortizing.
= Debt_OpeningBalance * Assumptions!$B$11 // interest rate applied to opening debt balance
Income Tax applies the effective tax rate to EBT. Floor it at zero — a projection shouldn't show a tax benefit on a loss unless you're deliberately modelling a valid NOL carryforward.
= MAX(EBT, 0) * Assumptions!$B$13
Worked Example: Projecting a 5-Year Income Statement
Here's a full build for a mid-market services company with $18.0M in trailing revenue.
Assumptions:
| Assumption | Value |
|---|---|
| Year 0 Revenue (actual) | $18.00M |
| Revenue Growth (Y1–Y5) | 12%, 10%, 9%, 8%, 7% |
| COGS (% of Revenue) | 55% (45% gross margin) |
| SG&A (Year 0 base) | $3.96M (22% of Year 0 revenue) |
| SG&A Growth | Half the revenue growth rate each year (operating leverage) |
| D&A (% of Revenue) | 2% |
| Interest Expense | Amortizing term loan: $0.40M declining to $0.20M |
| Tax Rate | 26% |
Projected Income Statement:
| Line Item | Year 1 | Year 2 | Year 3 | Year 4 | Year 5 |
|---|---|---|---|---|---|
| Revenue | $20.16M | $22.18M | $24.18M | $26.11M | $27.94M |
| COGS | $11.09M | $12.20M | $13.30M | $14.36M | $15.37M |
| Gross Profit | $9.07M | $9.98M | $10.88M | $11.75M | $12.57M |
| Gross Margin % | 45.0% | 45.0% | 45.0% | 45.0% | 45.0% |
| SG&A | $4.20M | $4.41M | $4.61M | $4.79M | $4.96M |
| SG&A % of Revenue | 20.8% | 19.9% | 19.1% | 18.3% | 17.8% |
| D&A | $0.40M | $0.44M | $0.48M | $0.52M | $0.56M |
| EBIT | $4.47M | $5.13M | $5.79M | $6.44M | $7.05M |
| EBIT Margin % | 22.2% | 23.1% | 23.9% | 24.7% | 25.2% |
| Interest Expense | $0.40M | $0.35M | $0.30M | $0.25M | $0.20M |
| EBT | $4.07M | $4.78M | $5.49M | $6.19M | $6.85M |
| Tax (26%) | $1.06M | $1.24M | $1.43M | $1.61M | $1.78M |
| Net Income | $3.01M | $3.54M | $4.06M | $4.58M | $5.07M |
| Net Margin % | 14.9% | 16.0% | 16.8% | 17.5% | 18.1% |
Notice what's happening to margin as the model runs forward: gross margin is flat by construction (COGS is a constant % of revenue), but EBIT margin expands from 22.2% to 25.2% and net margin expands from 14.9% to 18.1% — purely because SG&A was modelled to grow slower than revenue. That's operating leverage showing up in the projection exactly the way it should show up in the real business, and it's the direct payoff of building opex as semi-fixed rather than as a flat percentage.
Want to see how these same line items connect into a full balance sheet and cash flow build? Explore the live model below.
Common Mistakes to Avoid
- Holding every opex line at a constant % of revenue. This produces a flat EBIT margin every year by construction and hides any operating leverage (or deleverage) the business would actually experience. Decide, line by line, which costs are variable and which are semi-fixed.
- Straight-lining growth with no seasonality or ramp. Applying one annual growth rate evenly is fine for an annual model, but if you're projecting monthly or quarterly, a flat growth rate ignores real seasonal patterns and will misstate any period-over-period comparison.
- Ignoring the interest-EBT circularity. If interest expense depends on a debt balance that itself depends on cash generated by net income, you have a circular reference. A standalone income statement projection typically sidesteps this by holding the debt balance or interest rate as a simple assumption — if you need the balance to move dynamically with cash flow, you need the full 3-statement model.
- Letting D&A drift from the actual asset base. A flat % of revenue is a fine simplification for a quick projection, but if CapEx and D&A diverge for several years running, the balance sheet (if you ever build one) won't tie, and the income statement will understate or overstate true operating costs.
- Not flooring tax at zero. A naive
= EBT * TaxRateformula produces a tax benefit in any loss year, which overstates net income in a downside scenario. UseMAX(EBT, 0)unless you're deliberately modelling a carryforward. - Skipping the margin sanity check. Before presenting a projection, compare projected gross, EBIT, and net margins against the company's own historicals and against public peers. A projection that shows margins expanding well beyond anything the business or its peers have ever achieved needs a better story than "the growth rate assumption produced it."
- False precision on immaterial lines. Building five distinct growth drivers for opex categories that are each under 2% of revenue adds review time without adding accuracy. Reserve granular, driver-based treatment for the line items that actually move the answer — usually revenue, COGS, and the largest opex line.

Alex Tapio
Founder of Finamodel • Professional Financial Modeller • Ex-Deloitte







