
Rolling Forecast: How to Build One in Excel
Key Takeaways
- A rolling forecast keeps a constant horizon - typically 12 months, sometimes 18 - that moves forward every time a period closes, unlike a static annual budget whose endpoint is fixed.
- The mechanic is drop-one-add-one: every close, drop the oldest period, add one new forecast period, and refresh the drivers off the latest actuals.
- Build the window with
COUNT()-anchoredINDEXformulas, not hardcoded ranges or volatileOFFSETcalls, so it re-sums itself automatically as new months are appended. - The budget and the rolling forecast are complementary, not competing - the budget is the fixed yardstick, the rolling forecast is the moving best estimate, and the gap between them is what a budget-vs-actuals review measures.
- Refresh every driver every cycle. A rolling forecast with stale growth assumptions is just a static forecast wearing a new date.
- Keep the horizon length fixed. A window that changes width from cycle to cycle undermines the entire point of rolling forward.
For the forecasting methods that feed each new period of a rolling model, see our guide to financial forecasting methods, and to close the loop once actuals land, read our walkthrough of budget vs. actual variance analysis.
A rolling forecast is a financial forecast that always looks the same distance ahead - 12 months, say - no matter what month it is. Every month-end you drop the oldest period from the window, add a new forecast period at the far end, and refresh the numbers off the latest actual. This guide walks through the drop-one-add-one mechanic that makes a 12-month rolling forecast work, the Excel formulas that automate it, and a full worked example showing the window roll forward twice.
Most companies build a financial forecast once a year, call it "the budget," and spend the next twelve months watching it drift further from reality. By month nine, the plan reflects assumptions from over a year ago and nobody trusts it. A rolling forecast fixes this by treating the forecast as a living document: every month you extend it one period further out and drop the period that just closed, so you always have a constant-length view of what's ahead - this is what people mean by continuous forecasting, as opposed to a forecast you build once and leave alone.
This is a companion to our broader guide on financial forecasting methods, which covers straight-line, moving-average, and driver-based forecasting techniques. This post is narrower and more mechanical: it's specifically about the rolling forecast structure - how to build the 12-month (or 18-month) window in Excel so it updates itself every close, rather than requiring you to rebuild the model from scratch each cycle.
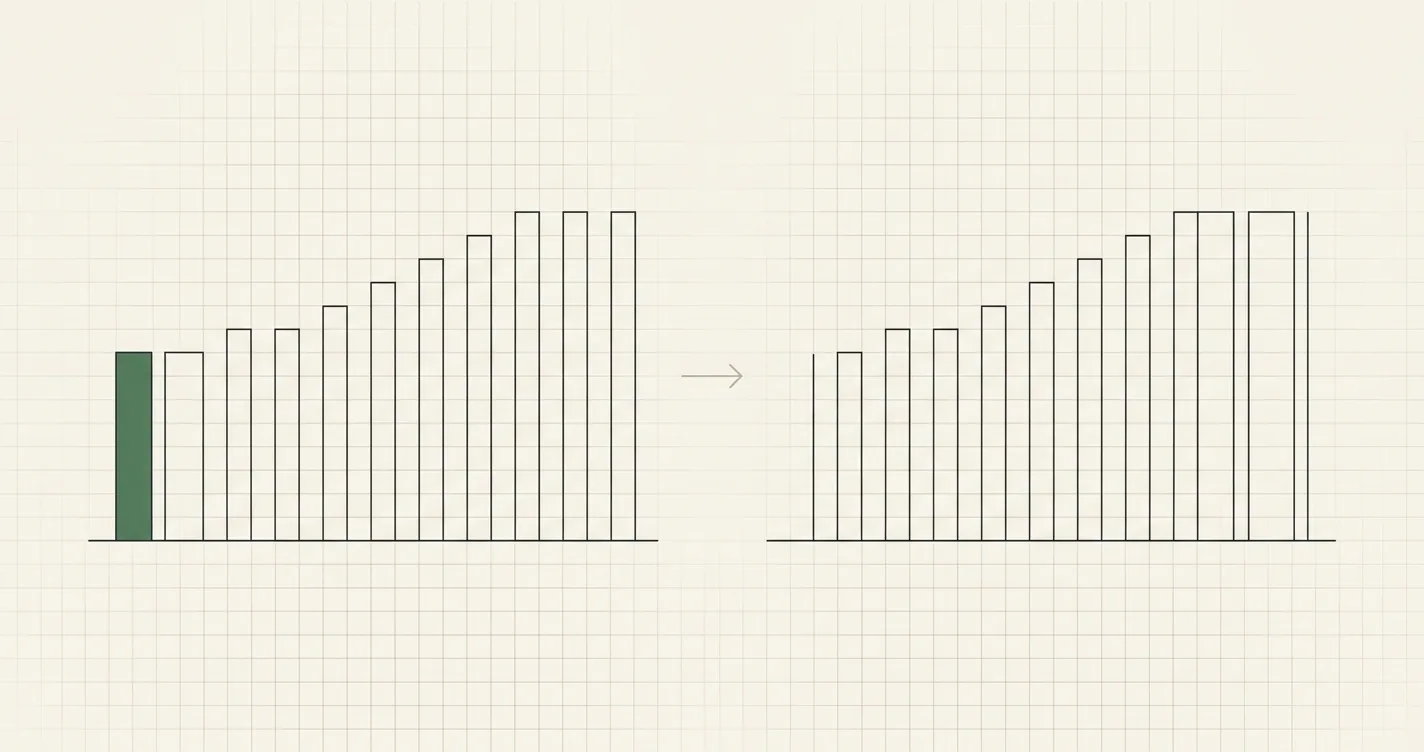
The rolling forecast cycle: every month-end, drop the oldest period, add one new forecast period, and the window stays a constant length.
What Is a Rolling Forecast?
A rolling forecast (also called a rolling budget or continuous forecast) is a forecast that maintains a constant forward-looking horizon - most commonly 12 months, sometimes 18 - by adding a new period every time one closes. Instead of forecasting "the rest of fiscal year 2026," you are always forecasting "the next 12 months," whatever today's date happens to be.
This solves the core weakness of a static annual budget: a budget set in November for the following calendar year is, by design, stale by autumn. A rolling forecast never has a stale endpoint, because the endpoint itself moves forward with you.
| Static Annual Budget | Rolling Forecast | |
|---|---|---|
| Horizon | Fixed calendar year (12 months, shrinking) | Constant rolling window (e.g. always 12 months ahead) |
| Set | Once a year | Refreshed every month or quarter |
| Purpose | Fixed target to measure performance against | Best current estimate of what's coming |
| By month 11 | Covers 1 month of real foresight | Still covers a full 12 months of foresight |
| Effort | Heavy once, then static | Lighter, but recurring every cycle |
The budget and the rolling forecast are not competitors - most FP&A teams run both. The budget stays fixed as the yardstick you're held to; the rolling forecast is the moving estimate you compare against it. That comparison is exactly what a budget vs. actuals review measures.
The Drop-One-Add-One Mechanic
The entire rolling forecast technique reduces to one repeating action, performed every time a period closes:
- Drop the oldest period from the window (it's now history - move it to the actuals archive).
- Add one new forecast period at the far end, built off the latest actual and the current drivers.
- Refresh every driver assumption (growth rate, seasonality, headcount, pipeline) using the newest data available.
- Re-sum the window. If your formulas are built correctly, this step is automatic - nothing to rebuild.
The window length stays constant - 12 months in, 12 months out - but which 12 calendar months it covers shifts forward by one every cycle. This is the "rolling" in rolling forecast, and it's what people mean by a 12-month rolling forecast rather than a fixed fiscal-year forecast.
Choosing the horizon: 12 months is the standard because it matches most reporting cadences and gives a full seasonal cycle of visibility. Some companies - particularly those with long sales cycles or annual contract renewals - run an 18-month window instead, trading a heavier maintenance load for more lead time on capacity and hiring decisions. Whichever length you pick, keep it fixed; a window that sometimes shows 10 months and sometimes 14 defeats the purpose.
Building the Rolling Window in Excel
A rolling forecast needs three components on separate sheets or tables:
- Actuals - a single, ever-growing table of closed months. Never overwritten, only appended to.
- Drivers - the assumptions (growth rates, seasonality factors, headcount plans) that generate each new forecast period. These get refreshed every cycle, not just typed once.
- Rolling Output - the trailing window itself, which should re-calculate automatically as new columns are appended to Actuals.
The mistake almost everyone makes on their first rolling forecast is hardcoding the window as a fixed range like =SUM(C2:N2). The moment you add a new month, that range is wrong, and you're back to manually rebuilding the model every close - which defeats the entire point of "rolling."
A Non-Volatile Trailing-Window Formula
The common textbook answer is OFFSET, but OFFSET is a volatile function - it recalculates on every worksheet change, which slows down large models. A cleaner pattern uses INDEX, which is not volatile, to find the start and end of the trailing window based on how many months of data currently exist:
// MonthlyRevenue is a growing named range (or table column) of actuals + forecast
// COUNT() tells the formula how many months currently exist - no hardcoded range
= SUM( INDEX(MonthlyRevenue, COUNT(MonthlyRevenue) - 11) : INDEX(MonthlyRevenue, COUNT(MonthlyRevenue)) )
As you append a new month to MonthlyRevenue, COUNT() increases by one, both INDEX anchors shift forward by one column, and the trailing-12 sum re-points itself automatically - no manual edits, no dragging formulas.
Refreshing the Growth Driver
The forecast for the newest month should be driven by a rule, not typed in by hand. A common driver is the average month-over-month growth rate over the last few closed actuals:
// Average of the last 3 realized growth rates - refreshes as Growth grows
= AVERAGE( INDEX(Growth, COUNT(Growth) - 2) : INDEX(Growth, COUNT(Growth)) )

// New month's forecast: last actual x (1 + refreshed average growth)
= LastActual * (1 + AvgGrowth)
Because both formulas reference COUNT() rather than a fixed cell range, adding a new actual column each month automatically slides every downstream calculation forward. This is the property that separates a true rolling forecast from a spreadsheet you happen to update monthly.
Worked Example: Rolling the Window Forward Twice
Here is a 12-month actual revenue history for a subscription business, as of the close of Month 12:
| Month | 1 | 2 | 3 | 4 | 5 | 6 | 7 | 8 | 9 | 10 | 11 | 12 |
|---|---|---|---|---|---|---|---|---|---|---|---|---|
| Revenue | $80.0k | $82.0k | $85.0k | $87.0k | $90.0k | $93.0k | $95.0k | $98.0k | $101.0k | $104.0k | $107.0k | $110.0k |
| MoM Growth | - | 2.50% | 3.66% | 2.35% | 3.45% | 3.33% | 2.15% | 3.16% | 3.06% | 2.97% | 2.88% | 2.80% |
Trailing-12 total as of Month 12 (Months 1–12): $80.0k + $82.0k + ... + $110.0k = $1,132.0k
Roll 1: Add Month 13, Drop Month 1
The driver for the new month is the average of the last 3 realized growth rates (Months 10, 11, 12): (2.97% + 2.88% + 2.80%) / 3 = 2.9%.
Month 13 Forecast = Month 12 x (1 + 2.9%) = $110.0k x 1.029 = $113.19k
The window now drops Month 1 and adds Month 13:
New Trailing-12 (Months 2-13) = $1,132.0k - $80.0k (Month 1 dropped) + $113.19k (Month 13 added)
                               = $1,165.19k
Checking by direct addition (Months 2 through 13): $82.0k + $85.0k + $87.0k + $90.0k + $93.0k + $95.0k + $98.0k + $101.0k + $104.0k + $107.0k + $110.0k + $113.19k = $1,165.19k. It ties.
Roll 2: Add Month 14, Drop Month 2
One month later, the same mechanic repeats. The driver refreshes to the average of the last 3 growth rates, which now include the Month 13 forecast: (2.88% + 2.80% + 2.9%) / 3 = 2.86%.
Month 14 Forecast = Month 13 x (1 + 2.86%) = $113.19k x 1.0286 = $116.43k
The window drops Month 2 and adds Month 14:
New Trailing-12 (Months 3-14) = $1,165.19k - $82.0k (Month 2 dropped) + $116.43k (Month 14 added)
                               = $1,199.62k
| Roll | Window | Dropped | Added | New Trailing-12 Total |
|---|---|---|---|---|
| Start | Months 1–12 | - | - | $1,132.00k |
| Roll 1 | Months 2–13 | Month 1 ($80.0k) | Month 13 ($113.19k) | $1,165.19k |
| Roll 2 | Months 3–14 | Month 2 ($82.0k) | Month 14 ($116.43k) | $1,199.62k |
Notice what never changes across both rolls: the window is always exactly 12 months wide. Only its position moves. That constant width, refreshed automatically by the COUNT()-based formulas above, is the entire mechanical definition of a rolling forecast.
Rolling Forecast vs. Related Techniques
It's worth being precise about how a rolling forecast relates to the other FP&A tools it gets grouped with:
- Vs. driver-based forecasting: these aren't alternatives - a rolling forecast is a structure (constant window, refreshed every cycle), while driver-based forecasting is a method for generating each new period's number. Our financial forecasting methods guide covers driver-based, straight-line, and trend forecasting in depth; any of them can feed the newest month in a rolling model.
- Vs. the annual budget: the budget is fixed and used as a scorecard; the rolling forecast is the moving best estimate compared against it in a budget vs. actuals review.
- Vs. zero-based budgeting: zero-based budgeting rebuilds every cost line from a blank slate on a fixed annual cycle; a rolling forecast, by contrast, carries most drivers forward and only re-justifies what's changed. They address different problems - ZBB targets cost discipline, rolling forecasts target foresight.
Common Mistakes to Avoid
- Hardcoding the window as a fixed cell range.
=SUM(C2:N2)breaks the moment you add a new month. UseCOUNT()-anchoredINDEXformulas so the window slides on its own. - Using
OFFSETin a large model. It works, but it's a volatile function that recalculates the entire workbook on every change. PreferINDEX-based ranges, which are not volatile, once the model has more than a handful of sheets. - Forgetting to refresh the drivers. A rolling forecast that keeps last year's growth-rate assumption in every new period isn't rolling - it's a static forecast with a moving date stamp. Refresh the driver off the latest closed actuals every cycle.
- Treating the rolling forecast as a replacement for the budget. They serve different purposes. Killing the annual budget removes your fixed yardstick; keep both and compare them.
- Letting the horizon length drift. A window that's sometimes 10 months and sometimes 14, depending on who last touched the model, defeats the purpose. Pick 12 or 18 months and enforce it structurally.
- No visual distinction between actuals and forecast periods. Once a period closes, it should be visually locked (shading, a hard number instead of a formula) so nobody mistakes a stale forecast cell for a real result.
- Rebuilding from scratch every month. If your analyst spends a day each close manually re-dragging formulas, the model isn't actually rolling - it's a static forecast rebuilt on a monthly cadence, which costs more effort for no structural benefit.

Alex Tapio
Founder of Finamodel • Professional Financial Modeller • Ex-Deloitte







