
Unlevered Free Cash Flow: Formula and Calculation
Key Takeaways
- UFCF is cash to all capital providers, calculated before interest and debt repayment:
EBIT x (1 - t) + D&A - CapEx - ΔNWC. It pairs with WACC and yields enterprise value. - Never deduct interest and discount at WACC. The tax shield lives in the WACC formula. Putting it in the cash flow too counts it twice.
- Tax EBIT, not EBITDA. The EBITDA route is fine, but cash taxes must still be
EBIT x t- the D&A tax shield is real. - Build all three routes and tie them out. EBIT, EBITDA, and net income must land on the same number. A permanent zero-check row beneath the schedule catches errors before a reader does.
- Working capital is not a rounding error. Growth ties up cash. Our example loses $1.5M of Year 1 UFCF to a $1.5M NWC build - 13% of the total - and drops it entirely if you skip the line.
- UFCF margin rising with flat EBITDA margin is a growth story, not a margin story. Understand which one your model is actually telling.
- Scrutinise Year 5 hardest. It drives 76% of enterprise value through the terminal value. Normalise it before capitalising it.
For the full model this schedule feeds, see the DCF model Excel tutorial, or read up on terminal value calculation and the enterprise value vs equity value bridge. To get the discount rate right, work through how to calculate WACC. For the working capital mechanics behind the ΔNWC line, see our guide to working capital modelling. You can also download the free DCF valuation template and inspect a live UFCF schedule.
Unlevered free cash flow (UFCF) is the cash a business generates from operations after taxes and reinvestment, but before any payments to lenders. It is the numerator of every DCF, and getting it wrong quietly corrupts your entire valuation. This guide covers the UFCF formula, the three routes to calculating it (from EBIT, from EBITDA, and from net income), a fully worked five-year example that ties across all three, the Excel formulas to build it, and the mistakes that cause most UFCF schedules to fail an audit.
Unlevered free cash flow - also called free cash flow to firm (FCFF) - answers one question: how much cash does this business throw off, regardless of who financed it? Strip out interest, strip out debt repayment, strip out dividends. What's left belongs to the capital providers collectively, debt and equity alike.
That "regardless of who financed it" property is why UFCF is the standard cash flow measure in a DCF. Because it excludes financing effects, you discount it at WACC - the blended cost of all capital - and you get enterprise value. Levered free cash flow, by contrast, is what's left for equity holders only; you discount it at the cost of equity and get equity value directly. Mixing the two up is the single most common valuation error in junior modelling work, and it produces answers that are wrong by the entire value of the debt.
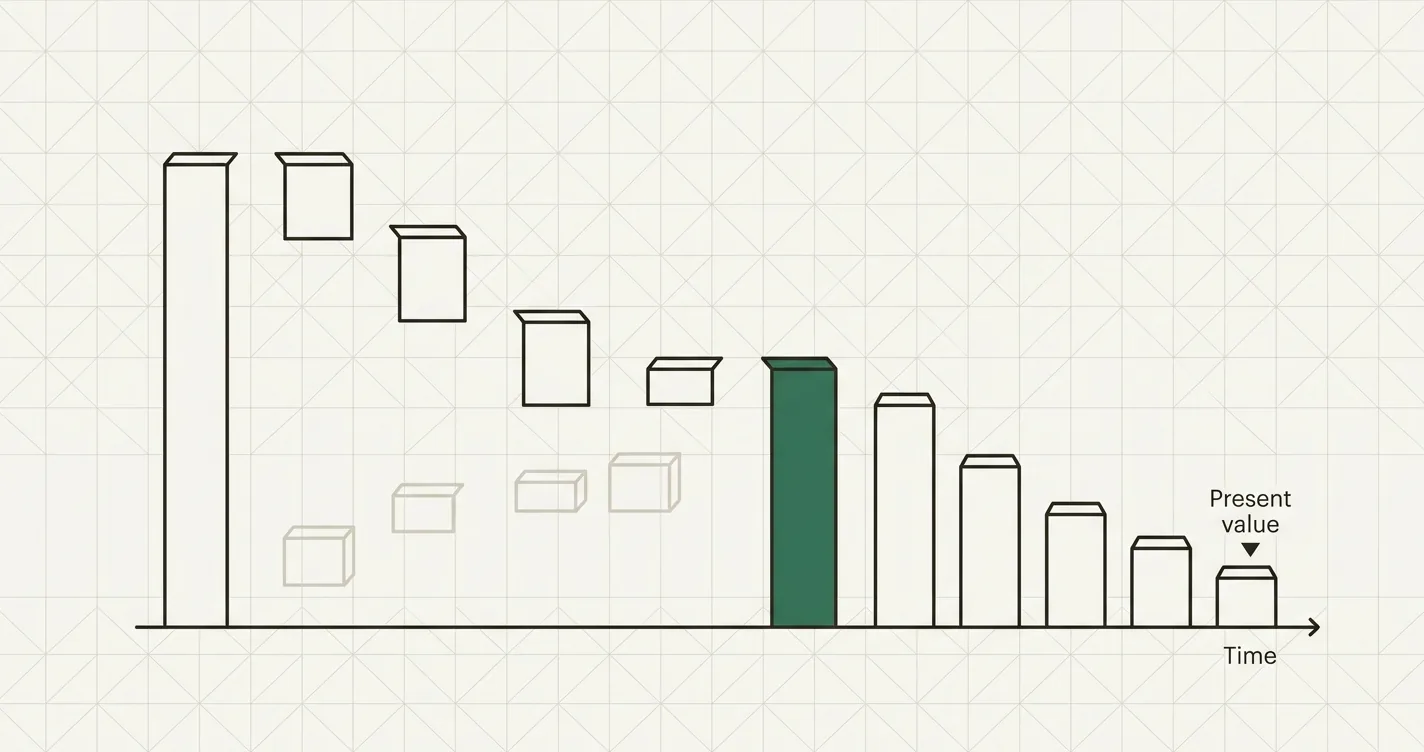
From operating profit to enterprise value: UFCF is the bridge, and WACC is the discount rate that matches it.
The UFCF Formula
The standard formula starts from operating profit:
UFCF = EBIT x (1 - Tax Rate) + D&A - CapEx - Change in Net Working Capital
Each term earns its place:
| Component | Why it's there |
|---|---|
| EBIT | Operating profit before financing. Interest is deliberately excluded - that's the "unlevered" part. |
| x (1 - Tax Rate) | Cash taxes the business would pay if it had no debt. This gives NOPAT (net operating profit after tax). |
| + D&A | Depreciation and amortisation reduced EBIT but never left the bank. Add it back. |
| - CapEx | Cash actually spent on assets. It never touched the income statement, so it must be deducted here. |
| - Change in NWC | Growth ties up cash in receivables and inventory before customers pay. That cash isn't free. |
Why interest is excluded
This is the part people get wrong. Notice that the tax term is EBIT x (1 - Tax Rate), not the company's actual tax bill. A levered company pays less tax than an identical unlevered one, because interest is deductible. That benefit is real - but in a DCF it is captured in the WACC, via the after-tax cost of debt term.
If you deducted interest in the cash flow and discounted at WACC, you would count the tax shield twice. So: unlevered cash flow, WACC discount rate, enterprise value. Levered cash flow, cost of equity discount rate, equity value. Never cross the wires.
Three Routes to the Same Number
A UFCF schedule that only computes one way is a schedule you cannot check. In practice you build one route and use the others to tie out. All three must land on the identical number.
Route 1: From EBIT (the standard)
UFCF = EBIT x (1 - t) + D&A - CapEx - ΔNWC
Route 2: From EBITDA
Since EBITDA already excludes D&A, you cannot simply add it back - but D&A still shields tax, so it must be handled:
UFCF = EBITDA - Cash Taxes - CapEx - ΔNWC
where Cash Taxes = EBIT x t. This route is common in LBO and credit work, where EBITDA is the headline metric. The trap is subtracting EBITDA x t instead of EBIT x t - that overstates tax and understates UFCF by D&A x t every single year.
Route 3: From Net Income
If you're starting from a completed 3-statement model, net income is your anchor:
UFCF = Net Income + After-Tax Interest Expense + D&A - CapEx - ΔNWC
Net income is after interest, so you add interest back - but only the after-tax portion, Interest x (1 - t), because the deduction already lowered the tax line. This route is the best audit check you have: if it doesn't agree with Route 1, one of your two schedules is broken.
Worked Example: Five-Year UFCF Schedule
Take a mid-market industrial company. Prior year (Year 0) revenue was $90.0M. Assumptions:
| Assumption | Value |
|---|---|
| Year 1 Revenue | $100.0M |
| Revenue growth (Y2–Y5) | 12%, 10%, 8%, 6% |
| EBITDA margin | 25% of revenue |
| D&A | 5% of revenue |
| CapEx | 7% of revenue |
| Net working capital | 15% of revenue |
| Tax rate | 25% |
Working capital is driven off revenue, so the Year 1 change is measured against Year 0's NWC of $13.5M (15% x $90.0M).
The schedule:
| Metric | Year 1 | Year 2 | Year 3 | Year 4 | Year 5 |
|---|---|---|---|---|---|
| Revenue | $100.0M | $112.0M | $123.2M | $133.1M | $141.0M |
| EBITDA (25%) | $25.0M | $28.0M | $30.8M | $33.3M | $35.3M |
| Less: D&A (5%) | $5.0M | $5.6M | $6.2M | $6.7M | $7.1M |
| EBIT | $20.0M | $22.4M | $24.6M | $26.6M | $28.2M |
| Less: Tax @ 25% | $5.0M | $5.6M | $6.2M | $6.7M | $7.1M |
| NOPAT | $15.0M | $16.8M | $18.5M | $20.0M | $21.2M |
| Add: D&A | $5.0M | $5.6M | $6.2M | $6.7M | $7.1M |
| Less: CapEx (7%) | $7.0M | $7.8M | $8.6M | $9.3M | $9.9M |
| Less: Δ NWC | $1.5M | $1.8M | $1.7M | $1.5M | $1.2M |
| UFCF | $11.5M | $12.8M | $14.3M | $15.8M | $17.1M |
| UFCF margin | 11.5% | 11.4% | 11.6% | 11.9% | 12.2% |
The NWC line deserves a look. Year 1 NWC is $15.0M against $13.5M the year before - a $1.5M increase, which is a use of cash. As growth decelerates from 12% to 6%, the annual drag falls from $1.8M to $1.2M and UFCF margin climbs from 11.4% to 12.2%. That is not margin improvement; the EBITDA margin is flat at 25% throughout. It is simply a slower-growing business needing less incremental working capital. Fast growth suppresses free cash flow even when profitability is unchanged - a fact that surprises people looking at a growth company's cash flow statement for the first time.
Tying out all three routes (Year 1)
Route 1 - from EBIT:
UFCF = $20.0M x (1 - 0.25) + $5.0M - $7.0M - $1.5M
     = $15.0M + $5.0M - $7.0M - $1.5M
     = $11.5M
Route 2 - from EBITDA: cash taxes are EBIT x t = $20.0M x 25% = $5.0M.
UFCF = $25.0M - $5.0M - $7.0M - $1.5M = $11.5M
Route 3 - from net income. Suppose the company carries $100M of debt at 8%, so interest expense is $8.0M:
EBT        = $20.0M - $8.0M          = $12.0M
Net Income = $12.0M x (1 - 0.25)     = $9.0M

UFCF = $9.0M + ($8.0M x 0.75) + $5.0M - $7.0M - $1.5M
     = $9.0M + $6.0M + $5.0M - $7.0M - $1.5M
     = $11.5M
All three routes give $11.5M. Note what happened in Route 3: net income of $9.0M is $6.0M below NOPAT of $15.0M, and adding back after-tax interest of exactly $6.0M closes the gap. That is the tax shield being removed from the cash flow so WACC can account for it instead.
The contrast with levered free cash flow
Same company, same year, but now measure what equity holders actually receive. Assume $5.0M of mandatory debt amortisation:
LFCF = Net Income + D&A - CapEx - ΔNWC - Mandatory Debt Repayment
     = $9.0M + $5.0M - $7.0M - $1.5M - $5.0M
     = $0.5M
$11.5M unlevered versus $0.5M levered. Both are correct; they answer different questions. UFCF says the business generated $11.5M. LFCF says the shareholders saw $0.5M after the lenders were paid. Discount the first at WACC for enterprise value; discount the second at cost of equity for equity value. You should never see UFCF discounted at cost of equity, and you should be suspicious of any model that computes only one of the two.
Building It in Excel
Keep the schedule as a flat block of rows with one column per year, every driver pointing at the Assumptions sheet. Assume revenue sits in row 6, and the assumption cells are $B$4 (EBITDA margin), $B$5 (D&A %), $B$6 (CapEx %), $B$7 (NWC %), and $B$8 (tax rate).
// Revenue (Year 2 onward, growth rate in Assumptions B3)
=C6*(1+Assumptions!$B$3)

// EBITDA
=C6*Assumptions!$B$4

// D&A
=C6*Assumptions!$B$5

// EBIT
=C7-C8

// Tax on EBIT - note: on EBIT, never on EBITDA
=C9*Assumptions!$B$8

// NOPAT
=C9-C10

// CapEx (shown as a positive; subtracted below)
=C6*Assumptions!$B$6

// Net working capital balance
=C6*Assumptions!$B$7

// Change in NWC (D14 is this year's balance, C14 last year's)
=D14-C14

// UFCF = NOPAT + D&A - CapEx - ΔNWC
=C11+C8-C12-C15
Two conventions worth adopting. First, sign discipline: enter CapEx and ΔNWC as positive numbers and subtract them explicitly in the UFCF line, rather than storing negatives and adding. Mixed signs are where UFCF schedules go quietly wrong. Second, build the tie-out row directly beneath the schedule:
// Audit check: Route 3 (from net income) minus Route 1 (from EBIT). Must be zero.
=(NetIncome + Interest*(1-Assumptions!$B$8) + C8 - C12 - C15) - C16
Conditionally format that row red if it isn't zero. It costs sixty seconds and it catches the errors you'd otherwise find in a diligence call.
From UFCF to Enterprise Value
UFCF only earns its keep once it's discounted. Using a 9.0% WACC and a 2.5% terminal growth rate:
| Year | UFCF | Discount Factor @ 9.0% | Present Value |
|---|---|---|---|
| 1 | $11.5M | 0.9174 | $10.6M |
| 2 | $12.8M | 0.8417 | $10.8M |
| 3 | $14.3M | 0.7722 | $11.0M |
| 4 | $15.8M | 0.7084 | $11.2M |
| 5 | $17.1M | 0.6499 | $11.1M |
| Sum of PV (Years 1–5) | - | - | $54.7M |
Terminal value by Gordon Growth, off the Year 5 UFCF of $17.1M:
Terminal Value = $17.1M x (1 + 0.025) / (0.09 - 0.025)
               = $17.5M / 0.065
               = $269.7M

PV of Terminal Value = $269.7M x 0.6499 = $175.2M
Enterprise Value = $54.7M + $175.2M = $229.9M
With $60M of debt and $15M of cash, net debt is $45M:
Equity Value = $229.9M - $45M = $184.9M
Note that the terminal value contributes $175.2M of the $229.9M enterprise value - 76% of the total. That is normal for a five-year forecast, and it is why the Year 5 UFCF deserves more scrutiny than any other cell in the model. If Year 5 is a peak year, or still carries a growth-inflated working capital drag, the perpetuity built on it inherits that distortion and multiplies it.
Because the discount rate does so much work here, it's worth pressure-testing WACC before trusting the output:
Sensitivity confirms the point. Enterprise value across a range of WACC and terminal growth assumptions:
| WACC \ Terminal Growth | 1.5% | 2.0% | 2.5% | 3.0% | 3.5% |
|---|---|---|---|---|---|
| 8.0% | $238M | $254M | $273M | $296M | $324M |
| 8.5% | $220M | $234M | $250M | $268M | $291M |
| 9.0% | $205M | $217M | $230M | $245M | $264M |
| 9.5% | $192M | $202M | $213M | $226M | $241M |
| 10.0% | $180M | $189M | $198M | $209M | $222M |
The base case is ~$230M; the corners span $180M to $324M. Same UFCF schedule, an 80% spread. Present a range.
Normalising UFCF: What Goes In and What Doesn't
The formula is easy. Deciding what belongs in EBIT is where judgement lives.
Exclude from UFCF (financing or non-operating):
- Interest expense and interest income
- Debt drawdowns and repayments
- Dividends and buybacks
- Equity issuance proceeds
Include (operating, even when it's tempting not to):
- Stock-based compensation as a real cost. Adding SBC back as "non-cash" while ignoring the resulting dilution flatters UFCF for software companies specifically. If you add it back, model the share count growth.
- Maintenance and growth CapEx. Some analysts strip growth CapEx to show "owner earnings" - legitimate in principle, but then your revenue forecast must not assume the growth that CapEx was funding.
- Lease payments. Under IFRS 16 / ASC 842 operating leases sit in D&A and interest rather than opex, which inflates EBITDA and EBIT. Either deduct the cash lease payment in UFCF or treat capitalised leases as debt in the net debt bridge. Do exactly one - doing both double-counts, doing neither overstates value.
Normalise (one-off items):
- Restructuring charges, litigation settlements, M&A fees. Strip genuinely non-recurring items out of EBIT, but be honest: a company that "restructures" every year has a recurring restructuring expense.
Common Mistakes
- Taxing EBITDA instead of EBIT. The most frequent Route 2 error. It overstates cash taxes by
D&A x t- $1.25M a year in our example (5% x $100M x 25%), compounding into a materially undervalued business. - Deducting interest from UFCF, then discounting at WACC. Double-counts the tax shield and understates enterprise value. If interest is in the cash flow, you're building LFCF and must discount at cost of equity instead.
- Using the company's actual tax expense rather than EBIT x t. The reported tax line reflects the interest deduction. Unlevered cash flow needs the tax bill of an unlevered business.
- Getting the sign on ΔNWC backwards. An increase in net working capital is a use of cash and reduces UFCF. Modellers who store ΔNWC as a negative and then subtract it flip growth-driven cash drag into a phantom cash inflow - worth roughly $3M of UFCF in Year 1 here.
- Ignoring working capital entirely. UFCF rises to $13.0M in Year 1 without the NWC line - 13% too high, and the error grows with the growth rate.
- Adding back all of SBC with no dilution adjustment. Inflates UFCF for exactly the companies where equity compensation is most material.
- Building a terminal value on an abnormal Year 5. If the final forecast year has depressed cash flow from a growth spike or a CapEx cycle, normalise it before applying the perpetuity. At 76% of enterprise value, terminal value forgives nothing.

Alex Tapio
Founder of Finamodel • Professional Financial Modeller • Ex-Deloitte







