CHCarrum Health Financial Model
Biotech/Pharma Startup Financials (Free Excel Download)
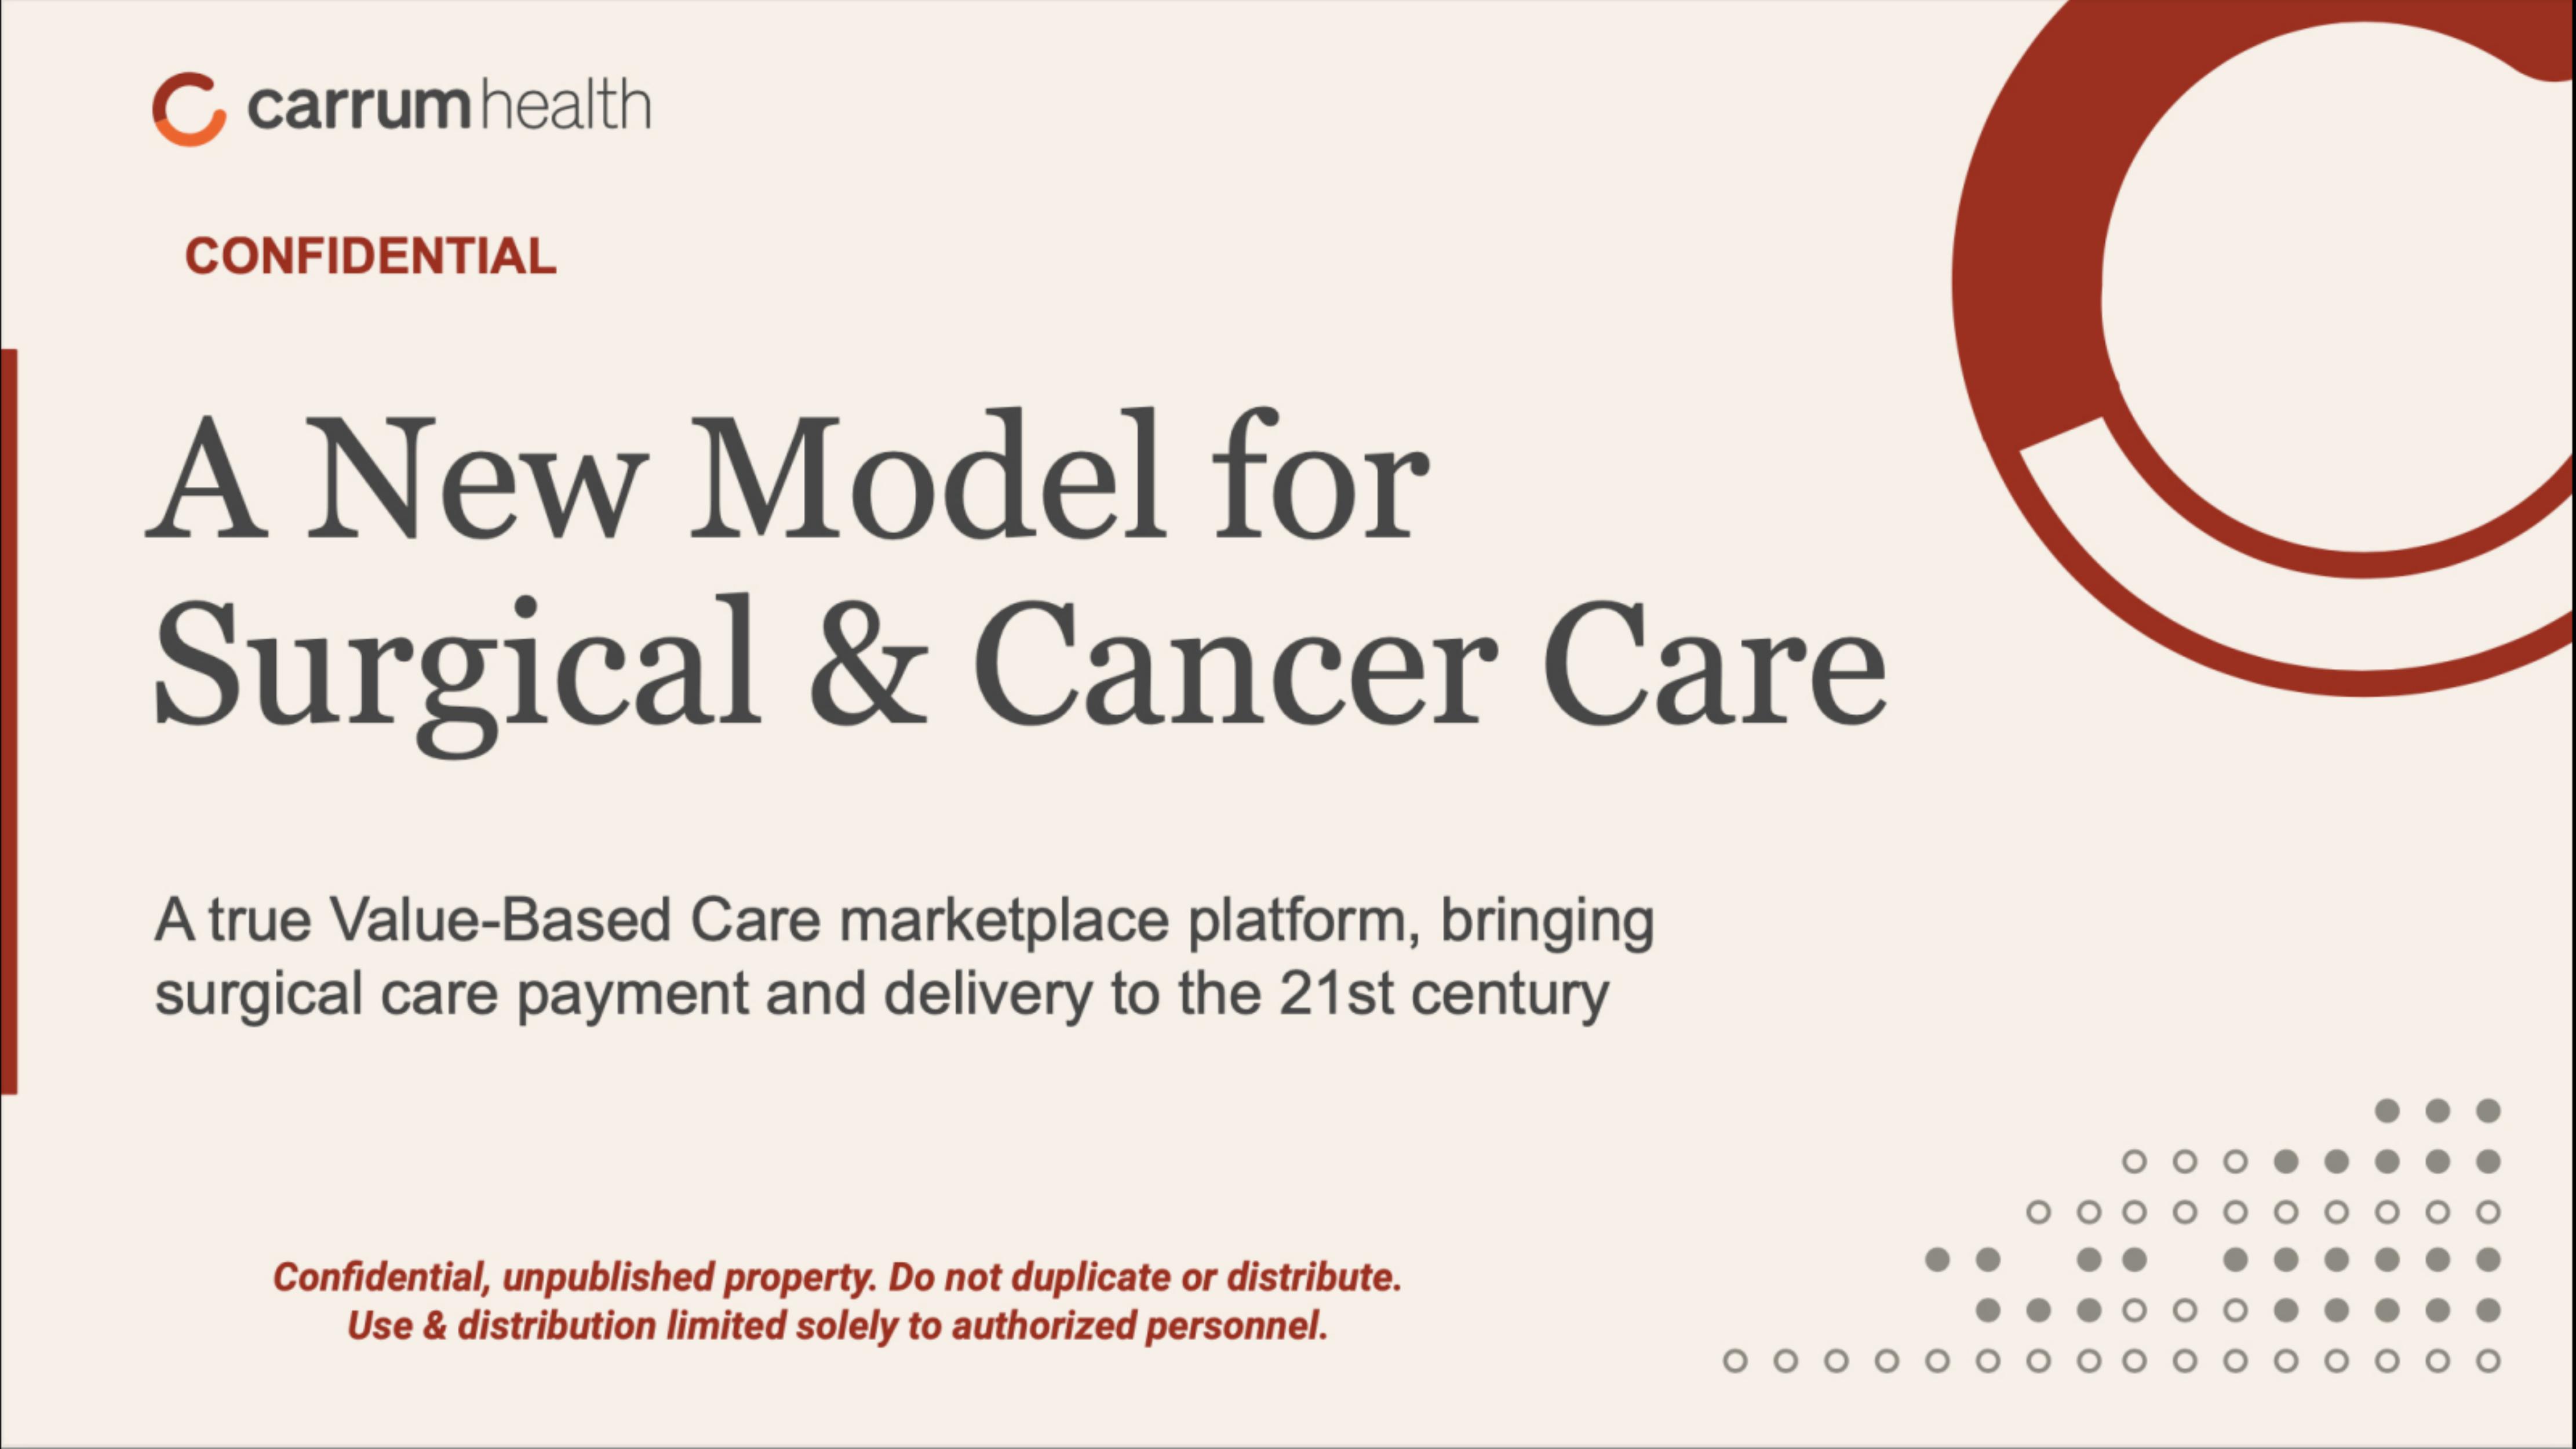
Value-based care marketplace connecting self-insured employers to top-tier surgical and oncology Centers of Excellence (COEs) via all-inclusive bundled payments.



professionals from Deloitte
Used by professionals from






About this model
Carrum Health connects self-insured employers to surgical and oncology Centres of Excellence through all-inclusive bundled payments. Employers pay one episode price, providers are paid immediately, patients pay nothing out of pocket, and Carrum supplies care navigation, support, AI matching, and data infrastructure.
The company began with musculoskeletal care and is expanding into bariatrics, oncology, cardiac, women’s health, and mental health. It earns a fee on each facilitated bundled episode, while partner integrations with Accolade, Hinge Health, Included Health, Sword, and GRAIL can expand distribution and specialty volume.
A RAND study evaluated more than 2,300 surgeries and found $16,000 savings per surgery, 30% surgical avoidance, less than 45% unit-cost savings, and an 80% readmission reduction. The model should build employers, covered lives, eligible episodes, bundle revenue, provider payouts, savings share, and renewals; no price or employer count is disclosed.
A turnkey financial model
Live formulas, no hardcoded values
Outputs are driven by live formulas, so the workbook updates from its assumptions instead of relying on hardcoded results.
All assumptions in one tab
Inputs are clearly marked in the Assumptions tab and separated from calculations, making it clear what to change and what to leave intact.
Statements always balancing
For integrated-statement models, the balance sheet, cash flow, and supporting schedules tie through properly.
Distinct schedules for clarity
Debt, working capital, taxes, and cash flow can get messy quickly. We group calculations in clear schedules, not across disconnected tabs.
No hidden macros or external links
There are no unexplained external workbook links or macros to undermine auditability or portability.
Changes flow through the model
Update a key driver and see the impact carry through the forecast, financing, and return outputs. We never use hardcoded numbers in formulas.
About Carrum Health
How to build a detailed financial model for Carrum Health
A complete walkthrough of the business, drivers, and assumptions behind the downloadable Carrum Health model - distilled from its pitch deck and publicly available information.
Product & value proposition
- Replaces fee-for-service surgical billing with all-inclusive single-price bundles, covering the full episode of care with a warranty.
- Employer pays one bundled price; provider COE is paid immediately; patient pays zero out-of-pocket.
- Carrum operates the marketplace platform: member navigation, care specialist support, AI-driven matching, and data infrastructure.
- Expanding from Musculoskeletal (original beachhead - knee replacement) to: Bariatrics, Oncology, Cardiac, Women's Health, Mental Health.
- Oncology offering adds: screening & detection, expert guidance, and a value-based oncology COE network.
- Strategic partnerships (Accolade, Hinge Health, Included Health, Sword, GRAIL, etc.) to embed Carrum within existing benefit stacks and simplify employer procurement.
Market
- Surgical and complex care = 10% of employer members but 50% of total employer health spend = $400B addressable spend.
- Cancer is the #1 condition driving employer health cost per BGH Survey 2023: cited by 83% of employers vs. MSK 76%, Cardio 39%.
- <1% of employees receive a cancer diagnosis yet account for 12–15% of total employer medical spend.
- 50% of employers plan to adopt COEs as their primary cancer strategy (BGH Survey 2023).
- No explicit SAM or SOM figures provided; no market CAGR cited.
Revenue model
- Bundled payment take-rate: Carrum earns a fee on each bundled surgical episode. The exact take-rate % or PEPM (per-employee-per-month) fee structure is not disclosed in the deck.
- Unit of volume: number of surgical/oncology cases facilitated per year across contracted employer lives.
- Channel: direct enterprise sales to self-insured employers (1K–100K+ member employers); augmented by benefit-consultant and strategic-partner distribution.
- Expansion lever: same employer contract, more specialties → higher case volume per covered life without incremental sales cost.
- No pricing table, PEPM rate, or explicit revenue per case shown in deck.
Traction & metrics
- RAND Corporation peer-reviewed study (Health Affairs, March 2021): 2,300+ surgeries evaluated across employers with 1K–100K members.
- $16K savings per surgery vs. baseline cost.
- 30% surgical avoidance rate (appropriateness filtering).
- <45% unit cost savings per surgery.
- 80% readmission reduction.
- Patient NPS: <10 under legacy model (framing the problem, not Carrum's NPS).
- 1/4 of surgeries deemed unnecessary under legacy model.
- No revenue figures, ARR, employer count, covered-lives count, or growth rates disclosed in the deck.
Unit economics
- $16K savings per surgery (employer savings, not Carrum revenue).
Competition / moat
- Framing: surgical and complex care is "largely untouched by digital health" - primary/chronic care is crowded; surgical is the white space.
- Moat sources cited: proprietary outcomes data ("unparalleled, growing data foundation"), AI-driven matching, growing COE network, and third-party RAND validation.
- Analogy used: Amazon (started in books → everything); Carrum started in MSK → full surgical care offering.
Team & funding ask / use of funds
- Team:
- Sach Jain - Founder & CEO
- Brent Nicholson - Co-Founder & Chief Partner Officer
- Brook West - Chief Commercial Officer
- Pallav Sharda - Chief Platform Officer
- Wes Bailey - Chief Technology Officer
- Christoph Dankert - Chief Network Officer
Recommended financial model
- Archetype + why: Employer benefits marketplace / bundled-payment intermediary. Best modelled as a volume × take-rate revenue model (analogous to a marketplace GMV model), layered onto a 3-statement operating P&L. Revenue = cases facilitated × average bundle value × Carrum take-rate %. Employer-count and covered-lives funnel drives case volume. Not a SaaS ARR model - revenue is transaction-based per episode, not subscription-recurring - though PEPM access fees could exist if later confirmed.
- Forecast horizon & granularity: 5 years (Year 1–5), annual columns. Monthly build in Year 1 if cash runway is a concern (no raise details disclosed, so annual is sufficient absent that context).
- Key drivers & assumptions:
- Number of employer clients
- Average covered lives per employer]
- Surgical case incidence rate (cases per 1,000 covered lives per year)
- Surgical avoidance rate: 30% - reduces gross cases to net cases facilitated
- Average bundle value (gross claim cost per surgery) pending confirmation]
- Carrum take-rate on bundle
- Specialty mix shift: MSK dominant in Y1, adding Oncology/Bariatrics/Cardiac by Y3 - oncology cases carry higher average bundle value
- Headcount / OpEx growth
- Gross margin
- Partner revenue share (if any PEPM or channel fees paid to Accolade, Included Health, etc.)
- Scenarios (Base / Bull / Bear - which variables flex):
- Base: 40% YoY employer growth, 15 cases/1,000 lives, 10% take-rate, MSK + Oncology by Y3.
- Bull: 60% employer growth, faster specialty ramp (Oncology Y2), take-rate expands to 12% as data moat strengthens.
- Bear: 20% employer growth, surgical avoidance reduces billed cases further, take-rate compressed to 8% by competitive pressure, Oncology delayed to Y4.
- Required sheets / outputs:
- Assumptions - all drivers in one editable table (color-coded inputs)
- Employer & Lives Funnel - employer count, covered lives, gross cases, net cases after avoidance
- Revenue Build - cases × bundle value × take-rate by specialty (MSK, Oncology, Bariatrics, Other)
- Income Statement - revenue, COGS (Care Specialists, tech ops), gross profit, S&M, R&D, G&A, EBITDA
- Cash Flow - operating CF; no balance sheet strictly needed unless fundraise context is added
- Scenario Toggle - Base / Bull / Bear switch feeding all sheets
- KPI Dashboard - employer count, covered lives, cases facilitated, revenue per case, gross margin %, EBITDA margin %
Frequently asked
Is the Carrum Health financial model free?+
Yes. The Carrum Health model is a free Excel (.xlsx) download with live formulas. Sign up with your email and the workbook is yours to keep, review, and edit.
What's included in the model?+
A 5-year monthly forecast with P&L, cash flow and runway, valuation (exit multiple plus a DCF cross-check), MOIC/IRR returns, and unit economics, with live formulas throughout.
How was this model built?+
It was built from Carrum Health's pitch deck and publicly available information, then structured to investment-banking standards as a fully editable Excel model.
Can I change the assumptions?+
Yes. You can change assumptions and the live formulas will recalculate in the downloadable Excel model.
Have more financial modelling questions? Contact us

Created by ex-finance professionals
Hey, I’m Alex and I created Finamodel.
Over my years in the finance industry I kept building the same models over and over again. Same structure, same assumptions, different logo. So I started building frameworks to turn them into clean, reusable templates.
Every model here is one I’d actually use for a client, and I personally vet each one before it goes up.
I’m not an expert in every industry, but I’ve built enough models to know what belongs in one. And when something is completely foreign to me, I reach out to my network for experts to work on our models with us.
Having a template library on hand cuts a first build from hours to minutes.
Need help finding your model? You’ll find me in the Finamodel app!
Other Biotech/Pharma Startup Financial Models
Browse another startup in the same category.

Ada Health
AI-powered symptom assessment app and clinical decision-support platform for consumers and healthcare partners.
Affini-T
Engineered T cell therapies targeting oncogenic driver mutations (KRAS, p53) in hard-to-treat solid tumors

Alto Pharmacy
Alto Pharmacy is a tech-enabled, same-day prescription delivery pharmacy disrupting the $450B US pharmacy market via a direct-to-patient courier model and provider-facing software platform.

Aphea.Bio
Aphea.Bio is a Belgian ag-biotech company developing and commercialising microbial biologicals (biostimulants, biofungicides, bioherbicides, bioinsecticides) for row crops, targeting yield improvement and reduced synthetic input use.

Aurion Biotech
Cell therapy company developing an injectable corneal endothelial cell treatment to restore vision in patients with corneal endothelial disease.

Beckley Psytech
Clinical-stage psychedelic drug development platform advancing a pipeline of psychedelic compounds (psilocybin, 5-MeO-DMT, NCEs) as licensed pharmaceutical medicines for neuropsychiatric disorders.

BrightInsight
Regulated digital health platform-as-a-service for biopharma and medtech companies to build, launch, and maintain compliant connected-drug and medical-device software products.

Castor
SaaS platform enabling self-service decentralized clinical trials (DCT) for pharma, biotech, and research institutions.


