 Cowboy Financial Model
Hardware/Deep-tech Startup Financials (Free Excel Download)
Belgian DTC e-bike company selling connected electric bikes with a companion app and recurring subscription services



professionals from Deloitte
Used by professionals from






About this model
Cowboy is a Belgian direct-to-consumer connected e-bike company with a companion app and recurring services. Its proposition combines premium urban mobility hardware with software-led ownership, allowing the company to extend the customer relationship beyond the initial bicycle purchase.
The economics blend hardware and service. Bikes sold and average selling price establish the installed base, while subscriptions, service, and potentially financing can deepen lifetime value; inventory, warranty, delivery, and acquisition cost can quickly erode margin if demand or operations are misjudged.
Model bikes sold by market, ASP, hardware gross margin, subscription attach, service revenue, installed base, and repeat or referral activity. Include manufacturing, shipping, inventory, warranty, retail or DTC marketing, app operations, and support costs. Demand growth, price, gross margin, subscription penetration, CAC, service cost, and retention should drive scenarios.
A turnkey financial model
Live formulas, no hardcoded values
Outputs are driven by live formulas, so the workbook updates from its assumptions instead of relying on hardcoded results.
All assumptions in one tab
Inputs are clearly marked in the Assumptions tab and separated from calculations, making it clear what to change and what to leave intact.
Statements always balancing
For integrated-statement models, the balance sheet, cash flow, and supporting schedules tie through properly.
Distinct schedules for clarity
Debt, working capital, taxes, and cash flow can get messy quickly. We group calculations in clear schedules, not across disconnected tabs.
No hidden macros or external links
There are no unexplained external workbook links or macros to undermine auditability or portability.
Changes flow through the model
Update a key driver and see the impact carry through the forecast, financing, and return outputs. We never use hardcoded numbers in formulas.
About Cowboy
cowboy.com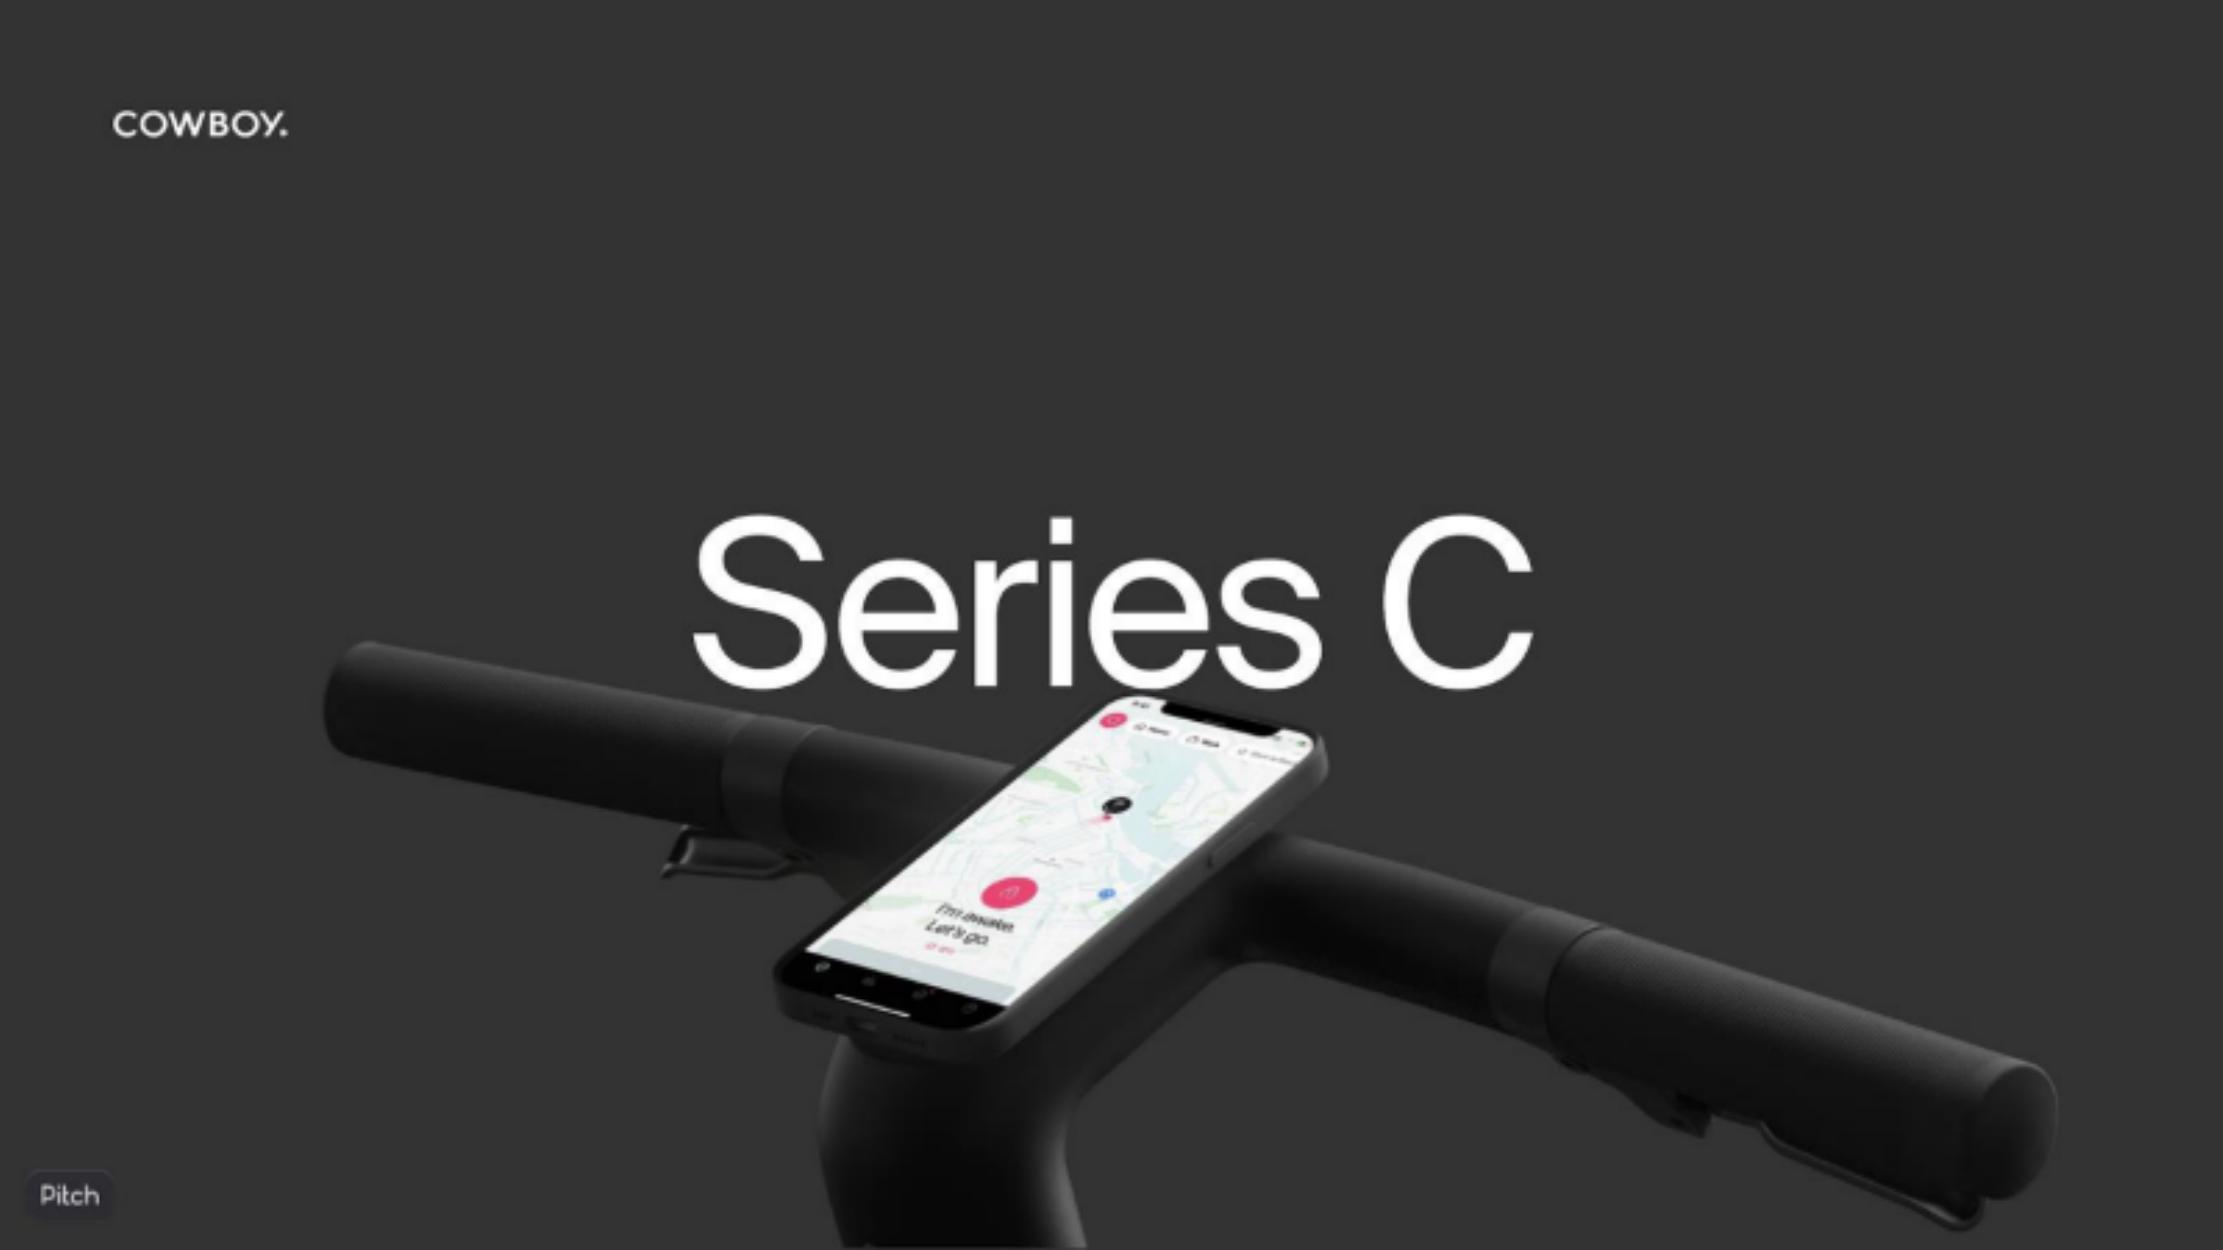
How to build a detailed financial model for Cowboy
A complete walkthrough of the business, drivers, and assumptions behind the downloadable Cowboy model - distilled from its pitch deck and publicly available information.
Product & value proposition
- Hero product: Cowboy 4 e-bike - Red Dot "Best of the Best" winner 2019 & 2021
- Key hardware differentiators: iconic design, automatic transmission, removable battery, wireless charging
- Integrated companion app (iOS/Android): bike unlock/key, GPS tracking, route mapping, crash detection, brake lights, ride analytics (25+ data points/sec), social leaderboard, community features
- Value claims: 2x faster than cars in large cities, 10x smaller carbon footprint per mile vs. car, psychological health boost
- 70%+ bikes recovered after theft via "Find My Bike"
- Test rides delivered direct to door in 75+ cities worldwide
Market
- TAM stated as $800bn+ - no methodology or source breakdown shown for this figure; cited as "Huge TAM supported by generational shift in user habits"
- Supporting macro context cited (not quantified as SAM/SOM):
- 60% of car trips are below 5 miles
- Average city traffic speed <10 mph in large European cities
- 22% of global GHG emissions from transportation
- Cities investing heavily in cycling infrastructure (Paris, Amsterdam, Brussels, New York)
Revenue model
Three revenue streams explicitly stated:
- Bike sales (hardware) - primary revenue; ASP not disclosed in deck
- Accessory sales - mentioned as a revenue stream; pricing not disclosed
- Subscription services (recurring revenue):
- Theft insurance: €10/month - launched 2019
- Cowboy Care (all-inclusive maintenance): €20/month - launched 2021
Channel: Direct-to-consumer (DTC) - own website/app; test rides delivered to door; no retail channel mentioned explicitly though "Retail" section header appears on slide 25
Traction & metrics
- 100,000 Riders (target by 2023) - note: framed as a goal, not confirmed current figure
- $80m Series C raised
- 70+ NPS overall
- 76 NPS test ride experience; 70 NPS after-sales experience
- 12 countries (Europe + US)
- 75+ cities for direct test rides
- 70% bike recovery rate after theft using Find My Bike
Unit economics
- "Strong unit economics" and "increasing average revenue per user" referenced - no figures provided
Competition / moat
Moat framing from deck:
- Superior product: best ride-feel + connected app (claimed industry leader)
- Strong brand: aspirational + 70+ NPS
- Network effects: connected community/leaderboard creates switching costs and viral loops
- Built to scale: proven go-to-market + robust manufacturing and supply chain
- Red Dot "Best of the Best" design awards (2019, 2021) as external validation
Team & funding ask / use of funds
Team:
- Adrien Roose - Founder / CEO
- Tanguy Goretti - Founder / VP Software
- Karim Slaoui - Founder / VP Hardware Tech
- Alexander Cram - CFO (prior: Onfido)
- Benoit Simeray - CMO (prior: Jawbone)
- Vincent de Gaultier - VP Manufacturing (prior: Toyota)
- Marsha Meredith - VP Creative (prior: Aesop)
- Charles Van Haverbeke - VP Operations (prior: Uber)
- Ross McCallum - VP Hardware Engineering (prior: Philips)
Funding history: | Round | Amount | Lead investor | | -- | -- | -- | | Pre-Seed | $0.8m | Hardware Club / HCVC | | Seed | $2.8m | Index Ventures (Martin Mignot) | | Series A | $11m | Tiger Global (Lee Fixel) | | Series B | $26m | Exor Seeds (Noam Ohana) | | Series C | $80m | Siam Capital (Sita Chantramonklasri) |
Total raised: ~$120.6m across all rounds
Recommended financial model
Archetype + why: DTC hardware + subscription ("razor-and-blade" variant). Primary model should be a 3-statement operating model with a dedicated subscription ARR build layered on top. Revenue splits across: (1) hardware (bike + accessories - one-time), (2) subscription (theft insurance + Cowboy Care - recurring MRR/ARR). The subscription layer is the key long-term value driver and needs its own cohort logic. This is not M&A or SPAC.
Forecast horizon & granularity:
- 5 years (2022–2026), monthly for Y1–Y2, quarterly for Y3–Y5
- Series C context implies investor wants to see path to profitability and subscription scale
Key drivers & assumptions:
*Volume*
- Bike unit sales (starting base): ~20,000–30,000 units/year at time of deck (Series C, 100k rider target by 2023 implies ~60–80k cumulative riders at raise; growth rate to be modelled)
- Unit growth rate Y1–Y5: 40% YoY Y1–Y2, stepping down to 25% Y3, 15% Y4–Y5 - consistent with Series C growth-stage hardware company; needs validation against actual prior-year data not provided
- Geography mix: 80% Europe / 20% US at start, shifting toward 50/50 by Y5 given Series C narrative
*Pricing*
- ASP (bike): ~€2,000–2,500 (Cowboy 4 is premium urban e-bike; comparable DTC e-bikes; no deck figure)
- Accessories attach rate and ASP: 15% of bike buyers purchase accessories, ~€100 average basket
- Theft insurance: €10/month
- Cowboy Care maintenance: €20/month
*Subscription*
- Subscription attach rate (% of riders on at least one plan): 30% at launch, growing to 55% by Y5 - no actuals in deck
- Mix theft vs. care: 60/40 theft/care initially (insurance launched 2019 has head start)
- Churn rate: 8% annual - no actuals in deck; benchmark for hardware-linked subscription
*Unit economics*
- Hardware gross margin: 30–35% - DTC premium e-bike; no COGS disclosed
- Subscription gross margin: 65–70% - primarily software + insurance underwriting cost + maintenance labour
- Blended gross margin improves as subscription mix grows
*Cost structure*
- S&M: 20–25% of revenue (DTC brand with test-ride program in 75+ cities is expensive to operate)
- R&D: 12–15% of revenue (ongoing hardware + app investment)
- G&A: 8–10% of revenue
- Manufacturing / COGS: per hardware margin assumption above
Scenarios (Base / Bull / Bear - which variables flex):
- Base: 40% unit volume growth Y1, 30% attach rate on subscriptions, €2,200 ASP, 32% hardware GM
- Bull: 55% unit growth (US scales faster), 50% attach rate by Y3, ASP holds, subscription churn 5%
- Bear: 25% unit growth (supply chain / macro), 20% attach rate, ASP pressure to €1,900, hardware GM 27%
Required sheets / outputs:
- Assumptions dashboard (all drivers in one place)
- Revenue build - three streams: bikes, accessories, subscriptions (with cohort/attach waterfall)
- Subscription ARR bridge (new ARR, churn, expansion, net ARR)
- COGS & gross profit by revenue stream
- Opex detail (S&M, R&D, G&A, headcount)
- Income statement (P&L)
- Balance sheet
- Cash flow statement (with capex for manufacturing tooling)
- KPI summary: units sold, cumulative riders, subscribers, ARPU, LTV/CAC (when CAC data available), NPS (qualitative)
- Scenario toggle (Base / Bull / Bear)
Frequently asked
Is the Cowboy financial model free?+
Yes. The Cowboy model is a free Excel (.xlsx) download with live formulas. Sign up with your email and the workbook is yours to keep, review, and edit.
What's included in the model?+
A 5-year monthly forecast with P&L, cash flow and runway, valuation (exit multiple plus a DCF cross-check), MOIC/IRR returns, and unit economics, with live formulas throughout.
How was this model built?+
It was built from Cowboy's pitch deck and publicly available information, then structured to investment-banking standards as a fully editable Excel model.
Can I change the assumptions?+
Yes. You can change assumptions and the live formulas will recalculate in the downloadable Excel model.
Have more financial modelling questions? Contact us

Created by ex-finance professionals
Hey, I’m Alex and I created Finamodel.
Over my years in the finance industry I kept building the same models over and over again. Same structure, same assumptions, different logo. So I started building frameworks to turn them into clean, reusable templates.
Every model here is one I’d actually use for a client, and I personally vet each one before it goes up.
I’m not an expert in every industry, but I’ve built enough models to know what belongs in one. And when something is completely foreign to me, I reach out to my network for experts to work on our models with us.
Having a template library on hand cuts a first build from hours to minutes.
Need help finding your model? You’ll find me in the Finamodel app!
Other Hardware/Deep-tech Startup Financial Models
Browse another startup in the same category.

ANYbotics
ANYbotics builds and sells autonomous legged inspection robots (ANYmal) for industrial facilities, targeting oil & gas, chemicals, power, offshore, mining, and manufacturing sectors.
Awake Security
Awake Security - AI-driven Network Detection & Response (NDR) platform for the hybrid cloud, positioning as the "intent detection" layer of the SOC visibility triad.

Beem
AR communications platform that overlays full-body "hologram" video of a person into the recipient's physical space via smartphone or web.

Blue White Robotics
Autonomous robotics platform converting existing farm equipment to self-driving tractors for permanent-crop growers, sold as Robots-as-a-Service.

Cambridge GaN Devices
Fabless semiconductor startup commercialising self-protected GaN power transistors (HiGaN) that replace silicon and standard GaN with higher efficiency and no external protection circuitry.

Canix
Cannabis-focused ERP (inventory tracking, compliance automation, sales management, yield forecasting) sold as SaaS to cannabis cultivators, manufacturers, and distributors.
Chobani
Chobani is the US market leader in Greek yogurt; TPG invested $671M in April 2014 for a 35% stake via a structured second lien + equity deal
Cipher Skin
Wearable sensor mesh platform that collects dense multi-modal data from human bodies and industrial objects to predict structural and functional failure before it occurs.


