 Narrative Financial Model
Marketplace Startup Financials (Free Excel Download)
B2B data marketplace and operating system that lets enterprises buy and sell data directly, replacing brokers and manual processes.



professionals from Deloitte
Used by professionals from






About this model
Narrative is a B2B data marketplace and operating system for enterprises that want to buy and sell data directly. It handles discovery, compliance, contracts, integration, pricing, and reporting, replacing opaque data brokers and manual internal processes.
The marketplace had 31 sellers and 28 buyers at the time of the deck. Its commercial model centers on transaction fees or take rate on data exchanged through the platform, with potential additional revenue from partner channels and applications built on the underlying infrastructure.
The model builds data transaction volume from active sellers, buyers, datasets, contract conversion, and average deal value. A take rate creates marketplace revenue, with any platform-license income modeled separately. Market liquidity, repeat purchasing, compliance cost, partner contribution, and enterprise sales cycles are the major forecast drivers.
A turnkey financial model
Live formulas, no hardcoded values
Outputs are driven by live formulas, so the workbook updates from its assumptions instead of relying on hardcoded results.
All assumptions in one tab
Inputs are clearly marked in the Assumptions tab and separated from calculations, making it clear what to change and what to leave intact.
Statements always balancing
For integrated-statement models, the balance sheet, cash flow, and supporting schedules tie through properly.
Distinct schedules for clarity
Debt, working capital, taxes, and cash flow can get messy quickly. We group calculations in clear schedules, not across disconnected tabs.
No hidden macros or external links
There are no unexplained external workbook links or macros to undermine auditability or portability.
Changes flow through the model
Update a key driver and see the impact carry through the forecast, financing, and return outputs. We never use hardcoded numbers in formulas.
About Narrative
narrative.io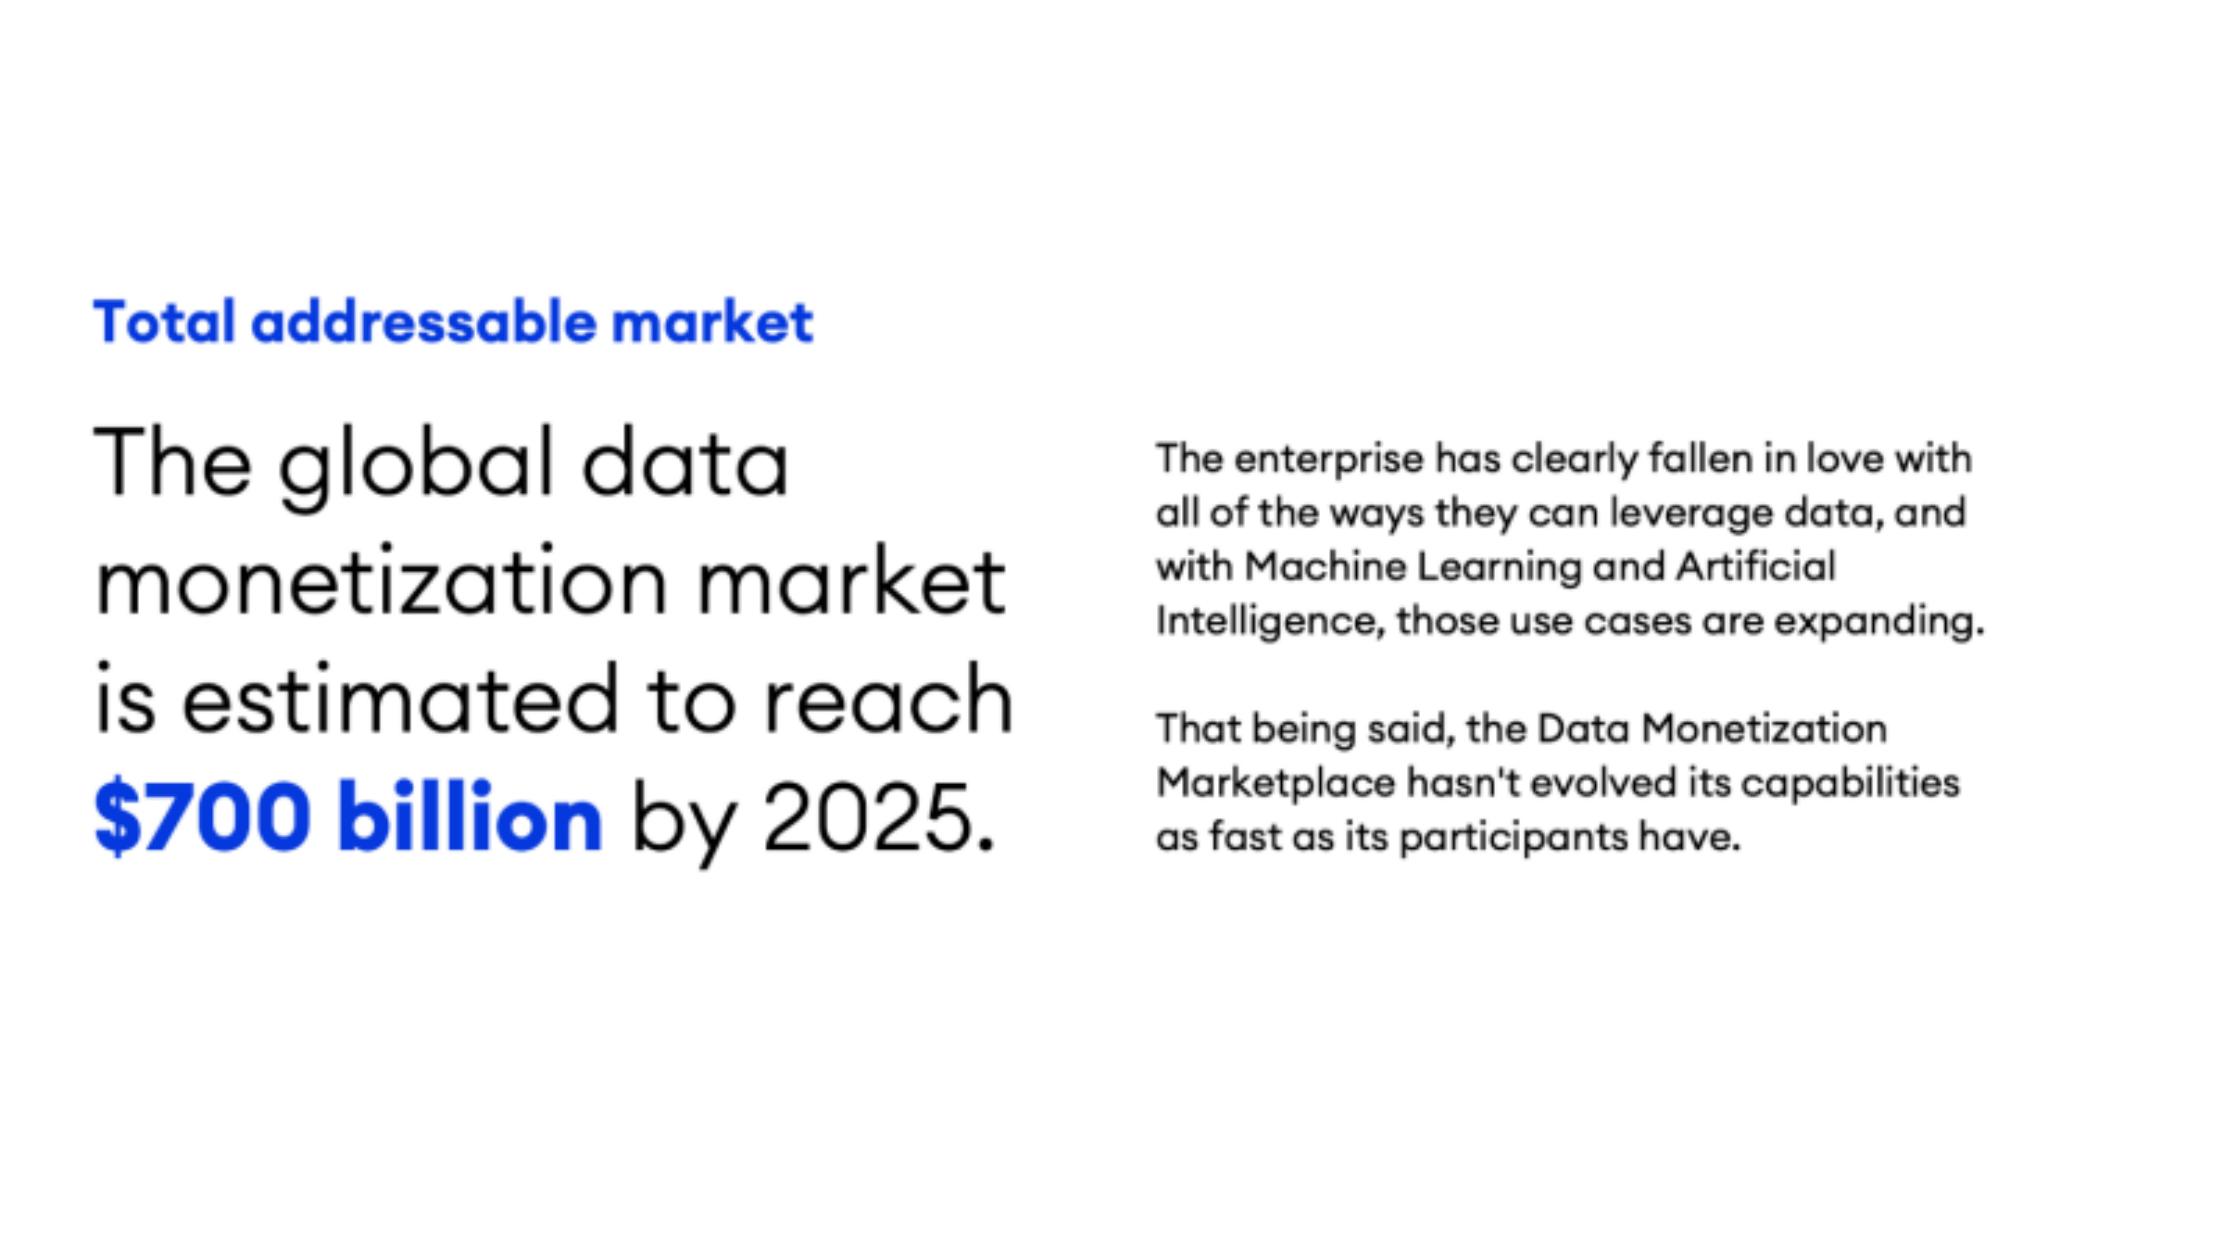
How to build a detailed financial model for Narrative
A complete walkthrough of the business, drivers, and assumptions behind the downloadable Narrative model - distilled from its pitch deck and publicly available information.
Product & value proposition
Narrative is a data operating system that automates the full lifecycle of data transactions - discovery, compliance, contracting, integration, pricing, reporting. It eliminates data brokers (opaque margins, lock-in) and in-house builds (expensive, slow, non-scalable) by providing:
- A Federated Data Lake for atomic-level data storage and processing.
- A marketplace for one-to-many seller-to-buyer data transactions.
- Private deal infrastructure for one-to-one agreements.
- Onboarding workflows, pricing tools, and reporting for both sellers and buyers.
- A third-party application ecosystem built on top of Narrative APIs/infrastructure.
- A productized AI feature ("Discover Assistant") that uses Pointwise Mutual Information to identify correlated attributes in a buyer's seed data, surfacing relevant data sources automatically.
Market
- TAM: Global data monetization market estimated at $700 billion by 2025.
- Growth rate: Not quantified in deck; narrative context references expanding ML/AI use cases as demand driver.
Revenue model
- Primary model: Marketplace take-rate / transaction fee on data bought and sold through the platform. The deck references pricing tools on the sell side and a marketplace clearing mechanism.
- Secondary: Channel partners on both buy and sell sides suggest a revenue-share or referral layer.
- Tertiary: Third-party applications built on Narrative's platform suggest a potential platform/API licensing revenue stream.
Traction & metrics
- Marketplace participants: 31 sellers, 28 buyers on the marketplace at time of deck.
- Revenue: Chart shows net revenue growth from Q3-2018 (first quarter of revenue) through Q2-2019 (actual), with consistent QoQ growth across 4 quarters.
- Note: Y-axis has no dollar values - bars show relative growth only; no absolute revenue figures disclosed.
- Product in-market: Discover Assistant feature confirmed "Live in the platform."
- Example customer use case: Uber (Uber Drivers / Uber Eats seed data, 2,340,830 observations, PMI score 0.638).
Competition / moat
- Competitive alternatives framed as: (1) data brokers and (2) in-house builds - both positioned as inferior.
- Named competitors placed on a 4-axis landscape (Transparency / Liquidity / Fidelity / Autonomy): Enigma, Crux Informatics, LiveRamp, Dawex, Twitter, Segment, Bidswitch, Oracle, Data.world.
- Narrative claims to be the only player covering all four pillars simultaneously.
- Moat: Federated Data Lake (network effects as more sellers/buyers join), atomic-level data fidelity, automation of a previously 6-month manual cycle.
Team & funding ask / use of funds
- Comparable exit data shown as market context: Datalogix/Oracle $1.2B; bluekai/Oracle $400M; LiveRamp/acxiom $310M; Epsilon/Publicis $4.4B; Krux/Salesforce $700M; DataPlusMath/LiveRamp $150M; Treasure Data/ARM $600M; arbor/LiveRamp $150M; acxiom/IPG $2.3B.
Recommended financial model
- Archetype + why: Marketplace GMV / take-rate model with SaaS layer overlay. Narrative earns on data transaction volume (GMV) at a take-rate, potentially supplemented by SaaS subscription fees for platform tooling. This is the correct archetype because revenue is driven by number of sellers × number of buyers × data transaction volume × take-rate, and the deck's traction metric (31 sellers, 28 buyers) directly maps to marketplace supply/demand dynamics.
- Forecast horizon & granularity: Quarterly for Years 1–2 (matching deck's own Q3-2018 to Q2-2020 cadence), annual for Years 3–5. Total 5-year model.
- Key drivers & assumptions:
- Marketplace sellers (starting 31); growth rate: ~15–20% QoQ in early growth phase, decelerating to ~5–8% QoQ by Year 3, based on typical two-sided marketplace ramp curves
- Marketplace buyers (starting 28); growth rate: slightly faster than sellers as demand side is easier to add once supply is established; ~20–25% QoQ early phase
- Take-rate / platform fee: 10–20% of GMV is a typical data marketplace range; requires management input
- Private deals: separate revenue stream; model as % of total GMV at higher margin (no marketplace fee sharing)
- Channel partner revenue share: negative adjustment to net revenue; typical 15–30% of gross fees shared
- COGS: data infrastructure (Federated Data Lake hosting, compute); high fixed-cost base, scaling sub-linearly - gross margins likely 60–75% at scale for SaaS/marketplace hybrids
- S&M: significant for enterprise sales (long cycle per slide 3's 6-month manual process analogy); model as % of revenue declining over time
- R&D: material given platform + data lake + AI feature development; model as % of revenue
- G&A: standard 10–15% of revenue
- Scenarios (Base / Bull / Bear - which variables flex):
- Base: Sellers +15% QoQ, Buyers +20% QoQ, take-rate 12%, average transaction value held flat
- Bull: Seller/Buyer growth +5pp vs. base; take-rate expands to 15% as network deepens; channel partner ecosystem multiplies GMV
- Bear: Seller/Buyer growth stalls (+5% QoQ); a major competitor (LiveRamp, Oracle) replicates features; take-rate compressed to 8%
- Required sheets / outputs:
- Assumptions dashboard (all drivers in one place)
- Marketplace model: sellers, buyers, active pairs, GMV build-up
- Revenue bridge: marketplace gross revenue → take-rate → channel share → net revenue
- P&L (Income Statement): Net revenue → Gross Profit → EBITDA → Net Income
- Simplified Cash Flow / Burn: operating cash flow, capex for data infra, runway
- Scenario toggle (Base / Bull / Bear)
- Comparable exits summary (from slide 11 data - valuation context for exits)
Frequently asked
Is the Narrative financial model free?+
Yes. The Narrative model is a free Excel (.xlsx) download with live formulas. Sign up with your email and the workbook is yours to keep, review, and edit.
What's included in the model?+
A 5-year monthly forecast with P&L, cash flow and runway, valuation (exit multiple plus a DCF cross-check), MOIC/IRR returns, and unit economics, with live formulas throughout.
How was this model built?+
It was built from Narrative's pitch deck and publicly available information, then structured to investment-banking standards as a fully editable Excel model.
Can I change the assumptions?+
Yes. You can change assumptions and the live formulas will recalculate in the downloadable Excel model.
Have more financial modelling questions? Contact us

Created by ex-finance professionals
Hey, I’m Alex and I created Finamodel.
Over my years in the finance industry I kept building the same models over and over again. Same structure, same assumptions, different logo. So I started building frameworks to turn them into clean, reusable templates.
Every model here is one I’d actually use for a client, and I personally vet each one before it goes up.
I’m not an expert in every industry, but I’ve built enough models to know what belongs in one. And when something is completely foreign to me, I reach out to my network for experts to work on our models with us.
Having a template library on hand cuts a first build from hours to minutes.
Need help finding your model? You’ll find me in the Finamodel app!
Other Marketplace Startup Financial Models
Browse another startup in the same category.

Acquco
Amazon brand aggregator - acquires third-party Amazon seller businesses at attractive multiples, then scales them via proprietary growth playbooks and technology.
Arive
Premium q-commerce app delivering lifestyle and branded products in under 30 minutes across German cities.

Audience Town
Vertical data and advertising platform targeting home movers across the entire home journey - pre-move through post-move.

AudioMob
Non-intrusive in-game audio ad platform bridging music/brand advertisers to mobile game publishers.

Authoritive
Two-way messaging platform that turns creator expertise into scalable, push-delivered learning experiences via SMS/WhatsApp.

Avo
Building amenity and office perk platform delivering same-day grocery/pantry/goods to residential and commercial tenants via a white-label marketplace.
beehiiv
Newsletter platform for creators to build, grow, and monetize email audiences - SaaS subscription + native ad network revenue.
Borzo
Global same-day logistics marketplace connecting B2B merchants with crowdsourced couriers for last-mile delivery


