SGSpire Global Financial Model
Hardware/Deep-tech Startup Financials (Free Excel Download)
NanoSatisfi (later Spire Global) - nanosatellite operator targeting communication and weather data applications via CubeSat-standard satellites.



professionals from Deloitte
Used by professionals from






About this model
NanoSatisfi, later Spire Global, operates CubeSat-standard nanosatellites for communication and weather-data applications. The company monetises satellite-derived data and infrastructure across commercial and government customers, turning an orbital constellation into recurring information products and mission services.
The economics require large upfront capital and technical execution. Satellites must be launched, operated, replenished, and converted into reliable datasets before subscription contracts scale; government and commercial deals can have different sales cycles, contract values, and renewal characteristics.
Model satellites launched, active constellation capacity, data subscriptions, contract value, renewals, and churn. Include satellite manufacturing, launches, ground operations, data processing, sales, and capex. Launch cadence, uptime, customer wins, contract pricing, renewal, operating cost, and capital availability should drive scenarios.
A turnkey financial model
Live formulas, no hardcoded values
Outputs are driven by live formulas, so the workbook updates from its assumptions instead of relying on hardcoded results.
All assumptions in one tab
Inputs are clearly marked in the Assumptions tab and separated from calculations, making it clear what to change and what to leave intact.
Statements always balancing
For integrated-statement models, the balance sheet, cash flow, and supporting schedules tie through properly.
Distinct schedules for clarity
Debt, working capital, taxes, and cash flow can get messy quickly. We group calculations in clear schedules, not across disconnected tabs.
No hidden macros or external links
There are no unexplained external workbook links or macros to undermine auditability or portability.
Changes flow through the model
Update a key driver and see the impact carry through the forecast, financing, and return outputs. We never use hardcoded numbers in formulas.
About Spire Global
spire.comenspirehome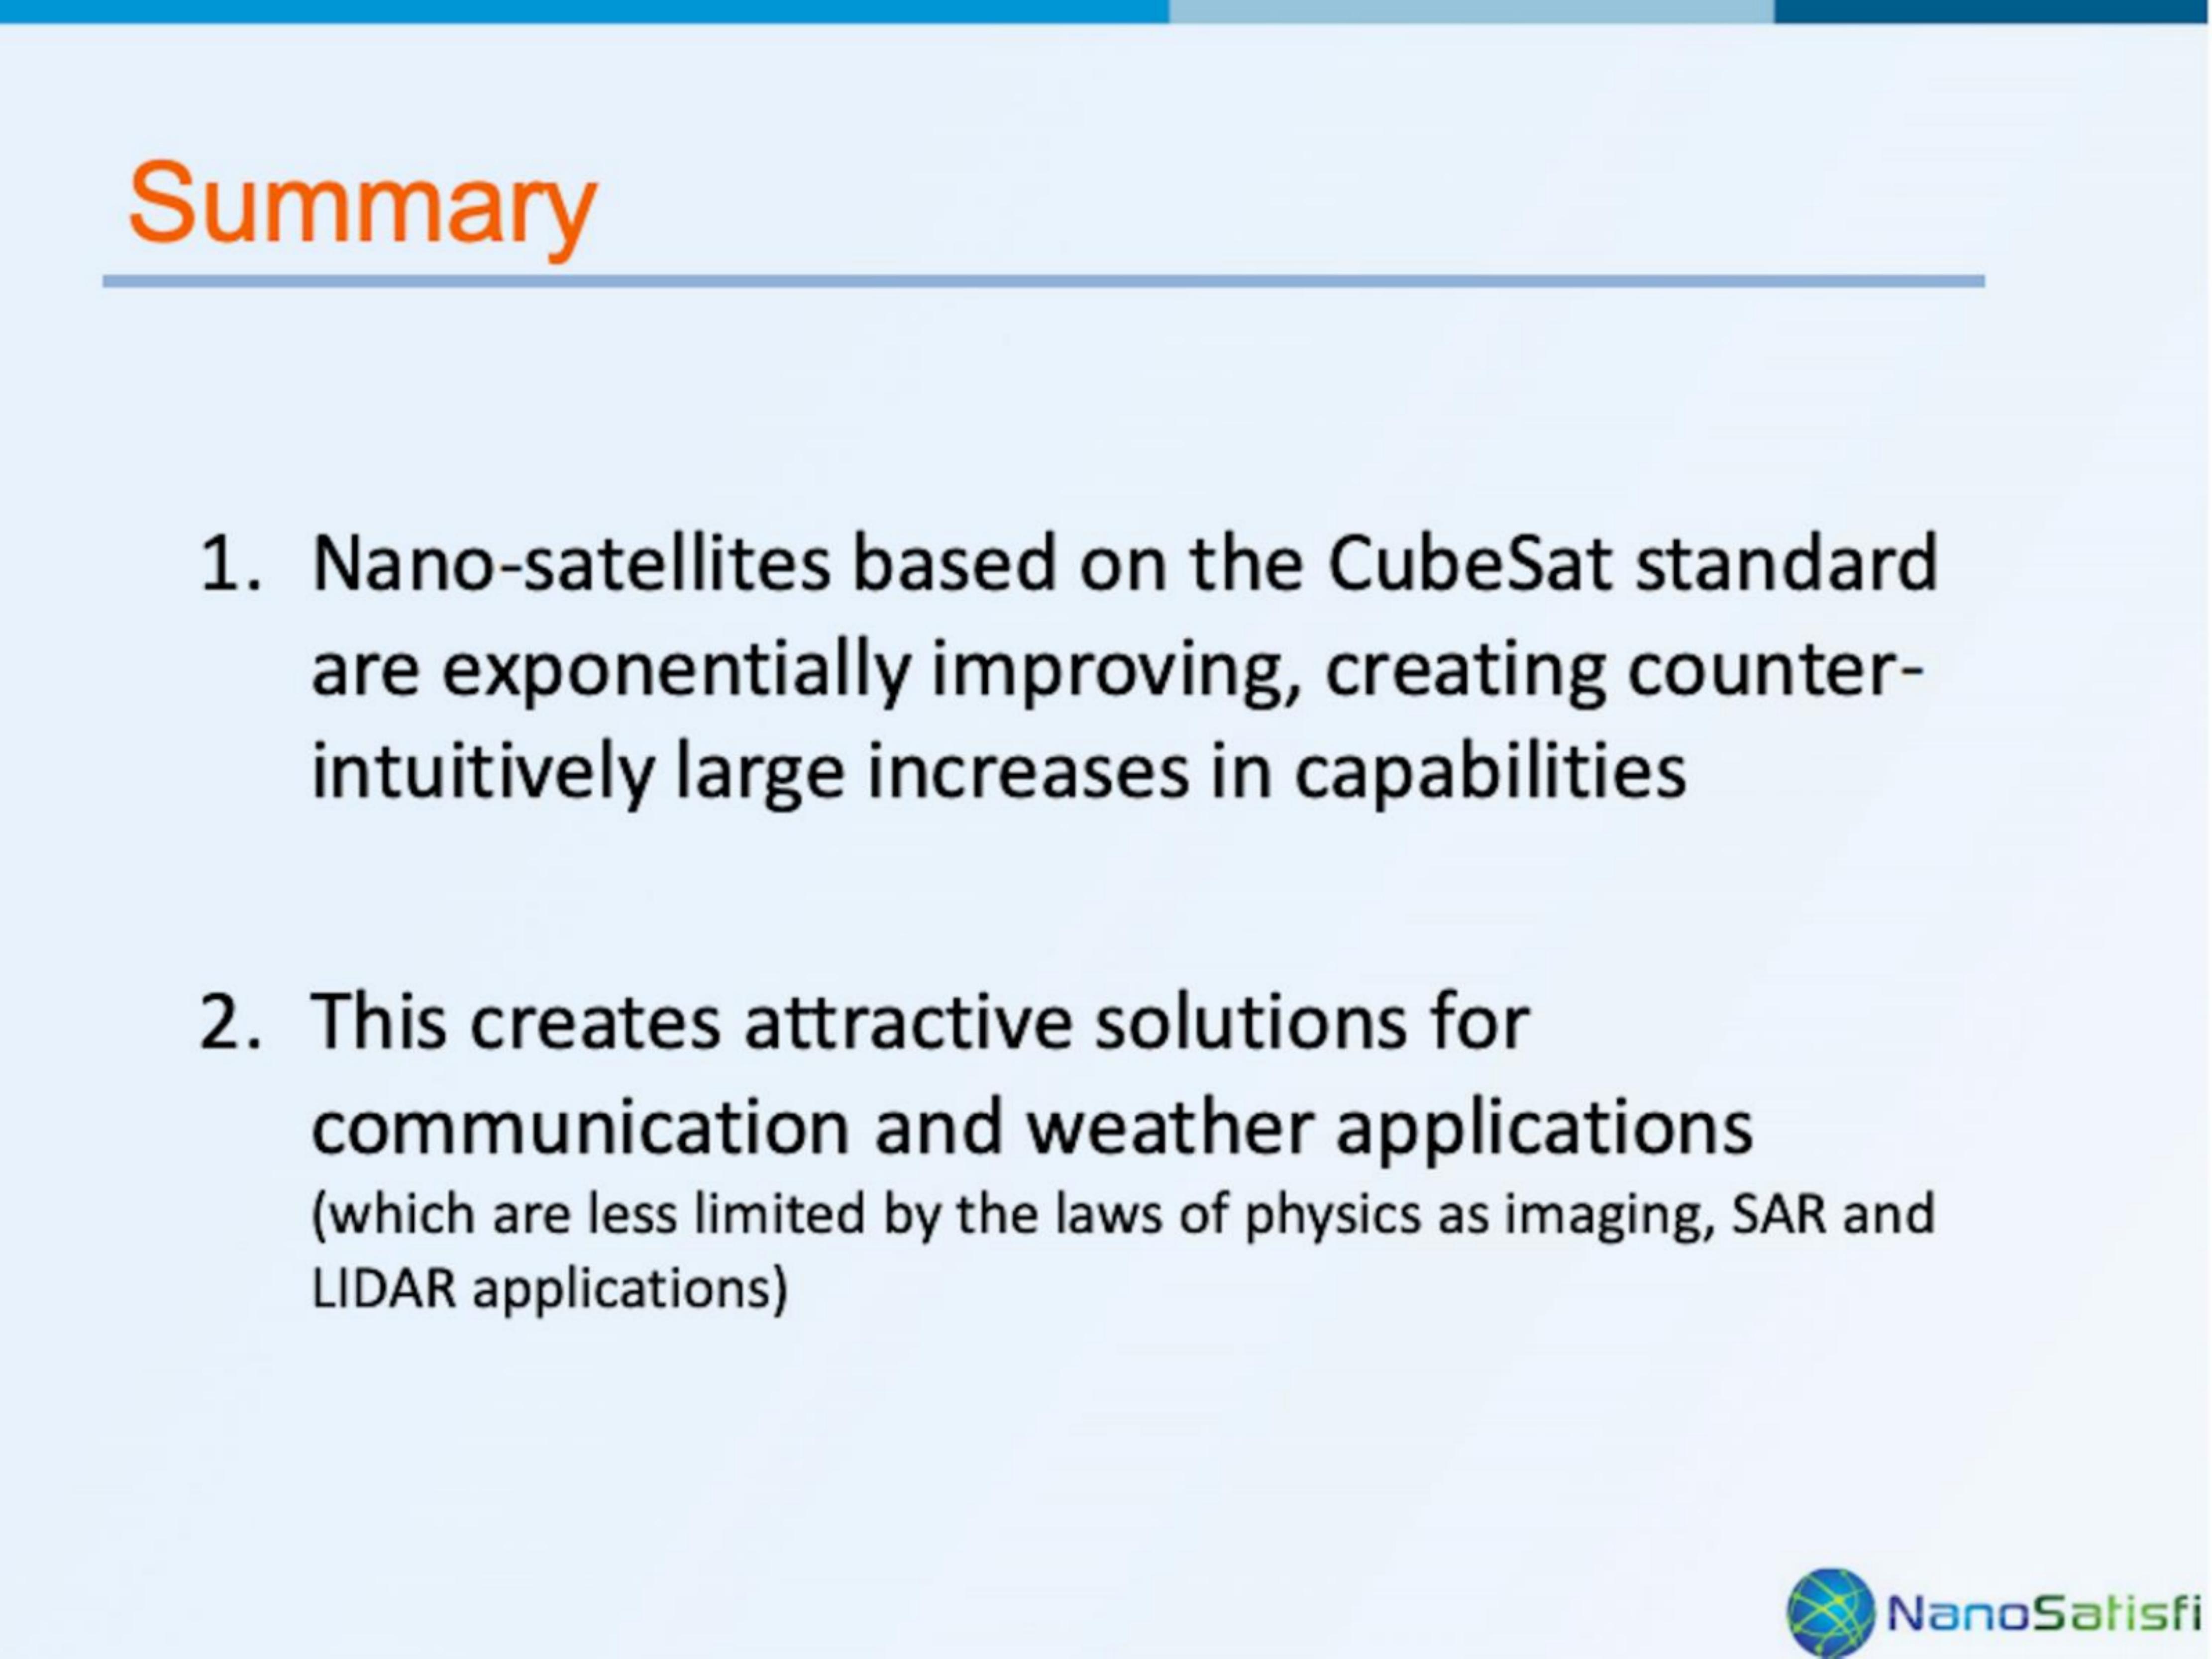
How to build a detailed financial model for Spire Global
A complete walkthrough of the business, drivers, and assumptions behind the downloadable Spire Global model - distilled from its pitch deck and publicly available information.
Product & value proposition
- CubeSat-standard nanosatellites (size of a wine bottle) providing communication and weather data.
- Core thesis: exponential improvement in CubeSat capabilities (bandwidth, power, memory, sensor price/performance) makes nanosatellites commercially viable for the first time.
- CubeSat standard (Stanford/CalPoly, 2001) enables piggyback launches on 12+ launch vehicles - no dedicated launch needed.
- Applications scoped to comms and weather data; imaging/SAR/LIDAR explicitly excluded as less suited to physics constraints of nanosats.
Traction & metrics
Context data points (technology backdrop, not company traction):
- ~125 CubeSats launched total across industry at time of deck.
- Forecasts of 120–190 annual nanosatellite launches by 2020 (SpaceWorks 2013).
- Available launch capacity: many hundreds of CubeSat slots per year across 14 launch vehicles.
Unit economics
Key cost reference (technology benchmarks, not company unit economics):
- Nano satellite all-in cost including launch: ~$500,000.
- vs. Mini satellite: $25M; vs. traditional satellite: $500M.
- Sensor price/performance improvement: ~1,000x over 2006–2012 (TNO Digital Sun Sensor: n/a → CubeSatShop component: €2,500; weight 475g → 5g; size 900.9 cm³ → 2.2 cm³).
Competition / moat
Not explicitly framed as competitive analysis. Implicit moat thesis:
- CubeSat standard commoditises satellite hardware; first-mover on constellation density and data contracts creates switching cost.
- Exponential capability curves (bandwidth 0.1→1→10 Mbit; power 1→10→100W; memory 0.1→10→1,000 GB, each 10x per era from 2000–2015) mean a well-capitalised operator can outpace legacy incumbents on cost and refresh cadence.
Team & funding ask / use of funds
Recommended financial model
- Archetype + why: Satellite constellation build-out model with data-subscription revenue (usage-based / contract-based DaaS). This is a capital-intensive infrastructure business followed by recurring data revenue - closest archetype is a capex-heavy infrastructure + SaaS revenue model. A 3-statement model with explicit satellite build/launch capex schedule, constellation ramp, and recurring data ARR is the right structure. Not a merger or SPAC deck.
- Forecast horizon & granularity: 5–7 years (Y1–Y7), annual columns. Monthly granularity for Years 1–2 if cash runway is a concern (constellation capex front-loaded). Satellites have multi-year build-to-revenue lead times.
- Key drivers & assumptions:
| Driver | Value / Source |
|---|---|
| Cost per nanosatellite (incl. launch) | $500,000 |
| Initial constellation size (Year 1) | 3–6 satellites; typical early CubeSat operator |
| Target constellation size (Year 5) | 20–50 satellites; based on constellation density needed for daily revisit |
| Satellite useful life | 3–5 years; typical LEO CubeSat orbital decay / degradation |
| Annual launch capacity available | Many 100s of CubeSat slots/yr across 14 vehicles; supply not a bottleneck |
| Revenue per data subscription (annual) | $100K–$500K per enterprise / government customer; not in deck |
| Customers at full constellation | 10–50 enterprise/government; not in deck |
| Revenue ramp (years to first revenue after launch) | 6–12 months post first satellite; data product must be validated |
| COGS (ground station ops, data processing) | 20–35% of revenue; hardware is sunk cost in capex |
| R&D / headcount | based on team size at seed/Series A stage; not in deck |
| Gross margin (data business at scale) | 65–75%; high-margin once constellation is built |
| Capex intensity | $1.5M–$3M/yr in constellation build years (3–6 sats/yr × $500K) |
| Depreciation / amortisation of satellites | straight-line over 4-year life |
- Scenarios (Base / Bull / Bear - which variables flex):
- Bear: Slow customer wins (5 customers by Y5), constellation stays at 10 sats, data pricing pressure, satellite costs don't decline.
- Base: 20 customers by Y5, 25-sat constellation, $200K avg ACV, satellite cost holds at $500K.
- Bull: 50+ customers, 50-sat constellation, government weather contracts at $500K+ ACV, satellite costs drop 30% with volume, higher bandwidth drives premium pricing.
- Flex variables: constellation size, ACV per customer, satellite cost, time-to-first-revenue.
- Required sheets / outputs:
- Assumptions - all drivers in one place with scenario toggle (Base/Bull/Bear).
- Constellation Build Schedule - satellite count, launch dates, capex by period, depreciation schedule.
- Revenue Model - customers × ACV, by segment (comms vs. weather data), ARR waterfall.
- P&L (Income Statement) - revenue, COGS, gross profit, R&D, S&M, G&A, EBITDA, D&A, EBIT.
- Capex & Balance Sheet - satellite capex as fixed assets, funding rounds as equity, debt if any.
- Cash Flow Statement - operating CF, investing CF (satellite launches), financing CF (fundraising).
- Runway / funding bridge - months of cash at current burn, when next raise is needed.
- Dashboard - KPI summary: satellites in orbit, ARR, gross margin %, cash runway, capex to date.
Frequently asked
Is the Spire Global financial model free?+
Yes. The Spire Global model is a free Excel (.xlsx) download with live formulas. Sign up with your email and the workbook is yours to keep, review, and edit.
What's included in the model?+
A 5-year monthly forecast with P&L, cash flow and runway, valuation (exit multiple plus a DCF cross-check), MOIC/IRR returns, and unit economics, with live formulas throughout.
How was this model built?+
It was built from Spire Global's pitch deck and publicly available information, then structured to investment-banking standards as a fully editable Excel model.
Can I change the assumptions?+
Yes. You can change assumptions and the live formulas will recalculate in the downloadable Excel model.
Have more financial modelling questions? Contact us

Created by ex-finance professionals
Hey, I’m Alex and I created Finamodel.
Over my years in the finance industry I kept building the same models over and over again. Same structure, same assumptions, different logo. So I started building frameworks to turn them into clean, reusable templates.
Every model here is one I’d actually use for a client, and I personally vet each one before it goes up.
I’m not an expert in every industry, but I’ve built enough models to know what belongs in one. And when something is completely foreign to me, I reach out to my network for experts to work on our models with us.
Having a template library on hand cuts a first build from hours to minutes.
Need help finding your model? You’ll find me in the Finamodel app!
Other Hardware/Deep-tech Startup Financial Models
Browse another startup in the same category.

ANYbotics
ANYbotics builds and sells autonomous legged inspection robots (ANYmal) for industrial facilities, targeting oil & gas, chemicals, power, offshore, mining, and manufacturing sectors.
Awake Security
Awake Security - AI-driven Network Detection & Response (NDR) platform for the hybrid cloud, positioning as the "intent detection" layer of the SOC visibility triad.

Beem
AR communications platform that overlays full-body "hologram" video of a person into the recipient's physical space via smartphone or web.

Blue White Robotics
Autonomous robotics platform converting existing farm equipment to self-driving tractors for permanent-crop growers, sold as Robots-as-a-Service.

Cambridge GaN Devices
Fabless semiconductor startup commercialising self-protected GaN power transistors (HiGaN) that replace silicon and standard GaN with higher efficiency and no external protection circuitry.

Canix
Cannabis-focused ERP (inventory tracking, compliance automation, sales management, yield forecasting) sold as SaaS to cannabis cultivators, manufacturers, and distributors.
Chobani
Chobani is the US market leader in Greek yogurt; TPG invested $671M in April 2014 for a 35% stake via a structured second lien + equity deal
Cipher Skin
Wearable sensor mesh platform that collects dense multi-modal data from human bodies and industrial objects to predict structural and functional failure before it occurs.


