 TVision Financial Model
Media/Gaming Startup Financials (Free Excel Download)
TVision provides a person-level TV and CTV audience measurement panel, sold as a data product to advertisers, agencies, and measurement competitors seeking an alternative to Nielsen.



professionals from Deloitte
Used by professionals from






About this model
TVision operates an opt-in household panel that measures person-level cross-device viewing at second-by-second detail. It positions the panel as a cheaper, more usable alternative to Nielsen and as a calibration layer for broader ACR or set-top-box data used in cross-media measurement.
Clients subscribe to ARR-based data licences and measurement outputs. The company’s panel supports ratings and marketing-mix modelling today, while its wider data vision includes attribution, reach and frequency, fraud detection, audience segmentation, media planning, forecasting, and creative optimisation. Pricing, contract value, customer count, NRR, and churn are not disclosed.
ARR grew at a 43% CAGR from 2019 to 2022, while recurring revenue rose from 20% to 85% of the business and CTV from 18% to 42% of ARR. The model should build subscriber licences, CTV mix, renewals, panel recruitment, incentives, data processing, and sales capacity.
A turnkey financial model
Live formulas, no hardcoded values
Outputs are driven by live formulas, so the workbook updates from its assumptions instead of relying on hardcoded results.
All assumptions in one tab
Inputs are clearly marked in the Assumptions tab and separated from calculations, making it clear what to change and what to leave intact.
Statements always balancing
For integrated-statement models, the balance sheet, cash flow, and supporting schedules tie through properly.
Distinct schedules for clarity
Debt, working capital, taxes, and cash flow can get messy quickly. We group calculations in clear schedules, not across disconnected tabs.
No hidden macros or external links
There are no unexplained external workbook links or macros to undermine auditability or portability.
Changes flow through the model
Update a key driver and see the impact carry through the forecast, financing, and return outputs. We never use hardcoded numbers in formulas.
About TVision
tvisioninsights.com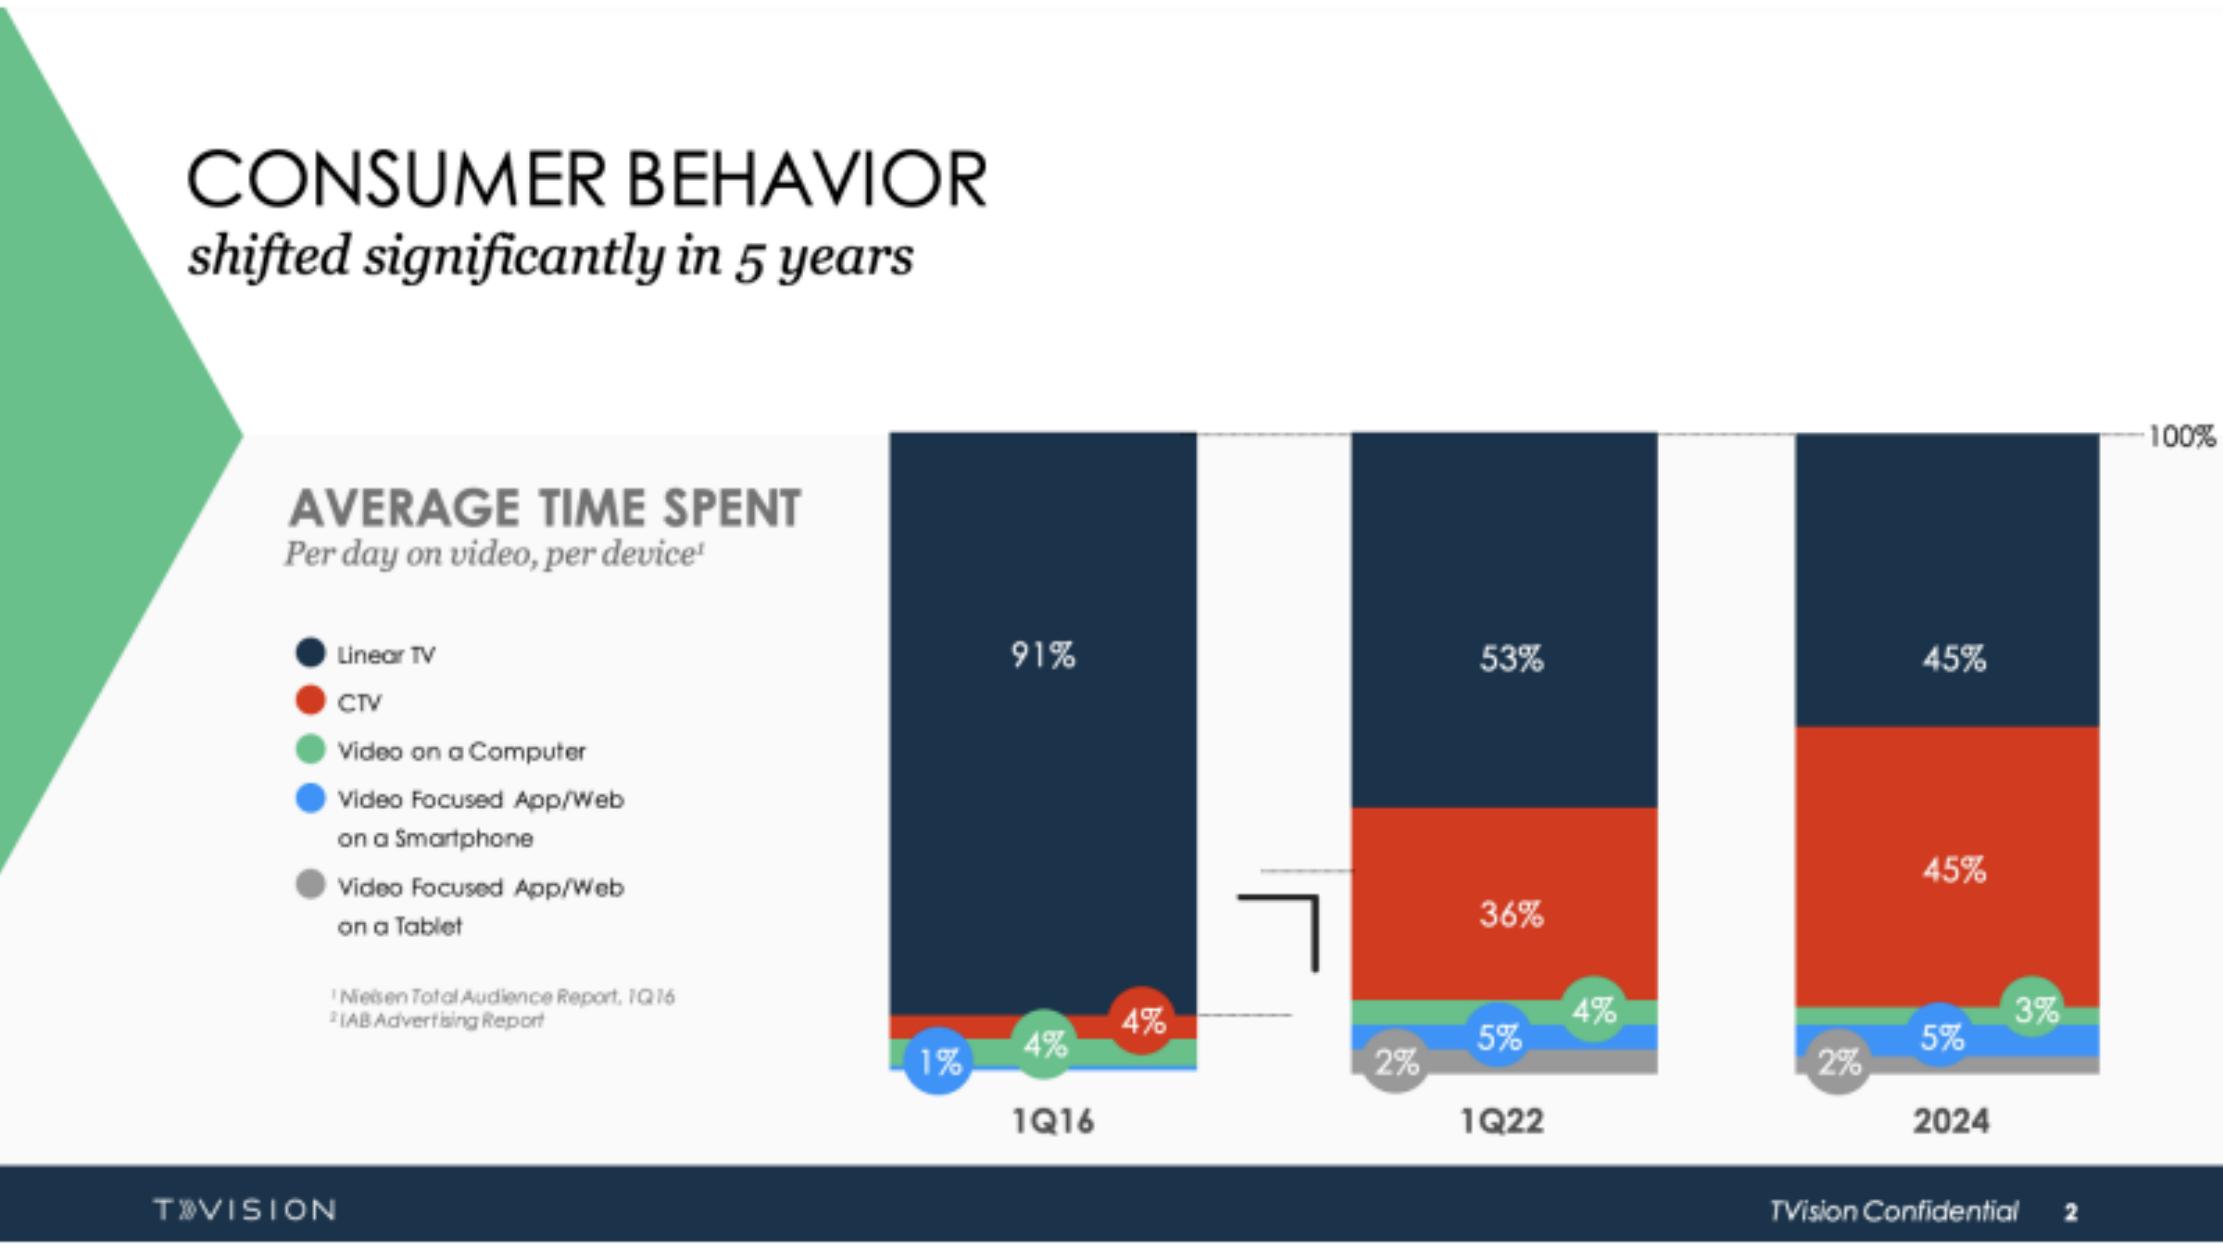
How to build a detailed financial model for TVision
A complete walkthrough of the business, drivers, and assumptions behind the downloadable TVision model - distilled from its pitch deck and publicly available information.
Product & value proposition
- Proprietary opt-in household panel measuring person-level TV and CTV viewing at second-by-second granularity across Linear TV, CTV, Computer, Smartphone, and Tablet.
- Positioned as a cheaper, easier-to-work-with alternative to Nielsen for audience measurement.
- Aligns with the WFA & ANA cross-media measurement framework requirements: panel + census data, cross-platform single-source panel, person-level insights, second-by-second duration metrics.
- Future vision: panel data used to calibrate "big data" (ACR/set-top box census streams), enabling a much wider range of applications beyond ratings - attribution, R/F, fraud detection, audience segmentation, new currencies, financial forecasts, creative optimization, scheduling, media planning, MMM.
- Today the panel powers Ratings and MMM; future state unlocks ~12 additional application categories.
Market
- No explicit TAM/SAM/SOM figures in the deck.
- Proxy market context provided: US Connected TV Ad Spending - $6.42B (2019) → $9.03B (2020) → $14.44B (2021) → $19.10B (2022) → $24.20B (2023) → $29.50B (2024); YoY growth decelerating from 59.9% (2021) to 21.9% (2024).
- Linear TV share of daily video time fell from 91% (1Q16) to 45% (2024); CTV share rose from 4% to 45% over same period.
Revenue model
- ARR-based subscription data licensing - clients subscribe to access TVision panel data and measurement outputs.
- Recurring revenue ratio improved from 20% to 85% over 4 years (2019–2022) - implies a shift away from one-time project/custom work toward recurring subscriptions.
- CTV-related ARR as a share of total business grew from 18% to 42%.
- No per-seat pricing, contract values, or ARPU figures disclosed.
- Customers implied to be: advertisers, agencies, media companies, and Nielsen competitors seeking a calibration panel.
Traction & metrics
- ARR CAGR of +43% from 2019 to 2022.
- Recurring revenue ratio: 20% (2019) → 85% (2022).
- CTV ARR mix: 18% (2019) → 42% (2022).
- ARR growth "accelerating by stronger new bookings and renewal ratio".
- Absolute ARR dollar values not legible on the chart y-axis (unlabeled scale).
- TVision described as powering "person-level measurement strategies for all significant Nielsen competitors".
- No customer count, NRR, or churn figure disclosed.
Competition / moat
- Primary competitor implied: Nielsen (named directly as the benchmark to beat - cheaper and easier to work with).
- Moat: proprietary opt-in panel; person-level, second-by-second granularity; cross-platform single-source data; alignment with WFA/ANA framework standards.
- TVision is explicitly powering "all significant Nielsen competitors" - suggesting it has become infrastructure for the emerging measurement ecosystem rather than a direct front-end competitor to Nielsen.
- No other named competitors.
Team & funding ask / use of funds
Recommended financial model
- Archetype + why: SaaS ARR subscription model. TVision's revenue is predominantly recurring (85% recurring ratio), subscription-based data licensing with a disclosed ARR metric and multi-year growth trajectory. The business tracks ARR, new bookings, renewals, and CTV mix - all standard SaaS ARR mechanics.
- Forecast horizon & granularity: 5-year annual model (2022–2027), monthly granularity in Year 1 for cash management visibility. The deck shows 2019–2022 actuals; a 5-year forward view is appropriate for a growth-stage B2B data company.
- Key drivers & assumptions:
| Driver | Value |
|---|---|
| Starting ARR (2022) | Unknown - y-axis unlabeled |
| ARR CAGR (historical) | +43% (2019–2022) |
| ARR growth rate - Base (fwd) | 35% YoY |
| ARR growth rate - Bull (fwd) | 50% YoY |
| ARR growth rate - Bear (fwd) | 20% YoY |
| Recurring revenue ratio | 85% (2022) |
| Recurring revenue ratio (fwd) | 90–95% |
| CTV ARR mix | 42% (2022) |
| CTV ARR growth premium vs. Linear | +10 pp |
| Gross margin | 70–75% |
| S&M as % of revenue | 25–30% |
| R&D as % of revenue | 15–20% |
| G&A as % of revenue | 10% |
| NRR | 110–120% |
| Logo churn | 5–10% annual |
- Scenarios (Base / Bull / Bear - which variables flex):
- Primary flex: ARR growth rate, NRR, CTV mix premium.
- Secondary flex: gross margin (as big-data products launch, margin profile could improve); S&M efficiency (CAC unknown).
- Bull case: big-data calibration platform monetizes; TVision becomes the reference panel for new measurement currencies - accelerates both logo growth and ARPU expansion.
- Bear case: Nielsen defends aggressively; CTV ad spend decelerates; panel size constraints limit client adoption.
- Required sheets / outputs:
- Assumptions - ARR growth, NRR, segment mix (CTV vs. Linear), headcount, margins.
- ARR Bridge - beginning ARR + new bookings + expansion − churn = ending ARR (annual + monthly Y1).
- Revenue P&L - ARR → recognized revenue → gross profit → EBITDA → net income.
- CTV vs. Linear ARR segmentation - track mix shift over forecast horizon.
- Cash Flow / Runway - operating cash burn, implied funding requirements.
- KPI Dashboard - ARR, ARR growth %, recurring revenue %, CTV mix %, gross margin, NRR.
- Scenario toggle - Base / Bull / Bear using CHOOSE.
Frequently asked
Is the TVision financial model free?+
Yes. The TVision model is a free Excel (.xlsx) download with live formulas. Sign up with your email and the workbook is yours to keep, review, and edit.
What's included in the model?+
A 5-year monthly forecast with P&L, cash flow and runway, valuation (exit multiple plus a DCF cross-check), MOIC/IRR returns, and unit economics, with live formulas throughout.
How was this model built?+
It was built from TVision's pitch deck and publicly available information, then structured to investment-banking standards as a fully editable Excel model.
Can I change the assumptions?+
Yes. You can change assumptions and the live formulas will recalculate in the downloadable Excel model.
Have more financial modelling questions? Contact us

Created by ex-finance professionals
Hey, I’m Alex and I created Finamodel.
Over my years in the finance industry I kept building the same models over and over again. Same structure, same assumptions, different logo. So I started building frameworks to turn them into clean, reusable templates.
Every model here is one I’d actually use for a client, and I personally vet each one before it goes up.
I’m not an expert in every industry, but I’ve built enough models to know what belongs in one. And when something is completely foreign to me, I reach out to my network for experts to work on our models with us.
Having a template library on hand cuts a first build from hours to minutes.
Need help finding your model? You’ll find me in the Finamodel app!
Other Media/Gaming Startup Financial Models
Browse another startup in the same category.

Almost Friday
Almost Friday is a multi-platform comedy/lifestyle media brand built around the "Friday Beers" universe, monetising through apparel, brand partnerships, events, podcasts, and music.

Amagi
Cloud-native SaaS platform for TV/OTT channel creation, distribution, and ad monetization (FAST-focused)

Audoo
IoT + SaaS platform that captures real-time public music performance data and reports it to Performing Rights Organisations (PROs) to enable accurate royalty distribution.
Backbone
Backbone makes a mobile gaming controller (hardware) + unified software platform (Backbone app) that aggregates all game streaming services in one place.
Beacon Pines
Beacon Pines is a cute-and-creepy narrative adventure game set inside a magical storybook, developed by indie studio Hiding Spot Games.
Bear and Breakfast
A management/adventure video game where you play as a bear running a B&B cabin in the woods.
Bioshock
BioShock is a first-person action horror game pitched to a publisher for development funding - a game-development studio deal, not an operating startup.

Button City 2018
Indie narrative adventure game about cute animal kids saving their local arcade, targeting console and PC.


