WAWarlands Financial Model
Crypto/Web3 Startup Financials (Free Excel Download)
Blockchain-based competitive esports game (MOBA + Battle Royale hybrid) with a Play-to-Earn token economy and integrated NFT marketplace.



professionals from Deloitte
Used by professionals from






About this model
Warlands is a competitive blockchain esports game blending MOBA and battle-royale gameplay with a play-to-earn economy. It combines tokens and an integrated NFT marketplace, while its broader monetisation plan includes subscriptions, entry fees, marketplace commissions, token fees, advertising, and tournament tickets.
The project has international ambitions, including references to a Brazilian esports-club acquisition and multilingual reach, but the research provides no operating history or disclosed funding. Its commercial performance therefore depends on whether competitive gameplay can attract and retain players beyond the initial token and collectible proposition.
Model active players, payer conversion, subscriptions, tournament participation, entry fees, NFT primary sales, marketplace GMV, and commission rate separately. Treat token rewards as an economic outflow, not ordinary cash revenue, and include development, esports operations, live service, community, and acquisition costs. Retention, tournament activity, NFT demand, take rate, token price, and release cadence should drive scenarios.
A turnkey financial model
Live formulas, no hardcoded values
Outputs are driven by live formulas, so the workbook updates from its assumptions instead of relying on hardcoded results.
All assumptions in one tab
Inputs are clearly marked in the Assumptions tab and separated from calculations, making it clear what to change and what to leave intact.
Statements always balancing
For integrated-statement models, the balance sheet, cash flow, and supporting schedules tie through properly.
Distinct schedules for clarity
Debt, working capital, taxes, and cash flow can get messy quickly. We group calculations in clear schedules, not across disconnected tabs.
No hidden macros or external links
There are no unexplained external workbook links or macros to undermine auditability or portability.
Changes flow through the model
Update a key driver and see the impact carry through the forecast, financing, and return outputs. We never use hardcoded numbers in formulas.
About Warlands
https: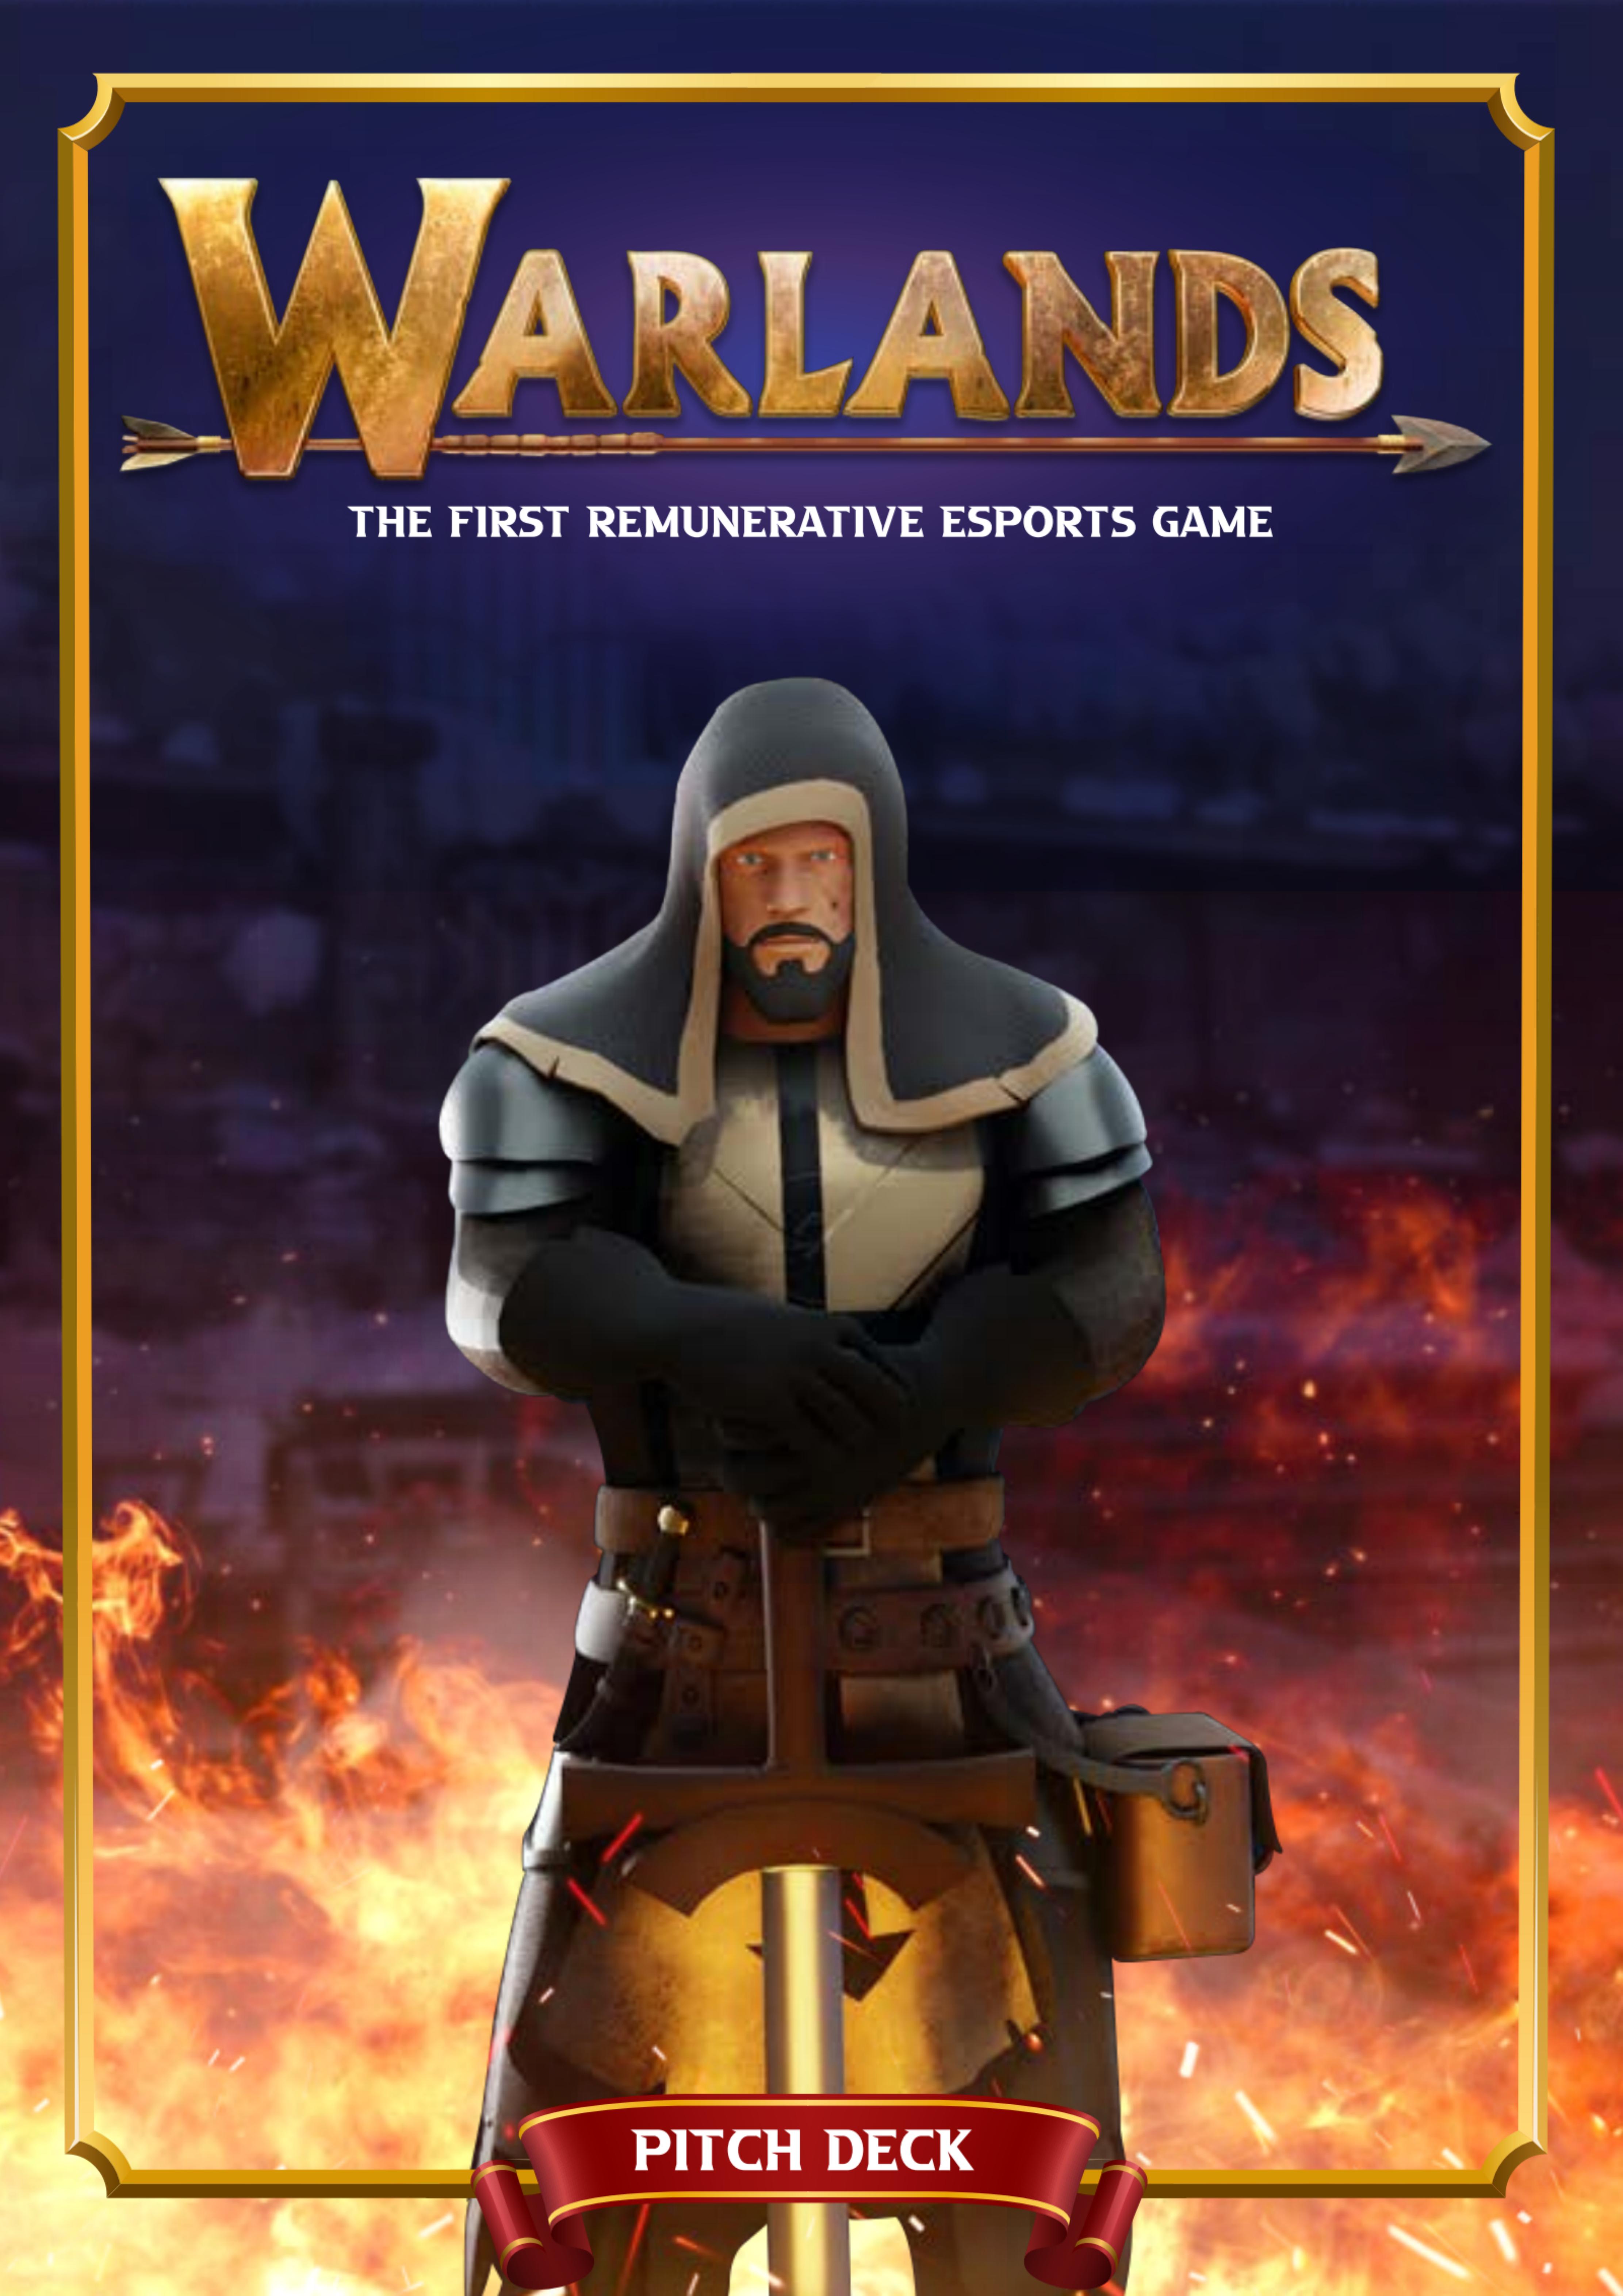
How to build a detailed financial model for Warlands
A complete walkthrough of the business, drivers, and assumptions behind the downloadable Warlands model - distilled from its pitch deck and publicly available information.
Product & value proposition
- Multiplatform (mobile + PC) competitive 5v5 game blending MOBA and Battle Royale mechanics.
- Blockchain-native: NFT items, a proprietary token (WARLANDS COINS, symbol WARLANDS, total supply 100,000,000), Play & Earn economy.
- Entry-fee ("ticket-to-play") model like poker - each match has a buy-in.
- DAO-tokenized esports club (Brazilian club acquisition announced) - fans share decisions and prize earnings.
- Metaverse-to-physical integration: token discounts at partner retailers (supermarkets, food, tickets).
- 55-person team with 8+ years game dev experience; prior mobile titles with millions of downloads.
Market
- Global gaming ecosystem: >$100B, >2B gamers worldwide.
- Global eSports market (TAM proxy):
- 2020: $1,215.6M
- 2021: $1,484.3M
- 2022: $1,823.0M
- 2023: $2,252.4M
- 2024: $2,800.0M
- 2025: $3,502.7M
- 2026: $4,410.0M
- 2027–2028: $5,589.2M
- Top gaming sub-genres by time spent (H1 2021): Battle Royale 16%, MOBA 12% - the two genres Warlands combines.
- Streaming hours watched (top Western platforms Q1 2019 vs Q1 2021): Twitch 3.6B → 8.8B hrs (~+144%), YouTube Gaming 0.7B → 1.4B, FB Gaming 0.1B → 1.1B.
- Global video games revenue projected to ~$500B by 2030 (source: GlobalData Thematic Research, chart scale read from image).
Revenue model
Seven revenue verticals, all expressed as ARPU × % of DAU performing action:
| Revenue Type | % Players | Daily ARPU (€) |
|---|---|---|
| Ads (interstitial) | 100% | 0.05 |
| Immersive Ads | 100% | 5.00 |
| Marketplace (NFT/item) | 15% | 10.00 |
| Subscriptions | 20% | 2.50 |
| Scholarships Subscriptions | 25% | 5.00 |
| Guilds Subscriptions | 25% | 1.50 |
| Scholarships Fee | 20% | 1.50 |
| PvP Entry (ticket to play) | 25% | 5.00 |
| Tournaments | 10% | 1.50 |
| Guild Free Tournaments | 10% | 1.50 |
| Guilds Wars | 5% | 2.50 |
| Chests (loot boxes) | 5% | 75.00 |
| Whitedraws (withdrawals) | 5% | 10.00 |
| Buy Token Fee | 5% | 6.00 |
| Sell Token Fee | 5% | 6.00 |
Blended daily rev per DAU at 100% weights = €16.50 (confirmed by deck's own DAU daily revenue total for 1,000 DAU = €16,500).
Traction & metrics
- No live revenue or player count stated. Deck is pre-launch.
- Team: 55 members, 8 years dev experience.
- Projected revenue scenarios (daily, based on DAU):
- 1,000 DAU → €16,500/day → €495,000/month
- 10,000 DAU → €165,000/day → €4,950,000/month
- 100,000 DAU → €1,650,000/day → €49,500,000/month
- 200,000 DAU → €3,300,000/day → €99,000,000/month
- 500,000 DAU → €8,250,000/day → €247,500,000/month
- Note: These are model projections, not actual traction numbers.
Unit economics
Monthly cost base at 1,000 DAU scale:
| Expense | Monthly (€) | Note |
|---|---|---|
| Dev team (15 people × €2,200) | 27,000 | - |
| Marketing team (5 × €1,800) | 9,000 | - |
| Team A – economists/mods (5 × €1,800) | 9,000 | - |
| Board (3 × €1,800) | 5,400 | - |
| Advertising | 60,000 | €2,000/day avg |
| Taxes | 95,925 | 25% of billed |
| Insurance | 38,370 | 10% of billed |
| Contingencies / R&D | 38,370 | - |
| Servers | 57,555 | 15% of billed |
| Total Monthly Expenditure | 340,620 | - |
Monthly net at stated DAU scenarios:
- 100 DAU: €43,080 net (implausible given cost base at 100 DAU - likely typo/error in deck)
- 500 DAU: €1,577,880 net
- 1,000 DAU: €3,496,380 net
Competition / moat
- Direct competitors cited by sub-genre: Free Fire (Battle Royale), Honour of Kings (MOBA), Call of Duty: Mobile.
- Moat claims: 8-year proprietary development, data-driven game design, first-mover on "AAA hybrid esports + blockchain" multiplatform, DAO club ownership, team profit-share mechanism.
- No explicit competitive matrix or differentiation slide.
Team & funding ask / use of funds
Team:
- Oliver Pérez - CEO (Founder)
- Norberto - CMO
- Ayush Ranjan - CTO
- Hamza - CFO
- Abhi - Lead Tech Officer
- Anagh - Art Director
- Karan - Blockchain Lead
Funding ask: Not explicitly stated in deck (no round size, valuation, or use-of-funds table).
Token capital distribution (how raised token capital will be allocated):
- 50% Developer Team
- 20% Promotion
- 10% Marketing Team
- 10% Team (salaries / profit share)
- 10% Structure
Token distribution (100,000,000 total supply):
- 52% Play & Earn
- 10% Presale
- 10% Team (development expenses)
- 10% Liquidity
- 8% Marketing
- 5% Reserve & exclusive partners
- 5% Airdrops
Recommended financial model
Archetype + why: Web3 Gaming / P2E ARPU model - the deck already uses a DAU/MAU × ARPU × conversion-rate framework across 15 revenue streams, combined with a token economy layer. This is structurally a free-to-play ARPU model with an additional on-chain transaction fee revenue stream. The recommended archetype is a multi-stream F2P/P2E game P&L model with token economics integrated (not a SaaS ARR model, not a marketplace GMV model, not a 3-statement with meaningful balance sheet drivers at this stage). Token presale proceeds should be modelled as a separate capital event, not recurring revenue.
Forecast horizon & granularity:
- 3 years monthly (pre-launch Y1 through scale Y3)
- Phase 0 (months 1–6): pre-launch / presale - token raise, no game revenue
- Phase 1 (months 7–18): soft launch, DAU ramp from 0 → ~10,000
- Phase 2 (months 19–36): growth to 100,000+ DAU target
Key drivers & assumptions:
| Driver | Value | Source |
|---|---|---|
| Daily ARPU – Immersive Ads | €5.00/DAU | - |
| Daily ARPU – PvP Entry fee | €5.00/DAU @ 25% conversion | - |
| Daily ARPU – Marketplace | €10.00/DAU @ 15% conversion | - |
| Daily ARPU – Chest purchases | €75.00/DAU @ 5% conversion | - |
| Blended daily rev per DAU | €16.50 | - |
| MAU/DAU ratio | 30× (i.e. DAU ≈ 3.3% of MAU) | - |
| Monthly base cost at 28-head team | €340,620 | - |
| Advertising spend | €60,000/month (~€2k/day) | - |
| Tax rate | 25% of gross revenue | - |
| Server cost | 15% of gross revenue | - |
| Insurance | 10% of gross revenue | - |
| Contingencies/R&D | 10% of gross revenue | - |
| Token total supply | 100,000,000 WARLANDS | - |
| Presale allocation | 10% of total supply (10M tokens) | - |
| Presale token price | €0.05–€0.10 - typical P2E presale range; no price disclosed in deck | |
| DAU ramp rate post-launch | +20% MoM in growth phase - mobile gaming benchmark for well-marketed titles | |
| User acquisition cost (CAC) | €1.50–€3.00 per install - mobile gaming industry average; deck mentions €2k/day ad spend | |
| Day-30 retention | 20–25% - mobile MOBA/BR benchmark | |
| Churn rate (monthly) | 10–15% of active users per month | |
| Marketplace take rate | 5–10% of NFT/item transaction value (commission to platform) | |
| Token price / market cap | volatile; model as sensitivity variable, not base case revenue driver |
Scenarios (Base / Bull / Bear - which variables flex):
- Bear: DAU plateau at 10,000 (MAU 300,000); blended ARPU at 70% of deck figure due to lower conversion; CAC €3.
- Base: DAU ramp to 100,000 (MAU 3,000,000) by month 30; ARPU at deck rates; CAC €2.
- Bull: DAU 500,000 (MAU 15,000,000) by month 36; viral/organic growth reduces CAC to €1; immersive ad ARPU premium due to brand deals.
Required sheets / outputs:
- Assumptions - all drivers, toggleable scenario selector (Base/Bull/Bear)
- User Growth - DAU/MAU ramp, cohort installs, churn, retention
- Revenue Build - 15 revenue streams, each: DAU × conversion % × ARPU × 30 days
- Cost Build - fixed headcount costs + variable costs (taxes, servers, insurance, R&D, advertising) as % of revenue
- P&L Summary - Gross Revenue, variable costs, gross margin, fixed OpEx, EBITDA, net income
- Token Economics - supply schedule, presale raise, vesting, Play & Earn emission rate, token treasury
- Cash Flow - operating cash flow, presale proceeds as financing inflow, runway calculator
- Sensitivity - EBITDA vs DAU (rows) × blended ARPU (columns)
- Dashboard - KPI cards: DAU, MAU, monthly revenue, EBITDA, runway months
Frequently asked
Is the Warlands financial model free?+
Yes. The Warlands model is a free Excel (.xlsx) download with live formulas. Sign up with your email and the workbook is yours to keep, review, and edit.
What's included in the model?+
A 5-year monthly forecast with P&L, cash flow and runway, valuation (exit multiple plus a DCF cross-check), MOIC/IRR returns, and unit economics, with live formulas throughout.
How was this model built?+
It was built from Warlands's pitch deck and publicly available information, then structured to investment-banking standards as a fully editable Excel model.
Can I change the assumptions?+
Yes. You can change assumptions and the live formulas will recalculate in the downloadable Excel model.
Have more financial modelling questions? Contact us

Created by ex-finance professionals
Hey, I’m Alex and I created Finamodel.
Over my years in the finance industry I kept building the same models over and over again. Same structure, same assumptions, different logo. So I started building frameworks to turn them into clean, reusable templates.
Every model here is one I’d actually use for a client, and I personally vet each one before it goes up.
I’m not an expert in every industry, but I’ve built enough models to know what belongs in one. And when something is completely foreign to me, I reach out to my network for experts to work on our models with us.
Having a template library on hand cuts a first build from hours to minutes.
Need help finding your model? You’ll find me in the Finamodel app!
Other Crypto/Web3 Startup Financial Models
Browse another startup in the same category.
0x Labs
0x Labs builds open exchange infrastructure (protocol, API, consumer app) for on-chain token trading across multiple blockchains.

1inch Network
DeFi aggregation protocol that routes crypto swaps across 100+ liquidity sources to deliver best rates and lowest gas fees.

Aether
Synthetic biology platform that builds searchable protein indexes to engineer novel molecular assemblers for high-value industrial products.
Alto
Self-directed IRA platform enabling retail investors to invest in alternative assets (private equity, debt, real estate, crypto) via tax-advantaged retirement savings.
Auki Labs
Decentralized peer-to-peer spatial positioning SDK for social AR - building the infrastructure layer to replace GPS and enable a persistent AR metaverse.
Awesome People Ventures Fund 2
Awesome People Ventures is a community-driven, decentralized early-stage Web3 VC fund raising Fund II.

Axelar
Cross-chain blockchain overlay network enabling universal transfer of assets, transactions, and state across all blockchain ecosystems.
BRD
BRD is a non-custodial crypto wallet app (consumer) and blockchain infrastructure API platform (enterprise) targeting mass-market crypto adoption.


